Search results
Search for "EIS" in Full Text gives 83 result(s) in Beilstein Journal of Nanotechnology.
Enhancing the photoelectrochemical performance of BiOI-derived BiVO4 films by controlled-intensity current electrodeposition
Beilstein J. Nanotechnol. 2025, 16, 1289–1301, doi:10.3762/bjnano.16.94

- illuminated the sample from the back of the FTO glass. Under AM1.5G illumination, electrochemical impedance spectroscopy (EIS) measurements were performed at an open-circuit voltage, covering a frequency spectrum from 1 Hz to 10 kHz. Mott–Schottky curves were recorded at a frequency of 1 kHz in a dark light
- curves, (c) hole injection efficiency (ηsurface) curves, and (d) EIS plots for each photoanode. (a) LSV curves under chopped illumination, (b) IPCE curves for each photoanode, and (c) chronoamperometry curve of BiVO4(326) measured at 1.23 V vs RHE under continuous AM1.5G illumination in 0.50 M Na2SO4 for


Synthesis of biowaste-derived carbon-dot-mediated silver nanoparticles and the evaluation of electrochemical properties for supercapacitor electrodes
Beilstein J. Nanotechnol. 2025, 16, 933–943, doi:10.3762/bjnano.16.71

- responsible for the decent rate capability and superior capacity of the PG-CDs-AgNPs electrode. To evaluate the capability of charge carrying within the electrode and the capacitive property of PG-CDs-AgNPs, electrochemical impedance spectroscopy (EIS) measurements were also implemented. The Nyquist plots of
- line in the low-frequency range of the EIS graphic describes the capacitive properties [37]. The equivalent series resistance (RESR), which is often generated from the ohmic and interfacial resistance of the electrolyte and electrode, respectively, is designated by the intersection of the semicircle on
- decent ionic mobility, TEABF4/DMSO may be helpful in maximizing the electrochemical activity. Comprehensive electrochemical experiments, such as cyclic stability, EIS, GCD, and CV evaluations, were conducted on the ASC device. A CV test (Figure 6b) of the ASC device was first performed at a fixed scan


Facile one-step radio frequency magnetron sputtering of Ni/NiO on stainless steel for an efficient electrode for hydrogen evolution reaction
Beilstein J. Nanotechnol. 2025, 16, 837–846, doi:10.3762/bjnano.16.63

- spectroscopy (EIS) was carried out at a voltage of −200 mV to confirm the HER kinetics. Figure 6c shows the Nyquist plots of the various electrodes accompanied by an equivalent circuit (inset of Figure 6c). Ni/NiO/SS-10 has a charge transfer resistance (Rct) of 5.35 Ω, which is much smaller than that of SS
- electrode was cut into pieces of 1 cm × 0.5 cm and a catalyst loading area of 0.5 cm × 0.5 cm. LSV was carried out at a scan rate of 2 mV·s−1, followed by 85% iR compensation, in a solution of 1.0 M KOH. EIS was investigated at a potential of −200 mV vs a reversible hydrogen electrode (RHE) in a frequency


Functionalized gold nanoflowers on carbon screen-printed electrodes: an electrochemical platform for biosensing hemagglutinin protein of influenza A H1N1 virus
Beilstein J. Nanotechnol. 2025, 16, 540–550, doi:10.3762/bjnano.16.42

- albumin (BSA) (Figure 3). This suggests that the final sensing platform preserved the favorable electrochemical properties achieved using AuNFs functionalized with 4-ATP. Electrochemical impedance spectroscopy (EIS) was performed to study the charge transfer processes at the surface of the modified
- electrode (Figure 4). In general terms, the elements of an electrochemical biosensor are analogous to the elements of an electric circuit [45]. A Randles equivalent circuit model was found to fit the experimental data obtained from the EIS analysis. This circuit contains a resistor (Rs) to represent the
- the concentration range from 10 to 10 000 pg/mL. The experimental EIS data suggest that the electron transfer on the electrode was enhanced by a factor of 100 due to the increase in surface area and to a tunneling charge transfer effect. This improvement is attributed to the synergistic effect of the


Quantification of lead through rod-shaped silver-doped zinc oxide nanoparticles using an electrochemical approach
Beilstein J. Nanotechnol. 2025, 16, 422–434, doi:10.3762/bjnano.16.33

- Ag 3d, (c) scan of oxygen 1s, and (d) scan of Zn 2p. Electrochemical impedance spectroscopy (EIS) Nyquist plots of modified Ag@ZnO NRs/Au and bare Au electrode. Cyclic voltammetry sweep curves for a modified electrode (black curve) or a bare electrode (red curve) in lead solution. Schematic diagram


Pulsed laser in liquid grafting of gold nanoparticle–carbon support composites
Beilstein J. Nanotechnol. 2025, 16, 349–361, doi:10.3762/bjnano.16.26

- , evident from electrochemical impedance spectroscopy (EIS) data (Figure 5B). Impedance, measured in an electrochemical setup, is the time-dependent opposition to alternating current stemming from the combined effect of ohmic resistance, capacitance, and phase elements in an electronic circuit. Impedance is
- a quantitative measure for electrical contact between nanoparticles and supports [64]. EIS data, visualized in a Nyquist plot, graph the negative imaginary impedance (Z) vs the real impedance [2]. Modeling the data with an electronic circuit that reflects the electrochemical system gives values for
- resistances (R) and capacitances at all interfaces and the electrolyte. In our EIS measurements, the most relevant circuit element is the charge transfer resistance (Rct) between the gold nanoparticles and the graphitic carbon support, measured at open circuit potential so that electrochemical reactions do


Characterization of ZnO nanoparticles synthesized using probiotic Lactiplantibacillus plantarum GP258
Beilstein J. Nanotechnol. 2025, 16, 78–89, doi:10.3762/bjnano.16.8

- (CV) and electrochemical impedance spectroscopy (EIS) were carried out at room temperature using a three-electrode cell with 0.1 M KCl electrolyte. The ZnO NP electrode was measured at scan rates from 10 to 50 mV/s. The measurements revealed reversibility and electrode load efficiency along with
- ppm dye solution containing 60 mg of ZnO NPs. The solution was irradiated with UV light at 392 nm, and aliquots were collected in 15 min intervals for spectrophotometric analysis using the Shimadzu UV-2600 double-beam spectrophotometer. CV and EIS were conducted using a CHI608E analyzer with a three
- -electrode setup (carbon paste with ZnO NPs as the working electrode, platinum as the counter electrode, and Ag/AgCl as the reference electrode) in 0.1 M KCl. EIS measurements were carried out in a frequency range of 1 Hz to 1 MHz with a 5 mV AC amplitude, while CV studies were carried out on the same


Electrochemical nanostructured CuBTC/FeBTC MOF composite sensor for enrofloxacin detection
Beilstein J. Nanotechnol. 2024, 15, 1522–1535, doi:10.3762/bjnano.15.120

- in the electrode material. Electrochemical property The Nyquist diagrams in Figure 5 were obtained using electrochemical impedance spectroscopy (EIS) in a 0.1 M KCl solution containing 5 mM [Fe(CN)6]3−/4−. Based on the EIS analysis, the charge transfer resistances (Rct) of CPE, CuBTC@CPE, and (Cu)(Fe
- Informatics in Chemistry, Institute of Chemistry, Vietnam Academy of Science and Technology). Electrochemical impedance spectroscopy (EIS) was performed by using an Autolab PGSTAT 302 in a frequency range of 100 kHz to 0.01 Hz. A three-electrode electrochemical setup was used including a platinum wire counter


Influence of conductive carbon and MnCo2O4 on morphological and electrical properties of hydrogels for electrochemical energy conversion
Beilstein J. Nanotechnol. 2024, 15, 57–70, doi:10.3762/bjnano.15.6

- hydrogel structure. The changes are within the range of 79.7–1390.5 kΩ at 0.01 Hz and 3.5–18.6 kΩ at 1 Hz. The trend of the electrochemical impedance spectroscopy (EIS) results shows the capacitive-dominant nature of the hydrogel for all analysed hydrogel-based electrodes. Three different regions were
- electrical properties strongly depend on the conductive carbon concentration (Figure 4d). A similar EIS behaviour was observed in the literature for several different hydrogel-based structures [26][52][53][54]. For comparison, the impedance values of gelatin methacryloyl (GelMA), GO/GelMA, and r(GO/GelMA) at
- were tested for biomedical applications. Nevertheless, they show that the impedance trend that we obtained is similar to that of other hydrogel materials presented in the literature. Additionally, experimental EIS data was modelled with simple electrical equivalent circuit (insert in Figure 4a), where


In situ magnesiothermic reduction synthesis of a Ge@C composite for high-performance lithium-ion batterie anodes
Beilstein J. Nanotechnol. 2023, 14, 751–761, doi:10.3762/bjnano.14.62

- and ionic conductivity, which was further analyzed using rate performance and EIS results. Figure 5b shows the rate performance of the Ge@C electrodes at different specific currents. The common phenomenon of capacity reduction at increasing specific currents is observed in all electrodes. However, the
- conductivity of the additional carbon matrix, indicating the decrease in charge transfer resistance of the composite electrodes. The EIS results were fitted using an equivalent circuit model, including an internal or electrolyte resistance (Re), a charge transfer resistance (Rct), and two constant phase
- . Electrochemical impedance spectroscopy (EIS) was carried out at the open-circuit voltage of the assembled cells after 6 h of resting on a Biologic VSP3 potentiostat. A sinusoidal signal with an amplitude of 10.0 mV and a frequency varying exponentially from 10 mHz to 100 kHz was used. (a) XRD patterns, (b) FTIR


A graphene quantum dots–glassy carbon electrode-based electrochemical sensor for monitoring malathion
Beilstein J. Nanotechnol. 2023, 14, 701–710, doi:10.3762/bjnano.14.56

- Brillouin zone, while the G band arises from vibrations in rings of sp2-hybridized atoms inside the GQDs. Electrochemical studies Electrochemical impedance spectroscopy In order to investigate the charge transfer on the electrode surfaces, electrochemical impedance spectroscopy (EIS) was used with the redox
- probe ferrocyanide. In EIS spectra, the semicircle component represents the charge transfer resistance (Rct) at the surface of the electrode. The Nyquist plots of the GQDs/GCE and the bare GCE are shown in Figure 6 in 0.1 M KCl solution containing 0.05 M [Fe(CN)6]3−/4−. The bare GCE electrode exhibits a
- distribution along with log-normal fit, (c) HRTEM image, and (d) AFM image of GQDs. (a) XRD pattern and (b) EDX spectra (inset showing weight and atomic percent of carbon and oxygen) of GQDs. (a) FTIR spectrum and (b) Raman spectrum of GQDs. EIS measurement of 0.1 M KCl containing 0.05 M [Fe(CN)6]3−/4− at the


Humidity-dependent electrical performance of CuO nanowire networks studied by electrochemical impedance spectroscopy
Beilstein J. Nanotechnol. 2023, 14, 683–691, doi:10.3762/bjnano.14.54

- compositions aligned by DEP [25]. In some of these works, electrochemical impedance spectroscopy (EIS) was used as an effective tool to study the effects of chemical and physical absorption of water on the nanostructured surfaces of active CuO elements of the systems [23][24]. To the best of our knowledge, the
- nanowires are synthesized by thermal oxidation [9] and aligned between metallic microelectrodes by DEP [26]. Electrical properties of the nanowire-based system at various RH values are assessed by EIS [27][28]. To attempt a systematic study on the suitability of the CuO nanowire networks for different
- applications, the measurements are performed in a RH range from 5% up to 97% and in a T range of 25–55 °C, which covers wider RH and T ranges than previous studies. Equivalent circuit models for the nanowire-based system are developed based on the EIS measurements. Fitting of the cell parameters shows


Evaluation of electrosynthesized reduced graphene oxide–Ni/Fe/Co-based (oxy)hydroxide catalysts towards the oxygen evolution reaction
Beilstein J. Nanotechnol. 2023, 14, 420–433, doi:10.3762/bjnano.14.34
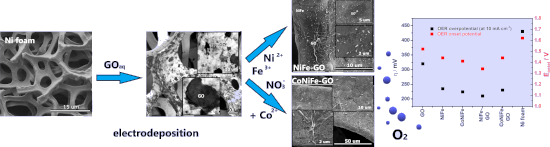
- the improvement in the OER of NiFe-GO with the higher Qdep of NiFe and GO resulted mainly from the NiFe structure and the electroactive surface area and the porosity of GO. Electrochemical impedance spectroscopy (EIS) was performed in order to determine the charge transfer resistance (Rct) of the
- specific catalysts. The EIS spectra are presented in Supporting Information File 1 (Figure S4). Rct values of 0.43, 0.50, 0.57, and 0.65 Ω were determined for NiFe-GO, CoNiFe, CoNiFe-GO, and NiFe, respectively. A decrease in Rct is associated with more efficient reaction rates for the OER. The EIS results
- RHE with a scan rate of 5 mV·s−1. The EIS spectra were recorded in the frequency range from 10 kHz to 1 Hz at 1.6 V vs RHE and amplitude of 10 mV. In order to determine Rct, EIS spectra were fitted with a simple Randles model with the solution resistance, charge transfer resistance, and the constant


Photoelectrochemical water oxidation over TiO2 nanotubes modified with MoS2 and g-C3N4
Beilstein J. Nanotechnol. 2022, 13, 1541–1550, doi:10.3762/bjnano.13.127

- with previous publications [50][51][52]. Figure 5 shows the results of electrochemical impedance spectroscopy (EIS), that is, Nyquist and Mott–Schottky plots of the materials, which give information about the charge transfer mechanism at the interface. In Figure 5a, the Nyquist plots of the samples all
- consistent with the previous results from EIS analysis and the Mott–Schottky results (Figure 5). The PEC activity of MoS2/TNAs in this study is higher than that of MoS2/TNAs synthesized by using a PVA binder agent in [36]. However, the direct combination of g-C3N4 with TNAs at a relatively high fabrication
- is in agreement with the EIS results in Figure 5a, where the arc radius of the Nyquist plot of MoS2/TNAs was the smallest, indicating that MoS2/TNAs effectively decreased the resistance of the TNAs and, thus, speeded up the charge transfer on the photoelectrode. These arguments are consistent with


A TiO2@MWCNTs nanocomposite photoanode for solar-driven water splitting
Beilstein J. Nanotechnol. 2022, 13, 1520–1530, doi:10.3762/bjnano.13.125

- electrode [35]. Based on the cyclic voltammetry results, it could be suggested that the TiO2@MWCNTs electrode is superior regarding photoelectrochemical application compared to TiO2 and MWCNTs electrodes. Electrochemical impedance spectroscopy (EIS) is applied to characterize the electron-transfer property
- conductivity of TiO2 [37]. Table 1 shows the EIS parameters obtained from fitting the measured results with equivalent circuits. The R1 values illustrate a low electrical resistance of the 0.1 M KCl solution, while the R2 values show that the TiO2 electrode has the highest resistance among the prepared
- not found in the TiO2 and TiO2@MWCNTs electrodes [41]. The EIS spectrum shows that the Voigt circuit is found to fit the TiO2 electrode. In contrast, the EIS spectrum of the TiO2@MWCNTs electrode, including two semicircle parts, demonstrates different responses of the electrode at low and high


Rapid and sensitive detection of box turtles using an electrochemical DNA biosensor based on a gold/graphene nanocomposite
Beilstein J. Nanotechnol. 2022, 13, 1458–1472, doi:10.3762/bjnano.13.120

- using electrochemical impedance spectroscopy (EIS) measurements. In 2.0 mM [Fe(CN)6]3−/4− containing 0.2 M KCl as the supporting electrolyte, the Nyquist plots of the SPCE, Gr/SPCE, AuNPs/SPCE, and AuNPs/Gr/SPCE are shown in Figure 3d. The inset is the equivalent circuit indicating the charge transfer
- than that of individual nanomaterial-modified SPCEs, representing a limitation of electron transfer through the electrode–solution interface [56] for different electrode surfaces. The EIS plots for the modified SPCEs surfaces also reveal that the electrode–solution interfacial charge transfer process
- group in 2008 reported optimisation of DNA immobilisation on gold electrodes for label-free detection by EIS [63]. Another group published a report for label-free DNA detection using the EIS technique with PNA probes, and they discovered that detection can be greatly improved when using uncharged


LED-light-activated photocatalytic performance of metal-free carbon-modified hexagonal boron nitride towards degradation of methylene blue and phenol
Beilstein J. Nanotechnol. 2022, 13, 1380–1392, doi:10.3762/bjnano.13.114

- . The Mott–Schottky (MS) analysis was performed at a frequency of 1 kHz while the electrochemical impedance spectroscopy (EIS) studies were conducted at 0 V DC under a frequency range of 105 to 100 Hz. The open circuit potential as a function of time (OCPT) was performed under alternating light and dark
- reflectance for the specified materials, respectively. It was observed that the MBN had an enhanced LHE (90%) in comparison to that of HBN with zero activity in the visible range, 85% (MBN-50), and 70% (MBN-25). Electrochemical analysis The EIS analysis provides further evidence on the enhanced performance of


Near-infrared photoactive Ag-Zn-Ga-S-Se quantum dots for high-performance quantum dot-sensitized solar cells
Beilstein J. Nanotechnol. 2022, 13, 1337–1344, doi:10.3762/bjnano.13.110

- fabricated QDSCs. J–V curve of the fabricated QDSCs. Electrochemical impedance (EIS) parameter values of the fabricated QDSCs. The values of Rs and τs and photovoltaic parameters of the synthesized QDSC in comparison with those of a Zn-Ag-In-S QD-sensitized QDSC and a Zn-Ag-In-Se QD-sensitized QDSC


Spindle-like MIL101(Fe) decorated with Bi2O3 nanoparticles for enhanced degradation of chlortetracycline under visible-light irradiation
Beilstein J. Nanotechnol. 2022, 13, 1038–1050, doi:10.3762/bjnano.13.91

- ) with BaSO4 as a reference. The photoluminescence spectrum (PL) was obtained from a luminescence spectrometer at an excitation wavelength of 446 nm (RF-530IPC, Shimadzu, Japan). The photocurrent response and electrochemical impedance spectra (EIS) were measured by an electrochemical workstation
- suggests that the formation of the heterojunction can promote charge transfer on the interface between MIL101(Fe) and Bi2O3. Furthermore, the interfacial charge transfer behavior of the BOM-20 composite is also confirmed by EIS. In Figure 5d, BOM-20 exhibits the smallest arc radius, meaning that BOM-20
- possesses the lowest resistance and the highest separation rate of electron–hole pairs on the interface of MIL101(Fe) and Bi2O3 [57], which is consistent with the results from PL spectra and photocurrent analysis. In summary, PL spectra, photocurrent responses, and EIS analysis all indicated that Bi2O3


Electrocatalytic oxygen reduction activity of AgCoCu oxides on reduced graphene oxide in alkaline media
Beilstein J. Nanotechnol. 2022, 13, 1020–1029, doi:10.3762/bjnano.13.89

- polarization curves of various catalysts in O2-saturated 0.1 M KOH electrolyte at 1600 rpm and a sweep rate of 10 mV·s−1. (b) Corresponding Tafel plots. (c) Mass activity obtained at 0.7 V for all active catalysts and (d) Nyquist plots (the inset shows high-frequency EIS curves). (a) TEM and (b) HRTEM images


Hierarchical Bi2WO6/TiO2-nanotube composites derived from natural cellulose for visible-light photocatalytic treatment of pollutants
Beilstein J. Nanotechnol. 2022, 13, 745–762, doi:10.3762/bjnano.13.66

- , respectively. The transient photocurrent responses and electrochemical impedance spectroscopy (EIS) Nyquist plots (frequency: 0.01 Hz−100 kHz, alternate current: 5 mV) of a given sample were obtained on a CHI 760D (Shanghai, China) electrochemical workstation using a three-electrode system. The Pt plate (1.0
- performs analog results as compared to the PL characterization, suggesting the most effective separation and transfer of photogenerated carriers of the 70%−Bi2WO6/TiO2-NT and 90%−Bi2WO6/TiO2-NT nanocomposites. EIS Nyquist plots of samples are usually employed to determine the transfer resistances and
- efficiencies of the photogenerated charges of the corresponding electrodes. As displayed in Figure 10b, the circular arc radii in the EIS Nyquist plots of all the Bi2WO6/TiO2-NT nanocomposites are smaller than those of the pure Bi2WO6 powder sample apart from the 30%−Bi2WO6/TiO2-NT nanocomposite. This


A nonenzymatic reduced graphene oxide-based nanosensor for parathion
Beilstein J. Nanotechnol. 2022, 13, 730–744, doi:10.3762/bjnano.13.65

- Technologies, USA), which was connected by a three-electrode system, including a modified and/or unmodified GCE as the working electrode, a saturated Ag/AgCl as the reference electrode (RE), and a platinum wire as the counter electrode (CE). The electrochemical impedance spectroscopy (EIS) study of the
- nonenzymatic electrochemical nanosensor based on ERGO for rapid detection of PT. The electrochemical parameters were optimized to achieve the highest performance of the ERGO-modified electrode, and the structure was characterized by Raman, XRD, XPS, TEM, FESEM, and EIS techniques. Square-wave voltammetry was


Influence of thickness and morphology of MoS2 on the performance of counter electrodes in dye-sensitized solar cells
Beilstein J. Nanotechnol. 2022, 13, 528–537, doi:10.3762/bjnano.13.44

- electrocatalytic behavior of the MoS2 CEs was carried out by using the EIS technique under dark conditions using full cells assembled from different MoS2/FTO CEs or a Pt/FTO CE. The Nyquist plots for these cells exhibited two semicircles as presented in Figure 6. The first semicircle in the high-frequency region
- is associated with the reduction of I3− at the cathode (CE/electrolyte), while the second one in the low-frequency region is attributed to electron transport in the TiO2 film in the back reaction at the TiO2/electrolyte interface (TiO2/dye/electrolyte). EIS data were fitted using an equivalent
- (EIS) of the fabricated DSSCs was carried out using an Autolab 302 N equipped with a FRA 32M module. The EIS measurements were carried out at open-circuit voltage with an alternating voltage amplitude of 10 mV under dark conditions in a frequency range between 0.01 Hz and 100 kHz. The efficiency of the


A non-enzymatic electrochemical hydrogen peroxide sensor based on copper oxide nanostructures
Beilstein J. Nanotechnol. 2022, 13, 424–436, doi:10.3762/bjnano.13.35

- EIS curve and the corresponding equivalent circuit are presented. The absence of characteristic semicircles formed by RCs by the circuit elements indicates a low charge transfer resistance and the predominance of Warburg diffusion over other processes in the electrochemical system. Figure 3f shows an
- unambiguous change in the EIS curves as a reaction to the addition of small concentrations of H2O2 to the solution. The active surface area of an electrode can be calculated using the Randles–Sevcik equation [83][84][85], which at 25 °C is: where Ip represents the redox peak current (A), n is the number of
- cycles (n = 10). Measurements were carried out in 0.1 M NaOH solution containing 5 mM H2O2. (d) EIS analysis (frequency range from 1 Hz to 100 kHz at an applied signal voltage of about 0.3 V). Measurements were carried out in 0.1 M NaOH solution containing 0–200 μM H2O2. SEM images of CuO nanostructures


Tin dioxide nanomaterial-based photocatalysts for nitrogen oxide oxidation: a review
Beilstein J. Nanotechnol. 2022, 13, 96–113, doi:10.3762/bjnano.13.7

- spectroscopy (EIS) data, and the nanosecond-level time-resolved fluorescence decay spectra (Figure 11) demonstrated that the SnO2/NCDs/ZHS nanohybrid achieved low charge carrier recombination, high photoactivity, and excellent photoinduced charge transfer to the surface of the semiconductor. This study enables
- of SnO2. Moreover, enhanced visible light response and enhanced charge separation in the sample with GQDs have been observed (Figure 13c). The EIS measurements (Figure 13d) indicated that the diameter of the arc radius of SnO2/GQDs (1%) is much smaller than that of SnO2, confirming that the GQDs
- generation architectural structure of heterojunctions toward visible-light-driven NO degradation”, article no. 117510, Copyright (2021), with permission from Elsevier. This content is not subject to CC BY 4.0. (a) Surface photovoltage spectroscopy, (b) transient photocurrent responses, (c) EIS Nyquist plots


