Abstract
Tb2.96−xCe0.04GdxAl5O12 phosphors were synthesized through solid-state reactions. The influence of Gd3+ on the luminescence was investigated. Under the excitation at 460 nm, Tb2.96Ce0.04Al5O12 shows the characteristic emission band of Ce3+ with a peak wavelength at about 554 nm. After co-doping Gd3+ into Tb2.96Ce0.04Al5O12, the peak wavelength of the Ce3+ emission band shifts to longer wavelengths, which is induced by the increasing crystal field splitting. However, the Ce3+ emission intensity also decreases because the substitution of Tb3+ with Gd3+ causes lattice deformation and generates numerous structural and chemical defects. By comparing the light parameters of white light-emitting diodes (WLEDs) containing Y2.96Ce0.04Al5O12, Tb2.96Ce0.04Al5O12 and Tb2.81Ce0.04Gd0.15Al5O12 phosphors, we can find that the WLED containing the Tb2.81Ce0.04Gd0.15Al5O12 phosphor generates warmer light than the WLEDs containing Y2.96Ce0.04Al5O12 and Tb2.96Ce0.04Al5O12 phosphors. Moreover, the WLEDs fabricated by integrating a blue LED chip and Ce3+/Gd3+-co-doped Tb3Al5O12 phosphors show outstanding colour stability when driven under different currents.
Introduction
Currently, the most popular fabrication model of white light-emitting diodes (WLEDs) is to combine blue chips with yellow Y3Al5O12:Ce3+ phosphors, which has the disadvantages of low colour-rendering index (CRI) and high correlated colour temperature (CCT) [1,2]. At the same time, this type of WLEDs has the advantages of long lifetime, eco-friendliness, high luminous efficiency and low energy consumption, which helps to mitigate two serious issues in the world, namely ecological crisis and energy dilemma. As a result, various attempts have been made to address the shortcomings in this type of WLED. To date, two common methods are red-light compensation and the red-shift of Ce3+ emission band in Y3Al5O12. Red-light compensation is generally achieved by adding a red-emission phosphor, such as Eu2+-doped materials [3], materials doped with trivalent lanthanide ions (e.g., Eu3+ and Sm3+) [4-8], Mn4+-doped materials [9-12], or Ce3+/Cr3+-co-doped Y3Al5O12 [13,14]. The red-shift of the Ce3+ emission band in Y3Al15O12 is achieved, in general, through ion substitution, such as Ca2+–Mg2+–Si4+ [15], Si4+–N3− [16,17], Mg2+–Si4+/Ge4+ [18-20], or Gd3+ [21,22].
Tb3Al5O12 has a garnet structure similar to Y3Al5O12. A series of doped Tb3Al5O12 phosphors have been synthesized, such as Tb3Al5O12:Ce3+ [23-25], Tb3Al5O12:Ce3+/Eu3+ [26], Tb3Al5O12:Eu3+ [27], and Tb3Al5O12:Ce3+/Ga3+ [28]. The results show that Tb3Al5O12 is also a good host for various ions and the luminescent properties could be tuned by co-doping different ions into the Tb3Al5O12 host. The Tb3Al5O12:Ce3+ phosphor also shows a yellow emission band. But the emission wavelength is longer than that of the Y3Al5O12:Ce3+ phosphor because Tb3+ ions produce a stronger crystal field effect [23-25]. The longer emission wavelength of Tb3Al5O12:Ce3+ is more suitable for WLEDs used as indoor illumination than that of Y3Al5O12:Ce3+. It is known that the sensitivity of human eyes to red light decreases strongly as soon as the wavelength is longer than 611 nm [9]. We aimed to shift the emission wavelength of Tb3Al5O12:Ce3+ to a longer wavelength that is, however, still shorter than 611 nm. In this work, we report the synthesis and luminescence of a series of Ce3+/Gd3+-co-doped Tb3Al5O12 phosphors. The effect of co-doping Gd3+ on the luminescence of Tb3Al5O12:Ce3+ was investigated. It is found that the co-doped Gd3+ leads to a red-shift of the Tb3Al5O12:Ce3+ emission.
Results and Discussion
The phase of the synthesized Tb2.96-xCe0.04GdxAl5O12 phosphors was confirmed by using XRD analysis. As shown in Figure 1, the diffraction peaks of Tb2.96−xCe0.04GdxAl5O12 (x = 0, 0.05, 0.10, 0.15, 0.20, and 0.25) phosphors are well in accordance with the JCPDs card no. 17-1735, meaning that Ce3+/Gd3+ ions have been doped into the Tb3Al5O12 host entirely and formed a solid solution. Moreover, the diffraction peaks shift to lower 2θ angles with increasing x values, which is induced by the substitution of Tb3+ with Ce3+/Gd3+. The ionic radii of Tb3+, Ce3+ and Gd3+ are 1.040 Å (CN = 8), 1.143 Å (CN = 8) and 1.053 Å (CN = 8), respectively. Due to the same valence and similar ionic radii of Tb3+, Ce3+, and Gd3+, Tb3+ ions are replaced by Ce3+ and Gd3+ ions in Ce3+/Gd3+ co-doped Tb3Al5O12 phosphors. The larger ionic radii of Ce3+ and Gd3+ lead to the increase of the cell volume, which induces the shifts to lower 2θ angles of the diffraction peaks.
![[2190-4286-10-123-1]](/bjnano/content/figures/2190-4286-10-123-1.png?scale=2.0&max-width=1024&background=FFFFFF)
Figure 1: XRD patterns of Tb2.96−xCe0.04GdxAl5O12 phosphors.
Figure 1: XRD patterns of Tb2.96−xCe0.04GdxAl5O12 phosphors.
The excitation spectra of Tb2.96−xCe0.04GdxAl5O12 phosphors, which show the excitation bands of Tb3+ and Ce3+ ions, is given in Figure 2. The excitation bands in the range of 250–300 nm with two excitation peaks at 275 and 286 nm correspond to the 4f8→4f75d1 inter-configurational transitions of Tb3+ [28]. The weak excitation band with a peak at 375 nm is induced by the 7F6→5D3 transition of Tb3+ [29]. Moreover, the 4f8→4f75d1 transition of Tb3+ overlaps with the 4f→5d2 transition of Ce3+, which results in the excitation band with a peak at 331 nm [22,26]. The strongest excitation band with a peak at 457 nm corresponds to the 4f→5d1 transition of Ce3+ [22]. It can be seen from Figure 2 that the excitation band corresponding to the 4f→5d1 transition of Ce3+ shifts to shorter wavelengths gradually with the increase of x, which is induced by the splitting of the Ce3+ 5d state. The increasing Gd3+ concentration leads to an intensified crystal field, which results in a stronger of splitting of the Ce3+ 5d state. As a result, the 4f→5d1 transition of Ce3+ shifts to shorter wavelengths, but the 4f→5d2 transition of Ce3+ shifts to longer wavelength. Herein, the shift of the 4f→5d2 transition of Ce3+ to longer wavelengths cannot be seen clearly because of its overlaps with the 4f8→4f75d1 transition of Tb3+.
![[2190-4286-10-123-2]](/bjnano/content/figures/2190-4286-10-123-2.png?scale=2.0&max-width=1024&background=FFFFFF)
Figure 2: Excitation spectra of Tb2.96−xCe0.04GdxAl5O12 phosphors.
Figure 2: Excitation spectra of Tb2.96−xCe0.04GdxAl5O12 phosphors.
Under excitation at 460 nm, Tb2.96−xCe0.04GdxAl5O12 phosphors show the characteristic emission band of Ce3+, as shown in Figure 3. One feature is the red-shift of the Ce3+ emission with increasing Gd3+ concentration and the other is the decrease of emission intensity with increasing Gd3+ concentration. The emission band of the Tb2.96Ce0.04Al5O12 phosphor peaks at about 554 nm. For the Tb2.71Ce0.04Gd0.25Al5O12 phosphor, the peak wavelength of the emission band shifts to 610 nm. It is well known that the emission of Ce3+ depends on the crystal field splitting. The crystal field splitting can be calculated through the following equation:
![[Graphic 1]](/bjnano/content/inline/2190-4286-10-123-i1.svg?max-width=637&scale=1.18182)
where 10Dq is the crystal field splitting parameter, Z is the anion charge, e is the electron charge, r is the radial distance of the d orbital from the nucleus, and R is the bond length [30,31]. Gd3+ has a larger ionic radius than of Tb3+. As a result, the Ce3+–O2− bond length in Tb3Al5O12:Ce3+/Gd3+ decreases when Tb3+ ions are replaced by Gd3+ ions. The decrease of the Ce3+–O2− bond length results in an increase of the crystal field splitting, which in turn leads to the red-shift of the Ce3+ emission. This result is in accordance with the excitation spectra. Moreover, the substitution of Tb3+ with Gd3+ causes lattice deformation and generates numerous structural and chemical defects, which results in a decrease of the Ce3+ emission intensity [32]. The decay characteristics of the synthesized Tb2.96−xCe0.04GdxAl5O12 phosphors were also investigated. Figure 4 gives the decay curves of Tb2.96−xCe0.04GdxAl5O12 phosphors. The decay curves of the Ce3+ emission fit well with the second-order exponential formula
![[Graphic 2]](/bjnano/content/inline/2190-4286-10-123-i2.svg?max-width=637&scale=1.18182)
where I is the emission intensity, A1 and A2 are constants, t is the time, and τ1 and τ2 are the rapid and the slow lifetime, respectively. The average lifetime (τ*) can be calculated through
![[Graphic 3]](/bjnano/content/inline/2190-4286-10-123-i3.svg?max-width=637&scale=1.18182)
The calculated τ* values for Tb2.96−xCe0.04GdxAl5O12 with x = 0, 0.05, 0.10, 0.15, 0.20, and 0.25 are 35.23, 31.46, 28.52, 26.37, 23.58 and 19.45 ns, respectively.
![[2190-4286-10-123-3]](/bjnano/content/figures/2190-4286-10-123-3.png?scale=2.0&max-width=1024&background=FFFFFF)
Figure 3: Emission spectra of Tb2.96−xCe0.04GdxAl5O12 phosphors.
Figure 3: Emission spectra of Tb2.96−xCe0.04GdxAl5O12 phosphors.
![[2190-4286-10-123-4]](/bjnano/content/figures/2190-4286-10-123-4.png?scale=2.0&max-width=1024&background=FFFFFF)
Figure 4: Decay curves of the Ce3+ emission from Tb2.96−xCe0.04GdxAl5O12 phosphors.
Figure 4: Decay curves of the Ce3+ emission from Tb2.96−xCe0.04GdxAl5O12 phosphors.
The thermal stability of a phosphor is crucial for its applications in WLEDs. Thus, the emission spectra of a typical phosphor (Tb2.81Ce0.04Gd0.15Al5O12) at different temperatures were measured and the results are shown in Figure 5. The emission intensity decreases continuously with the increasing temperature in the range of 300–540 K. As the temperature increases from 300 to 390 K, the emission intensity decreases by about 49%. Photon interaction plays an important role in thermal quenching, in which emission centres are thermally activated and the energy is released through a nonradiative transition [31]. It is known that the probability of nonradiative transitions increases with increasing temperature. As a result, the emission intensity decreases with increasing temperature because of the higher number of nonradiative transitions.
![[2190-4286-10-123-5]](/bjnano/content/figures/2190-4286-10-123-5.png?scale=2.0&max-width=1024&background=FFFFFF)
Figure 5: Emission spectra of Tb2.81Ce0.04Gd0.15Al5O12 at different temperatures.
Figure 5: Emission spectra of Tb2.81Ce0.04Gd0.15Al5O12 at different temperatures.
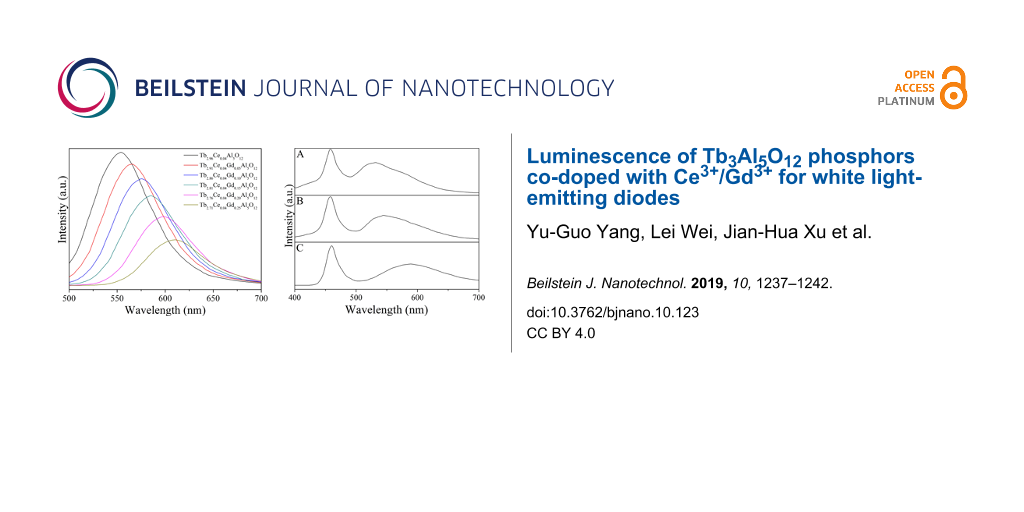
WLEDs were fabricated by combining a blue LED chip (460 nm) with Y2.96Ce0.04Al5O12, Tb2.96Ce0.04Al5O12 and Tb2.81Ce0.04Gd0.15Al5O12 phosphors. The electroluminescence spectra under an operating current of 20 mA for the fabricated WLEDs are given in Figure 6. All of spectra consist of the blue excitation band of the LED chip and the emission band of the phosphor. The emission bands of the phosphors shift from 532 nm for Y2.96Ce0.04Al5O12 (Figure 6A) through 545 nm for Tb2.96Ce0.04Al5O12 (Figure 6B) to 589 nm for Tb2.81Ce0.04Gd0.15Al5O12 (Figure 6C). The CIE chromaticity coordinates for the light from these three WLEDs are (0.325, 0.349), (0.368, 0.351), and (0.376, 0.338), respectively. The CCT values of the light from these three WLEDs are 5828, 4158, and 3767, respectively. These results suggest that Tb2.81Ce0.04Gd0.15Al5O12 is a suitable phosphor for applications in WLEDs with low CCT for indoor lighting.
![[2190-4286-10-123-6]](/bjnano/content/figures/2190-4286-10-123-6.png?scale=2.0&max-width=1024&background=FFFFFF)
Figure 6: Electroluminescence spectra of WLEDs by combining blue LED chip with Y2.96Ce0.04Al5O12 (A), Tb2.96Ce0.04Al5O12 (B) and Tb2.81Ce0.04Gd0.15Al5O12 (C) phosphors.
Figure 6: Electroluminescence spectra of WLEDs by combining blue LED chip with Y2.96Ce0.04Al5O12 (A), Tb2.96Ce...
Generally, the colour stability of a LED device can be examined through measuring the colour deviation under different driving currents [33]. Figure 7 shows the electroluminescence spectra of a WLED containing the Tb2.81Ce0.04Gd0.15Al5O12 phosphor under forward-bias currents of 5, 10, 20, 30, 40, and 50 mA. It can be seen that the intensity of the WLED increases with increasing current. Moreover, the shape and the peak of the bands corresponding to the LED chip and phosphor are consistent under different driving currents. This suggests the outstanding colour stability of the fabricated WLEDs.
![[2190-4286-10-123-7]](/bjnano/content/figures/2190-4286-10-123-7.png?scale=2.0&max-width=1024&background=FFFFFF)
Figure 7: Electroluminescence spectra of a WLED with Tb2.81Ce0.04Gd0.15Al5O12 phsphor under different forward-bias currents.
Figure 7: Electroluminescence spectra of a WLED with Tb2.81Ce0.04Gd0.15Al5O12 phsphor under different forward...
Conclusion
We synthesized a series of Tb2.96−xCe0.04GdxAl5O12 phosphors through solid-state reactions. The doping with Ce3+/Gd3+ ions does not lead to a phase change of the Tb3Al5O12 host but induces a slight increase of cell volume. Under excitation at 460 nm, the Tb2.96Ce0.04Al5O12 phosphor shows the characteristic emission band of Ce3+ with a peak wavelength of about 554 nm. The co-doped Gd3+ ions lead to a red-shift of the Ce3+ emission band and the red-shifts become larger with increasing Gd3+ concentration. Due to the larger ionic radius of Gd3+ compared with Tb3+, the substitution of Tb3+ with Gd3+ decreases the bond distance between Ce3+ and O2−, which leads to an increase of crystal field splitting. The increasing crystal field splitting induces the red-shift of the Ce3+ emission. The longer peak-wavelength of the Ce3+ emission for Gd3+ co-doped phosphors leads to a warmer light in WLEDs. The fabricated WLEDs by integrating a blue LED chip and the Ce3+/Gd3+ co-doped Tb3Al5O12 phosphors show outstanding colour stability when they are driven under different currents.
Experimental
A series of Tb2.96−xCe0.04GdxAl5O12 (x = 0, 0.05, 0.10, 0.15, 0.20, and 0.25) phosphors were synthesized through solid-state reactions in a reduction atmosphere (5% H2/95% N2). Al2O3 (99.9%), Tb4O7 (99.9%), CeO2 (99.99%) and Gd2O3 (99.95%) were used as starting materials. For the purpose of decreasing the reaction temperature, 4 wt % H3BO3 (99.5%) was added as flux. In a typical synthesis, we firstly weighted the raw materials according to stoichiometric ratios. Then, the raw materials were mixed in an agate mortar by grinding for 30 min and the mixture was calcined at 1350 °C for 5 h in an alumina crucible. Finally, the product was collected and reground after the temperature decreased to room temperature.
The X-ray diffraction (XRD) measurements were performed on a Rigaku D/max-RA X-ray diffractometer using Cu Kα radiation (λ = 1.5406 Å) with the experimental parameters of 40 kV, 30 mA and 2°/min. The measurements of excitation, emission, temperature-dependence of emission and decay curves were carried out in an Edinburgh Instrument FLS920 spectrophotometer equipped with a 450 W xenon lamp as the excitation source. The measurements were spectrally corrected. The samples were heated to a certain temperature and kept at this temperature for 5 min by using a temperature controller. The rate of temperature increase was less than 1 °C/ min and the temperature deviation was less than 0.1 °C.
Acknowledgements
This work was supported by the General Program of National Natural Science Foundation of China (51672164 and 51772172); Major Scientific and Technological Innovation Project in Shandong (2017CXGC0414 and 2018CXGC0412); Natural Science Foundation of Shandong Province (ZR2016EMM12, ZR2017MEM016, ZR2017BEM043, ZR2018BEM023 and ZR2018PEM006); Youth Foundation of Shandong Academy of Sciences (2018QN0033).
References
-
Sheu, J. K.; Chang, S. J.; Kuo, C. H.; Su, Y. K.; Wu, L. W.; Lin, Y. C.; Lai, W. C.; Tsai, J. M.; Chi, G. C.; Wu, R. K. IEEE Photonics Technol. Lett. 2003, 15, 18–20. doi:10.1109/lpt.2002.805852
Return to citation in text: [1] -
Yang, Y.; Li, J.; Liu, B.; Zhang, Y.; Lv, X.; Wei, L.; Wang, X.; Xu, J.; Yu, H.; Hu, Y.; Zhang, H.; Ma, L.; Wang, J. Chem. Phys. Lett. 2017, 685, 89–94. doi:10.1016/j.cplett.2017.07.042
Return to citation in text: [1] -
Pust, P.; Weiler, V.; Hecht, C.; Tücks, A.; Wochnik, A. S.; Henß, A.-K.; Wiechert, D.; Scheu, C.; Schmidt, P. J.; Schnick, W. Nat. Mater. 2014, 13, 891–896. doi:10.1038/nmat4012
Return to citation in text: [1] -
Xia, Z.; Chen, D. J. Am. Ceram. Soc. 2010, 93, 1397–1401. doi:10.1111/j.1551-2916.2009.03574.x
Return to citation in text: [1] -
He, Z.; Sun, X.-Y.; Teng, J.-X.; Gu, X. J. Mater. Sci.: Mater. Electron. 2018, 29, 8153–8157. doi:10.1007/s10854-018-8820-y
Return to citation in text: [1] -
Liu, B.; Yang, Y.; Wang, X. Nanosci. Nanotechnol. Lett. 2013, 5, 1298–1301. doi:10.1166/nnl.2013.1687
Return to citation in text: [1] -
Yang, Y. Mater. Sci. Eng., B 2013, 178, 807–810. doi:10.1016/j.mseb.2013.03.017
Return to citation in text: [1] -
Yang, Y.; Wang, X.; Liu, B. Nano 2014, 9, 1450008. doi:10.1142/s1793292014500088
Return to citation in text: [1] -
Du, M. H. J. Mater. Chem. C 2014, 2, 2475–2481. doi:10.1039/c4tc00031e
Return to citation in text: [1] [2] -
Li, J.; Yan, J.; Wen, D.; Khan, W. U.; Shi, J.; Wu, M.; Su, Q.; Tanner, P. A. J. Mater. Chem. C 2016, 4, 8611–8623. doi:10.1039/c6tc02695h
Return to citation in text: [1] -
Chen, D.; Zhou, Y.; Xu, W.; Zhong, J.; Ji, Z.; Xiang, W. J. Mater. Chem. C 2016, 4, 1704–1712. doi:10.1039/c5tc04133c
Return to citation in text: [1] -
Chen, Y.; Wu, K.; He, J.; Tang, Z.; Shi, J.; Xu, Y.; Liu, Z.-Q. J. Mater. Chem. C 2017, 5, 8828–8835. doi:10.1039/c7tc02514a
Return to citation in text: [1] -
Ma, R.; Ma, C.; Zhang, J.; Long, J.; Wen, Z.; Yuan, X.; Cao, Y. Opt. Mater. Express 2017, 7, 454. doi:10.1364/ome.7.000454
Return to citation in text: [1] -
Wu, Y.; Chi, Z.; He, T. J. Mater. Sci.: Mater. Electron. 2017, 28, 14591–14595. doi:10.1007/s10854-017-7323-6
Return to citation in text: [1] -
Gorbenko, V.; Zorenko, T.; Witkiewicz, S.; Paprocki, K.; Iskaliyeva, A.; Kaczmarek, A. M.; Van Deun, R.; Khaidukov, M. N.; Batentschuk, M.; Zorenko, Y. J. Lumin. 2018, 199, 245–250. doi:10.1016/j.jlumin.2018.03.058
Return to citation in text: [1] -
Setlur, A. A.; Heward, W. J.; Hannah, M. E.; Happek, U. Chem. Mater. 2008, 20, 6277–6283. doi:10.1021/cm801732d
Return to citation in text: [1] -
Zhong, J.; Zhao, W.; Zhuang, W.; Du, F.; Zhou, Y.; Yu, Y.; Wang, L. J. Alloys Compd. 2017, 726, 658–663. doi:10.1016/j.jallcom.2017.08.023
Return to citation in text: [1] -
Maniquiz, M. C.; Jung, K. Y. ECS Trans. 2010, 28 (3), 175–182. doi:10.1149/1.3367224
Return to citation in text: [1] -
Shang, M.; Fan, J.; Lian, H.; Zhang, Y.; Geng, D.; Lin, J. Inorg. Chem. 2014, 53, 7748–7755. doi:10.1021/ic501063j
Return to citation in text: [1] -
Jiang, L.; Zhang, X.; Tang, H.; Zhu, S.; Li, Q.; Zhang, W.; Mi, X.; Lu, L.; Liu, X. Mater. Res. Bull. 2018, 98, 180–186. doi:10.1016/j.materresbull.2017.10.019
Return to citation in text: [1] -
Shen, C.; Zhong, C.; Ming, J. J. Exp. Nanosci. 2013, 8, 54–60. doi:10.1080/17458080.2011.559589
Return to citation in text: [1] -
Chen, L.; Chen, X.; Liu, F.; Chen, H.; Wang, H.; Zhao, E.; Jiang, Y.; Chan, T.-S.; Wang, C.-H.; Zhang, W.; Wang, Y.; Chen, S. Sci. Rep. 2015, 5, 11514. doi:10.1038/srep11514
Return to citation in text: [1] [2] [3] -
Meng, Q.; Liu, Y.; Fu, Y.; Zu, Y.; Zhou, Z. J. Mol. Struct. 2018, 1151, 112–116. doi:10.1016/j.molstruc.2017.09.037
Return to citation in text: [1] [2] -
Onishi, Y.; Nakamura, T.; Adachi, S. J. Lumin. 2017, 192, 720–727. doi:10.1016/j.jlumin.2017.07.056
Return to citation in text: [1] [2] -
Choi, T. Y.; Song, Y. H.; Lee, H. R.; Senthil, K.; Masaki, T.; Yoon, D. H. Mater. Sci. Eng., B 2012, 177, 500–503. doi:10.1016/j.mseb.2011.10.005
Return to citation in text: [1] [2] -
Nazarov, M.; Noh, D. Y.; Sohn, J.; Yoon, C. Opt. Mater. 2008, 30, 1387–1392. doi:10.1016/j.optmat.2007.07.005
Return to citation in text: [1] [2] -
Onishi, Y.; Nakamura, T.; Sone, H.; Adachi, S. J. Lumin. 2018, 197, 242–247. doi:10.1016/j.jlumin.2018.01.043
Return to citation in text: [1] -
Bi, J.; Wang, X.; Molokeev, M. S.; Zhu, Q.; Li, X.; Chen, J.; Sun, X.; Kim, B.-N.; Li, J.-G. Ceram. Int. 2018, 44, 8684–8690. doi:10.1016/j.ceramint.2018.02.104
Return to citation in text: [1] [2] -
Zorenko, Y.; Gorbenko, V.; Voznyak, T.; Zorenko, T.; Kuklinski, B.; Turos-Matysyak, R.; Grinberg, M. Opt. Spectrosc. 2009, 106, 365–374. doi:10.1134/s0030400x09030102
Return to citation in text: [1] -
Robertson, J. M.; Tol, M. W. V.; Smits, W. H.; Heynen, J. P. H. Philips J. Res. 1981, 36, 15–30.
Return to citation in text: [1] -
Zhang, H.; Chen, Y.; Zhu, X.; Zhou, H.; Yao, Y.; Li, X. J. Lumin. 2019, 207, 477–481. doi:10.1016/j.jlumin.2018.11.057
Return to citation in text: [1] [2] -
He, X.; Liu, X.; You, C.; Zhang, Y.; Li, R.; Yu, R. J. Mater. Chem. C 2016, 4, 10691–10700. doi:10.1039/c6tc02763f
Return to citation in text: [1] -
Zhong, J.; Chen, D.; Zhou, Y.; Wan, Z.; Ding, M.; Bai, W.; Ji, Z. Dalton Trans. 2016, 45, 4762–4770. doi:10.1039/c5dt04909a
Return to citation in text: [1]
| 22. | Chen, L.; Chen, X.; Liu, F.; Chen, H.; Wang, H.; Zhao, E.; Jiang, Y.; Chan, T.-S.; Wang, C.-H.; Zhang, W.; Wang, Y.; Chen, S. Sci. Rep. 2015, 5, 11514. doi:10.1038/srep11514 |
| 29. | Zorenko, Y.; Gorbenko, V.; Voznyak, T.; Zorenko, T.; Kuklinski, B.; Turos-Matysyak, R.; Grinberg, M. Opt. Spectrosc. 2009, 106, 365–374. doi:10.1134/s0030400x09030102 |
| 22. | Chen, L.; Chen, X.; Liu, F.; Chen, H.; Wang, H.; Zhao, E.; Jiang, Y.; Chan, T.-S.; Wang, C.-H.; Zhang, W.; Wang, Y.; Chen, S. Sci. Rep. 2015, 5, 11514. doi:10.1038/srep11514 |
| 26. | Nazarov, M.; Noh, D. Y.; Sohn, J.; Yoon, C. Opt. Mater. 2008, 30, 1387–1392. doi:10.1016/j.optmat.2007.07.005 |
| 1. | Sheu, J. K.; Chang, S. J.; Kuo, C. H.; Su, Y. K.; Wu, L. W.; Lin, Y. C.; Lai, W. C.; Tsai, J. M.; Chi, G. C.; Wu, R. K. IEEE Photonics Technol. Lett. 2003, 15, 18–20. doi:10.1109/lpt.2002.805852 |
| 2. | Yang, Y.; Li, J.; Liu, B.; Zhang, Y.; Lv, X.; Wei, L.; Wang, X.; Xu, J.; Yu, H.; Hu, Y.; Zhang, H.; Ma, L.; Wang, J. Chem. Phys. Lett. 2017, 685, 89–94. doi:10.1016/j.cplett.2017.07.042 |
| 13. | Ma, R.; Ma, C.; Zhang, J.; Long, J.; Wen, Z.; Yuan, X.; Cao, Y. Opt. Mater. Express 2017, 7, 454. doi:10.1364/ome.7.000454 |
| 14. | Wu, Y.; Chi, Z.; He, T. J. Mater. Sci.: Mater. Electron. 2017, 28, 14591–14595. doi:10.1007/s10854-017-7323-6 |
| 9. | Du, M. H. J. Mater. Chem. C 2014, 2, 2475–2481. doi:10.1039/c4tc00031e |
| 10. | Li, J.; Yan, J.; Wen, D.; Khan, W. U.; Shi, J.; Wu, M.; Su, Q.; Tanner, P. A. J. Mater. Chem. C 2016, 4, 8611–8623. doi:10.1039/c6tc02695h |
| 11. | Chen, D.; Zhou, Y.; Xu, W.; Zhong, J.; Ji, Z.; Xiang, W. J. Mater. Chem. C 2016, 4, 1704–1712. doi:10.1039/c5tc04133c |
| 12. | Chen, Y.; Wu, K.; He, J.; Tang, Z.; Shi, J.; Xu, Y.; Liu, Z.-Q. J. Mater. Chem. C 2017, 5, 8828–8835. doi:10.1039/c7tc02514a |
| 28. | Bi, J.; Wang, X.; Molokeev, M. S.; Zhu, Q.; Li, X.; Chen, J.; Sun, X.; Kim, B.-N.; Li, J.-G. Ceram. Int. 2018, 44, 8684–8690. doi:10.1016/j.ceramint.2018.02.104 |
| 4. | Xia, Z.; Chen, D. J. Am. Ceram. Soc. 2010, 93, 1397–1401. doi:10.1111/j.1551-2916.2009.03574.x |
| 5. | He, Z.; Sun, X.-Y.; Teng, J.-X.; Gu, X. J. Mater. Sci.: Mater. Electron. 2018, 29, 8153–8157. doi:10.1007/s10854-018-8820-y |
| 6. | Liu, B.; Yang, Y.; Wang, X. Nanosci. Nanotechnol. Lett. 2013, 5, 1298–1301. doi:10.1166/nnl.2013.1687 |
| 7. | Yang, Y. Mater. Sci. Eng., B 2013, 178, 807–810. doi:10.1016/j.mseb.2013.03.017 |
| 8. | Yang, Y.; Wang, X.; Liu, B. Nano 2014, 9, 1450008. doi:10.1142/s1793292014500088 |
| 28. | Bi, J.; Wang, X.; Molokeev, M. S.; Zhu, Q.; Li, X.; Chen, J.; Sun, X.; Kim, B.-N.; Li, J.-G. Ceram. Int. 2018, 44, 8684–8690. doi:10.1016/j.ceramint.2018.02.104 |
| 3. | Pust, P.; Weiler, V.; Hecht, C.; Tücks, A.; Wochnik, A. S.; Henß, A.-K.; Wiechert, D.; Scheu, C.; Schmidt, P. J.; Schnick, W. Nat. Mater. 2014, 13, 891–896. doi:10.1038/nmat4012 |
| 23. | Meng, Q.; Liu, Y.; Fu, Y.; Zu, Y.; Zhou, Z. J. Mol. Struct. 2018, 1151, 112–116. doi:10.1016/j.molstruc.2017.09.037 |
| 24. | Onishi, Y.; Nakamura, T.; Adachi, S. J. Lumin. 2017, 192, 720–727. doi:10.1016/j.jlumin.2017.07.056 |
| 25. | Choi, T. Y.; Song, Y. H.; Lee, H. R.; Senthil, K.; Masaki, T.; Yoon, D. H. Mater. Sci. Eng., B 2012, 177, 500–503. doi:10.1016/j.mseb.2011.10.005 |
| 21. | Shen, C.; Zhong, C.; Ming, J. J. Exp. Nanosci. 2013, 8, 54–60. doi:10.1080/17458080.2011.559589 |
| 22. | Chen, L.; Chen, X.; Liu, F.; Chen, H.; Wang, H.; Zhao, E.; Jiang, Y.; Chan, T.-S.; Wang, C.-H.; Zhang, W.; Wang, Y.; Chen, S. Sci. Rep. 2015, 5, 11514. doi:10.1038/srep11514 |
| 26. | Nazarov, M.; Noh, D. Y.; Sohn, J.; Yoon, C. Opt. Mater. 2008, 30, 1387–1392. doi:10.1016/j.optmat.2007.07.005 |
| 31. | Zhang, H.; Chen, Y.; Zhu, X.; Zhou, H.; Yao, Y.; Li, X. J. Lumin. 2019, 207, 477–481. doi:10.1016/j.jlumin.2018.11.057 |
| 18. | Maniquiz, M. C.; Jung, K. Y. ECS Trans. 2010, 28 (3), 175–182. doi:10.1149/1.3367224 |
| 19. | Shang, M.; Fan, J.; Lian, H.; Zhang, Y.; Geng, D.; Lin, J. Inorg. Chem. 2014, 53, 7748–7755. doi:10.1021/ic501063j |
| 20. | Jiang, L.; Zhang, X.; Tang, H.; Zhu, S.; Li, Q.; Zhang, W.; Mi, X.; Lu, L.; Liu, X. Mater. Res. Bull. 2018, 98, 180–186. doi:10.1016/j.materresbull.2017.10.019 |
| 27. | Onishi, Y.; Nakamura, T.; Sone, H.; Adachi, S. J. Lumin. 2018, 197, 242–247. doi:10.1016/j.jlumin.2018.01.043 |
| 33. | Zhong, J.; Chen, D.; Zhou, Y.; Wan, Z.; Ding, M.; Bai, W.; Ji, Z. Dalton Trans. 2016, 45, 4762–4770. doi:10.1039/c5dt04909a |
| 16. | Setlur, A. A.; Heward, W. J.; Hannah, M. E.; Happek, U. Chem. Mater. 2008, 20, 6277–6283. doi:10.1021/cm801732d |
| 17. | Zhong, J.; Zhao, W.; Zhuang, W.; Du, F.; Zhou, Y.; Yu, Y.; Wang, L. J. Alloys Compd. 2017, 726, 658–663. doi:10.1016/j.jallcom.2017.08.023 |
| 30. | Robertson, J. M.; Tol, M. W. V.; Smits, W. H.; Heynen, J. P. H. Philips J. Res. 1981, 36, 15–30. |
| 31. | Zhang, H.; Chen, Y.; Zhu, X.; Zhou, H.; Yao, Y.; Li, X. J. Lumin. 2019, 207, 477–481. doi:10.1016/j.jlumin.2018.11.057 |
| 15. | Gorbenko, V.; Zorenko, T.; Witkiewicz, S.; Paprocki, K.; Iskaliyeva, A.; Kaczmarek, A. M.; Van Deun, R.; Khaidukov, M. N.; Batentschuk, M.; Zorenko, Y. J. Lumin. 2018, 199, 245–250. doi:10.1016/j.jlumin.2018.03.058 |
| 23. | Meng, Q.; Liu, Y.; Fu, Y.; Zu, Y.; Zhou, Z. J. Mol. Struct. 2018, 1151, 112–116. doi:10.1016/j.molstruc.2017.09.037 |
| 24. | Onishi, Y.; Nakamura, T.; Adachi, S. J. Lumin. 2017, 192, 720–727. doi:10.1016/j.jlumin.2017.07.056 |
| 25. | Choi, T. Y.; Song, Y. H.; Lee, H. R.; Senthil, K.; Masaki, T.; Yoon, D. H. Mater. Sci. Eng., B 2012, 177, 500–503. doi:10.1016/j.mseb.2011.10.005 |
| 32. | He, X.; Liu, X.; You, C.; Zhang, Y.; Li, R.; Yu, R. J. Mater. Chem. C 2016, 4, 10691–10700. doi:10.1039/c6tc02763f |
© 2019 Yang et al.; licensee Beilstein-Institut.
This is an Open Access article under the terms of the Creative Commons Attribution License (http://creativecommons.org/licenses/by/4.0). Please note that the reuse, redistribution and reproduction in particular requires that the authors and source are credited.
The license is subject to the Beilstein Journal of Nanotechnology terms and conditions: (https://www.beilstein-journals.org/bjnano)