Abstract
In this work, a metal–organic framework (MOF), namely MFU-4, which is comprised of zinc cations and benzotriazolate ligands, was used to entrap SF6 gas molecules inside its pores, and thus a new scheme for long-term leakproof storage of dangerous gasses is demonstrated. The SF6 gas was introduced into the pores at an elevated gas pressure and temperature. Upon cooling down and release of the gas pressure, we discovered that the gas was well-trapped inside the pores and did not leak out – not even after two months of exposure to air at room temperature. The material was thoroughly analyzed before and after the loading as well as after given periods of time (1, 3, 7, 14 or 60 days) after the loading. The studies included powder X-ray diffraction measurements, thermogravimetric analysis, Fourier-transform infrared spectroscopy, scanning electron microscopy, 19F nuclear magnetic resonance spectroscopy and computational simulations. In addition, the possibility to release the gas guest by applying elevated temperature, vacuum and acid-induced framework decomposition was also investigated. The controlled gas release using elevated temperature has the additional benefit that the host MOF can be reused for further gas capture cycles.
Introduction
Metal–organic frameworks (MOFs) are coordination polymers with organic ligands containing (potential) voids [1]. Their porosity and high surface area make them attractive materials for adsorption-based applications [2-5]. MOFs have been suggested as promising materials for gas storage of attractive fuel gases such as hydrogen [6-8] or methane [9-11]. In these applications the gas is adsorbed inside the pores. To enhance the guest adsorption in MOFs, several different approaches have been introduced over the last few years. These include tuning the pore properties, such as polarity, or introducing open metal sides for a better interaction between the guest and host material [5,7,11]. Recently, we reported on an alternative approach which dealt with kinetic trapping of gas molecules in MOFs [12]. This approach is based on using MOFs with ultranarrow pore apertures. Under elevated pressure and temperature, the gas molecules enter the pores, but they are not released immediately when normal conditions are re-established. This is due to the activation energy barrier for gas diffusion of the entrapped sorbate within the pores connected via ultranarrow pore apertures.
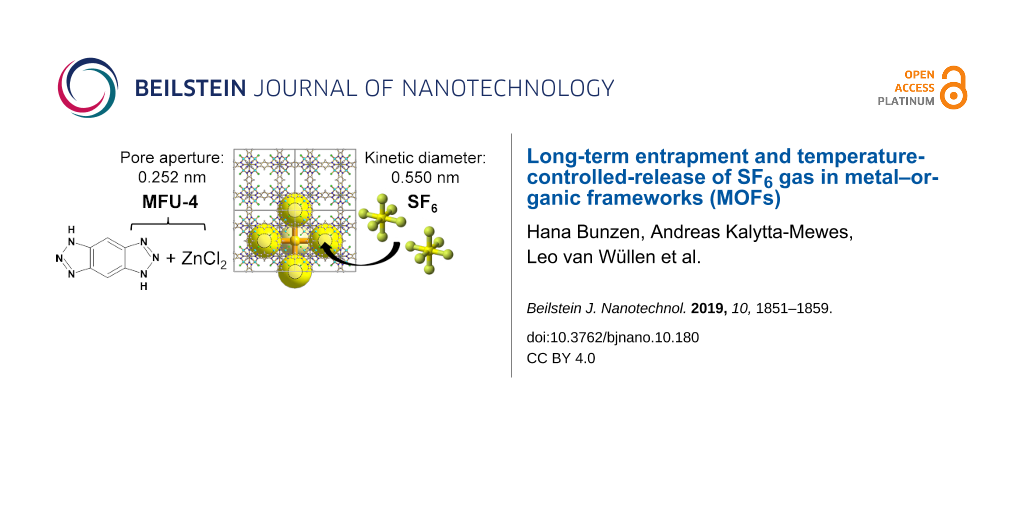
As a proof-of-principle study, we used a MOF called MFU-4 (where MFU-4 stands for Metal−Organic Framework Ulm University-4) to trap xenon gas inside the pores [12]. MFU-4 is comprised of zinc cations and benzotriazolate ions (Scheme 1) [13]. It crystallizes in the cubic crystal system and contains two types of cavities with diameters of 3.88 and 11.94 Å, which are connected by narrow (only 2.52 Å) pore apertures. This made the MOF a promising candidate for kinetic trapping of gases. In our recent work we were able to show that it was possible to trap over 40 wt % of xenon (kinetic diameter: 3.96 Å) [14] inside the pores despite its diameter being larger than the pore aperture [12]. Upon exposure of the sample to air under normal conditions, we observed that the gas was slowly released. For instance, after three days approximately 20% of the guest gas was released and after one month more than 67% was lost. Keeping these results in mind we were curious if it was possible to permanently trap (i.e., imprison) gas inside the MOF without observing any leaking at normal conditions, thus enabling the use of MOFs as a gas storage container for dangerous gases.
![[2190-4286-10-180-i1]](/bjnano/content/inline/2190-4286-10-180-i1.png?scale=2.8&max-width=1024&background=FFFFFF)
In this work we selected sulfur hexafluoride (kinetic diameter: 5.50 Å) [14] as a guest, which has a much larger kinetic diameter than the previously reported entrapment of xenon gas (kinetic diameter: 3.96 Å) [14]. Additionally, its presence inside the pores can be easily followed by Fourier-transform infrared (FTIR) and 19F nuclear magnetic resonance (NMR) spectroscopy. SF6 is an inert, nonflammable and nontoxic gas, which is known to be an excellent dielectric gas for high-voltage applications [15,16]. At the same time, it is also known as one of the most severe greenhouse gases [17,18]. Therefore, there is currently much interest in finding effective materials to allow its capture that provide safe storage as well as re-use. Various porous materials have been tested for this purpose including carbons [19,20], zeolites [21-23], MOFs [24-27] and porous organic cages [28,29]. Herein we present a study applying the approach of kinetic trapping of gases in MOFs and characterize the loading of SF6 into MFU-4 and its release from the MOF at normal conditions over a period of two months.
Results and Discussion
Materials synthesis
The MOF MFU-4 (Scheme 1) was synthetized according to the procedure reported previously [12]. By carrying out the reported microwave-assisted synthesis, ≈2–10 µm cubic crystals were obtained (Figure S1 in Supporting Information File 1). Prior to guest loading, the sample was kept under vacuum at 320 °C overnight to make sure that there were no solvent molecules left in the pores, thus ensuring that the whole pore volume was available for trapping the SF6 guest. The bulk sample was analyzed before and after the gas loading by conventional analytical methods, including FTIR, powder X-ray diffraction (XRD) and thermogravimetric analysis (TGA).
SF6-loading experiments
The SF6-loading was carried out at elevated pressure and temperature. To incorporate the highest amount of the guest molecules inside the pores, we tested various loading conditions. We used a pressure of 20 bar and varied the loading temperature and time. From all tested conditions (Table 1), the highest loading was achieved after 18 hours at 250 °C (sample 3). Prolonging the loading time did not lead to a higher loading. Therefore, sample 3 was used in the following studies.
Table 1: SF6-loading into MFU-4 under various conditions.
| Sample | SF6 pressure (bar) | Temp. (°C) | Time (h) | SF6 loaded (wt %)a | Calc. no. of SF6 molecules per unit cell/void of MFU-4b |
|---|---|---|---|---|---|
| 1 | 20 | 150 | 18 | 2.16 | 1.14 / 0.29 |
| 2 | 20 | 200 | 18 | 2.37 | 1.25 / 0.31 |
| 3a | 20 | 250 | 18 | 3.09 | 1.65 / 0.41 |
| 3b | 20 | 250 | 18 | 3.07 | 1.63 / 0.41 |
| 3c | 20 | 250 | 18 | 3.13 | 1.67 / 0.42 |
| 4 | 20 | 250 | 48 | 3.04 | 1.62 / 0.40 |
aMass loss in the temperature range from 150 to 390 °C determined from TGA data (see Supporting Information File 1, Figure S2). bAssuming all SF6 molecules are located in the larger void (with four larger voids per unit cell of MFU-4).
To estimate the amount of the guest loaded into the MOF, we used TGA (Figure 1 and Figure S2 in Supporting Information File 1). The analysis revealed a gradual mass loss between 150–500 °C. When heated above 500 °C, a second mass loss was observed which corresponded to the framework decomposition. By utilizing mass spectrometry, we analyzed the gaseous products that were released during sample heating. We recorded that SF6 was gradually released from 150 to 390 °C (Figure S3 in Supporting Information File 1). Therefore, this temperature range was used to quantify the amount of loaded SF6 from the TGA data (Table 1).
![[2190-4286-10-180-1]](/bjnano/content/figures/2190-4286-10-180-1.png?scale=2.0&max-width=1024&background=FFFFFF)
Figure 1: Thermogravimetric analysis of MFU-4 before (black) and after (Sample 3a, blue) the loading of SF6 measured under a nitrogen atmosphere at a heating rate of 10 K min−1.
Figure 1: Thermogravimetric analysis of MFU-4 before (black) and after (Sample 3a, blue) the loading of SF6 m...
The activation energy for the guest release was estimated by temperature-modulated TGA to be as high as approximately +135 kJ·mol−1 (Figure S4 in Supporting Information File 1). Modulated TGA (MTGATM by TA instruments) is an analytical technique used for obtaining continuous kinetic information for decomposition and volatilization reactions. The method makes use of an oscillation temperature program to obtain kinetic parameters during a mass loss [30,31]. Until now it has been mainly used to study organic polymers (e.g., poly(ethylene) and poly(styrene)) and simple inorganic compounds (e.g., calcium carbonate and calcium oxalate) [31]. Here we used the method to estimate the activation energy of a guest released from a porous material. The determined value of the activation energy was further compared to the results obtained from computational simulations (see the dedicated section later in the text).
To qualify the guest, we used FTIR spectroscopy (Figure 2 and Figure S5 in Supporting Information File 1). The FTIR spectrum revealed, beside the bands originating from MFU-4, three additional bands at 610.8, 935.4 and 991.6 cm−1. These bands can be assigned to the v4 (liquid: 610.8 cm−1; gas: 614.5 cm−1), v3 (liquid: 914.9 cm−1; gas: 948.0 cm−1) and v2 + v6 (liquid: ≈990 cm−1; gas: 984.2 cm−1) vibrational modes in SF6 [32].
![[2190-4286-10-180-2]](/bjnano/content/figures/2190-4286-10-180-2.png?scale=2.0&max-width=1024&background=FFFFFF)
Figure 2: FTIR spectra of MFU-4 before (black) and after (Sample 3a, blue) the loading of SF6. Bands attributed to SF6 are marked with an asterisk.
Figure 2: FTIR spectra of MFU-4 before (black) and after (Sample 3a, blue) the loading of SF6. Bands attribut...
To check that the sample crystallinity was preserved, we measured powder XRD patterns before and after the loading (Figure 3). The recorded powder XRD patterns did not reveal any changes in the diffraction peak positions, but there were differences in the peak intensities. Similar variations in the peak intensities of MOF samples have been previously described and assigned to the presence of solvent molecules inside the pores [33]. Therefore, here the changes in intensities can be seen as a sign of SF6 molecules being successfully included into the pores. Last but not least, scanning electron microscopy (SEM) images of the sample (taken before and after the guest loading) did not reveal any detectable changes in the crystal surface and morphology, confirming that the MOF crystals remained intact during the loading (Supporting Information File 1, Figure S1).
![[2190-4286-10-180-3]](/bjnano/content/figures/2190-4286-10-180-3.png?scale=2.0&max-width=1024&background=FFFFFF)
Figure 3: Powder X-ray diffraction analysis of MFU-4 before (black) and after (Sample 3a, blue) the loading of SF6.
Figure 3: Powder X-ray diffraction analysis of MFU-4 before (black) and after (Sample 3a, blue) the loading o...
The presence of SF6 could be further confirmed by NMR measurements. The 19F MAS NMR spectrum, obtained at a MAS frequency of 8 kHz, revealed one singlet signal at 52.7 ppm, which can be assigned to the 19F nuclei of the SF6 guest (Figure 4). The line position is approximately 5 ppm upfield from the resonance of gaseous SF6 (57.42 ppm) [34]. Additionally, small signals (marked by asterisks in Figure 4) to the left and right side of the main singlet represent spinning sidebands, which illustrates that the SF6 molecule is not completely freely rotating and that there is an interaction with the MOF host lattice.
![[2190-4286-10-180-4]](/bjnano/content/figures/2190-4286-10-180-4.png?scale=2.0&max-width=1024&background=FFFFFF)
Figure 4: 19F MAS NMR spectrum of MFU-4 (Sample 3b) loaded with SF6 recorded at room temperature. The spectrum was referenced against CFCl3.
Figure 4: 19F MAS NMR spectrum of MFU-4 (Sample 3b) loaded with SF6 recorded at room temperature. The spectru...
Computational simulations
Theoretical calculations were performed in order to determine the activation energy parameters from atomistic simulation data. Briefly, the approach previously described for scanning the minimum energy path of xenon atoms crossing the small pore in MFU-4 [13] was adapted and further refined in order to account for the multiatomic nature of the diffusant, i.e., SF6. The linear transition path of SF6 passing through a single unit cell of MFU-4 is shown in Figure 5a, which shows the start and end position of a SF6 molecule, serving as a probe for scanning the potential energy of the system along the displayed path. To obtain a rough estimate for the energy changes along the path, molecular mechanics calculations were performed, employing the universal force field (UFF) [35] parameters as included in the GULP code [36]. In order to prevent an origin shift of the framework during transition path sampling, the fractional atom coordinates of four framework hydrogen atoms were fixed. In addition, the geometry of the linear F–S–F group (as part of SF6) parallel to the transition path was restrained to the UFF equilibrium bond distance values. During transition path sampling all unit cell parameters were held constant. All other atom positions were allowed to relax freely during the simulation. An example input file is provided as part of the Supporting Information File 1.
![[2190-4286-10-180-5]](/bjnano/content/figures/2190-4286-10-180-5.jpg?scale=2.0&max-width=1024&background=FFFFFF)
Figure 5: (a) MFU-4 unit cell showing the linear transition scan path for SF6 crossing a single small pore. (b) Black curve and filled circles: differences of UFF total energy values of 200 configurations of SF6@MFU-4 scanned along the linear path displayed in (a). Open circles: differences of DFT total energy values for selected configurations and different dispersion correction methods (for explanations see text).
Figure 5: (a) MFU-4 unit cell showing the linear transition scan path for SF6 crossing a single small pore. (...
The change of the total energy of all 200 configurations sampled during the linear transition of SF6 through the unit cell of MFU-4 is shown as the black curve in Figure 5b. The potential energy curve is symmetric, showing two pronounced energy maxima at the transition path scan coordinates c/80 (marked by “TS”) and c/120, respectively. At these coordinates the SF6 molecule experiences the highest repulsive interaction energy, thus leading to a strong geometric distortion of the small pores of MFU-4. The energy minima are located at c/47 (marked by “min”) and c/152; According to force field calculations, another (local) energy minimum is found in the middle of the pore (c/100, “centre”), which is surprising in light of the close-packed arrangement of coordinated chloride ligands in the framework structure. According to the potential energy curve, an activation energy of approximately +218 kJ·mol−1 can be estimated, which is significantly higher than the experimental value of +135 kJ·mol−1, as gleaned from the temperature-modulated thermogravimetric analysis.
In order to obtain more realistic energy values, constrained geometry plane wave DFT+D calculations were performed for four different configurations (“min”, “TS”, “centre” and “start/end”) as marked in Figure 5a. For this, the starting configurations were extracted from the previous force field scan trajectory and all atomic positions were allowed to relax during subsequent optimization steps, except for the position of the sulfur atom of SF6, which was fixed at the corresponding c/N coordinate of the transition path. The PW-DFT+D calculations were performed with the CASTEP code [37] employing the PBE functional [38] and on-the-fly generated ultrasoft pseudopotentials (energy cutoff: 570 eV). Two different correction methods were included in all DFT calculations in order to account for dispersion interactions. The total energy values of these are shown in Figure 5b as blue (TS dispersion correction [39]) and red circles (MBD* dispersion correction [40]). The latter dispersion correction scheme leads to an approximate DFT-calculated activation energy of +156 kJ·mol−1, which is in good agreement with the experimentally determined value, taking into account the fact that all calculated values formally correspond to a temperature of zero Kelvin. In the future, metadynamic MD simulation studies might be performed, which should take into account both the effects of different gas loading conditions as well as temperature-dependent lattice vibrations and distortions. For this purpose, a well-parametrized force field for the MFU-4 host lattice and the diffusant will have to be developed.
SF6-release experiments
The SF6-loaded MFU-4 sample was stored in air at room temperature. After a certain period (0, 1, 3, 7, 14 and 60 days) the sample was analyzed by TGA (to quantify the amount of the guest in MFU-4, Figure 6), powder XRD measurements (Figure S6 in Supporting Information File 1) and FTIR spectroscopy (Figure 7 and Figure S7 in Supporting Information File 1). Based on the results of these measurements, it can be concluded that there was no leaking of the guest. Both TGA (Figure 6 and Table 2) and FTIR spectroscopy (Figure 7, and Figure S8 and Table S1 in Supporting Information File 1) showed that SF6 remained inside the pores over the entire investigated period. The analyses also revealed that upon exposure of the sample to air, a small amount of water was adsorbed onto the surface of the MFU-4 crystals.
![[2190-4286-10-180-6]](/bjnano/content/figures/2190-4286-10-180-6.png?scale=2.0&max-width=1024&background=FFFFFF)
Figure 6: Thermogravimetric analysis of MFU-4 loaded with SF6 (Sample 3a) after 0, 1, 3, 7, 14, and 60 days measured under a nitrogen atmosphere at a heating rate of 10 K min−1.
Figure 6: Thermogravimetric analysis of MFU-4 loaded with SF6 (Sample 3a) after 0, 1, 3, 7, 14, and 60 days m...
![[2190-4286-10-180-7]](/bjnano/content/figures/2190-4286-10-180-7.png?scale=2.0&max-width=1024&background=FFFFFF)
Figure 7: FTIR spectra of MFU-4 loaded with SF6 (Sample 3a) after 0, 1, 3, 7, 14, and 60 days. Bands attributed to SF6 are marked with dotted vertical lines.
Figure 7: FTIR spectra of MFU-4 loaded with SF6 (Sample 3a) after 0, 1, 3, 7, 14, and 60 days. Bands attribut...
Table 2: SF6 release from MFU-4 (Sample 3a) stored in air at room temperature for 0–60 days as evaluated by thermogravimetric analysis (Figure 6).
| Time (days) | H2O adsorbed (wt %)a (25–150 °C) | SF6 loaded (wt %)a (150–390 °C) | Calc. no. of SF6 molecules per unit cell/void of MFU-4b |
|---|---|---|---|
| 0 | 0.53 | 3.09 | 1.65 / 0.41 |
| 1 | 0.67 | 3.08 | 1.64 / 0.41 |
| 3 | 0.75 | 3.03 | 1.61 / 0.40 |
| 7 | 0.91 | 3.10 | 1.65 / 0.41 |
| 14 | 0.95 | 3.00 | 1.60 / 0.40 |
| 60 | 1.22 | 3.29 | 1.76 / 0.44 |
aDetermined by TGA (Figure 6). bAssuming all SF6 molecules are located in the larger void (with four larger voids per unit cell of MFU-4).
As indicated by the results of the thermogravimetric analysis (Figure 1), if needed, the guest gas can be released in a controlled manner by heating the sample without decomposing the framework. This was proven by a variable temperature powder XRD measurement (Figure S9 in Supporting Information File 1), which confirmed that MFU-4 was stable up to 500 °C. This temperature is higher than that needed for the SF6 release, enabling the host material to be reused for further guest storage. To show that SF6 can be released without its decomposition, a study of temperature-induced gas release followed by mass spectrometry was carried out. In this measurement only signals corresponding to the SF6 fragments (such as SF5· and SF4·) [41] and no signals of its thermal decomposition products [42] could be detected, confirming that the gas release from the host material was possible (for details see Figure S3 in Supporting Information File 1).
In another experiment, we examined if it was possible to release the gas guest at room temperature by applying vacuum. We kept a sample of MFU-4 loaded with SF6 (Sample 3c) under vacuum at 25 °C for a certain period of time and then analyzed it by FTIR and TGA (Figure S10 and S11 in Supporting Information File 1). Even after 24 h of applying high vacuum (p = 2.8 × 10⁻⁷ mbar), we could still detect a substantial amount of SF6 which corresponded to approximately 90% of the originally loaded amount (determined by TGA; see Figure S11 in Supporting Information File 1). Furthermore, we studied the possibility to release SF6 from the pores of MFU-4 by decomposing the framework. To do so, we treated a sample of the MOF loaded with SF6 with an acid, namely concentrated sulfuric acid, and analyzed the gas phase by mass spectrometry (Figure S12 in Supporting Information File 1). As expected, upon adding the acid to the reaction vessel, the framework decomposed and an immediate evolution of gas bubbles was observed. The SF6 release could be followed by mass spectrometry; however, a precise quantification was not possible with the experimental set-up used. SF6 is a heavy gas (MW: 146.06 g·mol−1), and thus some of the gas remained in the bottom of the reaction vessel and possibly also dispersed as bubbles in the viscous reaction solution.
Conclusion
In this study we were able to show that it was possible to trap SF6 gas in a MOF and that the gas guest remained inside the MOF upon exposing the sample at room temperature to air. Even after two months we did not observe any measurable leaking of the guest gas from the host. Furthermore, even under high-vacuum conditions, most (90%) of the gas remained entrapped in the pores. This finding could lead to a new gas storage method for dangerous gasses. We also showed that it was possible to release the gas guest in a controlled manner by applying elevated temperature or by decomposing the material by acid digestion. For gas release by elevated temperature, the host MOF can be recycled for further gas-capture cycles. In the future we plan to study the influence of the material crystal size on the loading capacity and focus on engineering structural properties of MFU-4 in order to prepare its analogues with different pore aperture sizes. We believe that such materials could find potential application in gas storage and separation.
Experimental
Benzobistriazole was synthetized according to the previously reported procedure [43]. Anhydrous ZnCl2 and DMF were of analytical grade and used as-received from commercial suppliers. SF6 (≥99.995+%) was also used as-received from a commercial supplier (Linde). FTIR spectra were recorded in the range of 400–4000 cm−1 on a Bruker Equinox 55 FTIR spectrometer equipped with an ATR unit. Thermogravimetric analysis (TGA) was measured on a TA Instruments Q500 device over a temperature range of 25–600 °C under a nitrogen atmosphere at a heating rate of 10 K min−1. Temperature-modulated TGA was measured on a TA Instruments Q500 device in the temperature range of 25–550 °C under helium atmosphere at a heating rate of 1.5 K min−1, amplitude of ±5 °C and period of 200 s. The temperature-induced gas release was followed by a BelCat-B catalyst analyzer (Bel Japan, Inc.) coupled with a mass spectrometer (OmniStar GSD 320, Pfeiffer Vacuum). The sample was placed between two plugs of quartz wool in a quartz glass reactor and heated up to 500 °C (10 K·min−1) under a flow of helium (30 mL·min−1). The composition of the exhaust gas was analyzed by a mass spectrometer. The acid-induced gas release was carried out in a round-bottom flask purged with a flow of argon (100 mL·min−1) and connected to a BelCat-B catalyst analyzer (Bel Japan, Inc.) attached to a mass spectrometer (OmniStar GSD 320, Pfeiffer Vacuum). To a solid sample (20 mg), 1 mL of concentrated sulfuric acid (95–98 wt %) was added and the gas phase was analyzed by the mass spectrometer. Powder XRD data were collected in the 5–50° 2θ range using a Seifert XRD 3003 TT powder diffractometer with a Meteor1D detector operating at room temperature using Cu Kα1 radiation (λ = 1.54187 Å). Variable-temperature powder XRD data were measured in the 5–50° 2θ range under nitrogen atmosphere with an Empyrean (PANalytical) diffractometer equipped with a Bragg–Brentano HD mirror and a PICcel3D 2×2 detector. The temperature program was carried out at 50 °C steps up 600 °C at a heating rate of 0.5 °C s−1 and held for 10 min between the measurements. SEM micrographs were recorded on a Zeiss Gemini 2 (Crossbeam 550) instrument operating at 30 kV. The 19F MAS NMR spectrum was recorded at a frequency of 282.5 MHz employing a Bruker Avance III spectrometer at a field of 7 T equipped with a 4 mm Bruker MAS probe. The MAS frequency was set to 8 kHz, and a repetition rate of 2 s (T1 = 0.37 s at room temperature) was used to collect the signal. The spectrum was referenced against CFCl3.
MFU-4 synthesis
MFU-4 was prepared by a microwave-assisted synthesis following the previously reported procedure [13]. Briefly, a mixture of benzobistriazole (100 mg, 0.624 mmol) and anhydrous ZnCl2 (340 mg, 2.495 mmol) in DMF (5 mL) was placed in a pyrex tube (30 mL). The reaction mixture was heated in a microwave synthesizer (CEM, Discover S) to 155 °C at 300 W and kept under these conditions for 10 min and then cooled to room temperature. The formed precipitate was isolated by centrifugation, washed well with DMF (3 × 5 mL) and dried in air at ambient conditions to give an off-white crystalline material (166 mg). Prior to the SF6-loading experiments, the material was kept under vacuum at 320 °C overnight to remove any solvent molecules from the voids.
SF6-loading experiments
Analogous as described in [12], in each experiment, 50−100 mg of MFU-4 was placed in a steel vessel constructed from metal tubing attached to a manometer. The vessel was filled with SF6 gas and kept at the desired pressure and temperature for a desired period of time. Upon cooling, the gas pressure was released, and the sample was immediately analyzed with TGA, FTIR and XRPD methods.
SF6-release experiments
In a similar manner as described in [12], the SF6-loaded sample was stored in a container opened to air, and after a certain period of time (0, 1, 3, 7, 14 or 60 days) a small amount (≈10 mg) was taken and analyzed by TGA, FTIR and XRPD methods.
Computational simulations
To obtain a rough estimate of the energy changes along the linear transition path of SF6 passing through a single unit cell of MFU-4 (Figure 5a), molecular mechanics calculations were performed, employing the universal force field (UFF) [35] parameters as included in the GULP code [36]. Force field atom types were assigned automatically within Material Studio’s Visualizer GUI [37]. The cell parameters for the cubic unit cell of MFU-4 were taken from the published single crystal structural data, with a = 21.697 Å [13], which was kept at the experimental value in all subsequent calculations. The electrostatic-potential-derived partial (ESP) charges for the lattice atoms of MFU-4 and for SF6 were obtained from discrete cluster DFT calculations, as described previously [44]. ESP values for the symmetry unique atoms of MFU-4 and SF6 are displayed in the Supporting Information File 1 in Figure S13.
Prior to the potential energy scan, all atomic positions of the MFU-4 unit cell were fully relaxed at tight convergence settings. Next, a single SF6 molecule was added to the unit cell, centered at a fractional atomic position 0.5a, 0.5b, 0.0c. The transition path of SF6 was set to the length of one unit cell and a complete translation of SF6 was performed in 200 steps, ending at fractional atomic positions 0.5a, 0.5b, 1.0c. The “translation” directive included in GULP was employed for automatizing the SF6 linear transition task in a single run (setting: translate 0.0 0.0 1.0 200 noise 0.05), during which a geometry-constrained linear F–S–F fragment placed along the transition path (as part of SF6) was moved in steps of c/200 Å in the <001> direction. The lattice constants and some hydrogen atoms were fixed during the run, the latter constraints being required to avoid translation of the whole framework when approaching the transition state of the scan path. An example input file is provided as part of Supporting Information File 1. PW-DFT+D calculations were performed with the CASTEP code [37], employing the PBE functional [38] and on-the-fly generated ultrasoft pseudopotentials (energy cut-off: 570 eV). Geometry optimizations were performed in different symmetry-constrained unit cells of MFU-4 (tetragonal space group P4mm (no. 99) for those cells corresponding to “min”, “TS”, and “centre”; cubic space group Pm−3m for the “start/end” configuration). Again, the experimental lattice parameter a = 21.697 Å was retained during all calculations. The two different correction methods were included in all DFT calculations in order to account for dispersion interactions.
Supporting Information
| Supporting Information File 1: Additional results of SF6-loading and SF6-release experiments (TGA, FTIR and powder XRD measurements), and an example of an input file for the computation simulations. | ||
| Format: PDF | Size: 1.6 MB | Download |
References
-
Batten, S. R.; Champness, N. R.; Chen, X.-M.; Garcia-Martinez, J.; Kitagawa, S.; Öhrström, L.; O’Keeffe, M.; Paik Suh, M.; Reedijk, J. Pure Appl. Chem. 2013, 85, 1715–1724. doi:10.1351/pac-rec-12-11-20
Return to citation in text: [1] -
Furukawa, H.; Cordova, K. E.; O'Keeffe, M.; Yaghi, O. M. Science 2013, 341, 1230444. doi:10.1126/science.1230444
Return to citation in text: [1] -
Farha, O. K.; Özgür Yazaydın, A.; Eryazici, I.; Malliakas, C. D.; Hauser, B. G.; Kanatzidis, M. G.; Nguyen, S. T.; Snurr, R. Q.; Hupp, J. T. Nat. Chem. 2010, 2, 944–948. doi:10.1038/nchem.834
Return to citation in text: [1] -
Ma, S.; Zhou, H.-C. Chem. Commun. 2010, 46, 44–53. doi:10.1039/b916295j
Return to citation in text: [1] -
Li, H.; Wang, K.; Sun, Y.; Lollar, C. T.; Li, J.; Zhou, H.-C. Mater. Today 2018, 21, 108–121. doi:10.1016/j.mattod.2017.07.006
Return to citation in text: [1] [2] -
Sculley, J.; Yuan, D.; Zhou, H.-C. Energy Environ. Sci. 2011, 4, 2721–2735. doi:10.1039/c1ee01240a
Return to citation in text: [1] -
Suh, M. P.; Park, H. J.; Prasad, T. K.; Lim, D.-W. Chem. Rev. 2012, 112, 782–835. doi:10.1021/cr200274s
Return to citation in text: [1] [2] -
García-Holley, P.; Schweitzer, B.; Islamoglu, T.; Liu, Y.; Lin, L.; Rodriguez, S.; Weston, M. H.; Hupp, J. T.; Gómez-Gualdrón, D. A.; Yildirim, T.; Farha, O. K. ACS Energy Lett. 2018, 3, 748–754. doi:10.1021/acsenergylett.8b00154
Return to citation in text: [1] -
Makal, T. A.; Li, J.-R.; Lua, W.; Zhou, H.-C. Chem. Soc. Rev. 2012, 41, 7761–7779. doi:10.1039/c2cs35251f
Return to citation in text: [1] -
He, Y.; Zhou, W.; Qian, G.; Chen, B. Chem. Soc. Rev. 2014, 43, 5657–5678. doi:10.1039/c4cs00032c
Return to citation in text: [1] -
Eddaoudi, M.; Kim, J.; Rosi, N.; Vodak, D.; Wachter, J.; O’Keeffe, M.; Yaghi, O. M. Science 2002, 295, 469–472. doi:10.1126/science.1067208
Return to citation in text: [1] [2] -
Bunzen, H.; Kolbe, F.; Kalytta-Mewes, A.; Sastre, G.; Brunner, E.; Volkmer, D. J. Am. Chem. Soc. 2018, 140, 10191–10197. doi:10.1021/jacs.8b04582
Return to citation in text: [1] [2] [3] [4] [5] [6] -
Biswas, S.; Grzywa, M.; Nayek, H. P.; Dehnen, S.; Senkovska, I.; Kaskel, S.; Volkmer, D. Dalton Trans. 2009, 6487–6495. doi:10.1039/b904280f
Return to citation in text: [1] [2] [3] [4] -
Breck, D. W. Recent Advances in Zeolite Science. In Molecular Sieve Zeolites-I; Flanigen, E. M.; Sand, L. B., Eds.; Advances in Chemistry, Vol. 101; American Chemical Society: Washington, DC, U.S.A., 1974; pp 1–19. doi:10.1021/ba-1971-0101.ch001
Return to citation in text: [1] [2] [3] -
Christophorou, L. G.; Van Brunt, R. J. IEEE Trans. Dielectr. Electr. Insul. 1995, 2, 952–1003. doi:10.1109/94.469988
Return to citation in text: [1] -
Xiao, S.; Zhang, X.; Tang, J.; Liu, S. Energy Rep. 2018, 4, 486–496. doi:10.1016/j.egyr.2018.07.006
Return to citation in text: [1] -
Ravishankara, A. R.; Solomon, S.; Turnipseed, A. A.; Warren, R. F. Science 1993, 259, 194–199. doi:10.1126/science.259.5092.194
Return to citation in text: [1] -
Fang, X.; Hu, X.; Janssens-Maenhout, G.; Wu, J.; Han, J.; Su, S.; Zhang, J.; Hu, J. Environ. Sci. Technol. 2013, 47, 3848–3855. doi:10.1021/es304348x
Return to citation in text: [1] -
Chiang, Y.-C.; Wu, P.-Y. J. Hazard. Mater. 2010, 178, 729–738. doi:10.1016/j.jhazmat.2010.02.003
Return to citation in text: [1] -
Takase, A.; Kanoh, H.; Ohba, T. Sci. Rep. 2015, 5, 11994. doi:10.1038/srep11994
Return to citation in text: [1] -
Murase, H.; Imai, T.; Inohara, T.; Toyoda, M. IEEE Trans. Dielectr. Electr. Insul. 2004, 11, 166–173. doi:10.1109/tdei.2004.1266332
Return to citation in text: [1] -
Toyoda, M.; Murase, H.; Imai, T.; Naotsuka, H.; Kobayashi, A.; Takano, K.; Ohkuma, K. IEEE Trans. Power Delivery 2003, 18, 442–448. doi:10.1109/tpwrd.2002.803691
Return to citation in text: [1] -
Cao, D. V.; Sircar, S. Ind. Eng. Chem. Res. 2001, 40, 156–162. doi:10.1021/ie000650b
Return to citation in text: [1] -
Senkovska, I.; Barea, E.; Navarro, J. A. R.; Kaskel, S. Microporous Mesoporous Mater. 2012, 156, 115–120. doi:10.1016/j.micromeso.2012.02.021
Return to citation in text: [1] -
Kim, M.-B.; Lee, S.-J.; Lee, C. Y.; Bae, Y.-S. Microporous Mesoporous Mater. 2014, 190, 356–361. doi:10.1016/j.micromeso.2014.02.028
Return to citation in text: [1] -
Skarmoutsos, I.; Eddaoudi, M.; Maurin, G. Microporous Mesoporous Mater. 2019, 281, 44–49. doi:10.1016/j.micromeso.2019.02.035
Return to citation in text: [1] -
Han, L.; Guo, T.; Guo, Z.; Wang, C.; Zhang, W.; Shakya, S.; Ding, H.; Li, H.; Xu, X.; Ren, Y.; Zhang, J. J. Phys. Chem. B 2018, 122, 5225–5233. doi:10.1021/acs.jpcb.8b01420
Return to citation in text: [1] -
Hasell, T.; Miklitz, M.; Stephenson, A.; Little, M. A.; Chong, S. Y.; Clowes, R.; Chen, L.; Holden, D.; Tribello, G. A.; Jelfs, K. E.; Cooper, A. I. J. Am. Chem. Soc. 2016, 138, 1653–1659. doi:10.1021/jacs.5b11797
Return to citation in text: [1] -
Riddell, I. A.; Smulders, M. M. J.; Clegg, J. K.; Nitschke, J. R. Chem. Commun. 2011, 47, 457–459. doi:10.1039/c0cc02573a
Return to citation in text: [1] -
Flynn, J. H.; Wall, L. A. J. Polym. Sci., Part B: Polym. Lett. 1966, 4, 323–328. doi:10.1002/pol.1966.110040504
Return to citation in text: [1] -
Blaine, R. L.; Hahn, B. K. J. Therm. Anal. Calorim. 1998, 54, 695–704. doi:10.1023/a:1010171315715
Return to citation in text: [1] [2] -
Chapados, C.; Birnbaum, G. J. Mol. Spectrosc. 1988, 132, 323–351. doi:10.1016/0022-2852(88)90329-3
Return to citation in text: [1] -
Chen, B.; Wang, X.; Zhang, Q.; Xi, X.; Cai, J.; Qi, H.; Shi, S.; Wang, J.; Yuan, D.; Fang, M. J. Mater. Chem. 2010, 20, 3758–3767. doi:10.1039/b922528e
Return to citation in text: [1] -
Dungan, C. H.; van Wazer, J. R. Compilation of reported F¹⁹ NMR chemical shifts, 1951 to mid-1967; Wiley-Interscience: New York, NY, U.S.A., 1970.
Return to citation in text: [1] -
Rappe, A. K.; Casewit, C. J.; Colwell, K. S.; Goddard, W. A.; Skiff, W. M. J. Am. Chem. Soc. 1992, 114, 10024–10035. doi:10.1021/ja00051a040
Return to citation in text: [1] [2] -
Gale, J. D.; Rohl, A. L. Mol. Simul. 2003, 29, 291–341. doi:10.1080/0892702031000104887
Return to citation in text: [1] [2] -
BIOVIA Materials Studio, 2019; .
Return to citation in text: [1] [2] [3] -
Perdew, J. P.; Burke, K.; Ernzerhof, M. Phys. Rev. Lett. 1996, 77, 3865–3868. doi:10.1103/physrevlett.77.3865
Return to citation in text: [1] [2] -
Tkatchenko, A.; Scheffler, M. Phys. Rev. Lett. 2009, 102, 073005. doi:10.1103/physrevlett.102.073005
Return to citation in text: [1] -
Ambrosetti, A.; Reilly, A. M.; Di Stasio, R. A., Jr.; Tkatchenko, A. J. Chem. Phys. 2014, 140, 18A508. doi:10.1063/1.4865104
Return to citation in text: [1] -
Dibeler, V. H.; Mohler, F. L. J. Res. Natl. Bur. Stand. (U. S.) 1948, 40, 25–29. doi:10.6028/jres.040.014
Return to citation in text: [1] -
Wang, J.; Ding, W.; Yan, J.; Wang, Y.; Wang, Y.; Li, Z.; Li, G. IEEE Trans. Dielectr. Electr. Insul. 2017, 24, 3405–3415. doi:10.1109/tdei.2017.006572
Return to citation in text: [1] -
Hart, H.; Ok, D. J. Org. Chem. 1986, 51, 979–986. doi:10.1021/jo00357a005
Return to citation in text: [1] -
Sastre, G.; van den Bergh, J.; Kapteijn, F.; Denysenko, D.; Volkmer, D. Dalton Trans. 2014, 43, 9612–9619. doi:10.1039/c4dt00365a
Return to citation in text: [1]
| 38. | Perdew, J. P.; Burke, K.; Ernzerhof, M. Phys. Rev. Lett. 1996, 77, 3865–3868. doi:10.1103/physrevlett.77.3865 |
| 39. | Tkatchenko, A.; Scheffler, M. Phys. Rev. Lett. 2009, 102, 073005. doi:10.1103/physrevlett.102.073005 |
| 1. | Batten, S. R.; Champness, N. R.; Chen, X.-M.; Garcia-Martinez, J.; Kitagawa, S.; Öhrström, L.; O’Keeffe, M.; Paik Suh, M.; Reedijk, J. Pure Appl. Chem. 2013, 85, 1715–1724. doi:10.1351/pac-rec-12-11-20 |
| 5. | Li, H.; Wang, K.; Sun, Y.; Lollar, C. T.; Li, J.; Zhou, H.-C. Mater. Today 2018, 21, 108–121. doi:10.1016/j.mattod.2017.07.006 |
| 7. | Suh, M. P.; Park, H. J.; Prasad, T. K.; Lim, D.-W. Chem. Rev. 2012, 112, 782–835. doi:10.1021/cr200274s |
| 11. | Eddaoudi, M.; Kim, J.; Rosi, N.; Vodak, D.; Wachter, J.; O’Keeffe, M.; Yaghi, O. M. Science 2002, 295, 469–472. doi:10.1126/science.1067208 |
| 19. | Chiang, Y.-C.; Wu, P.-Y. J. Hazard. Mater. 2010, 178, 729–738. doi:10.1016/j.jhazmat.2010.02.003 |
| 20. | Takase, A.; Kanoh, H.; Ohba, T. Sci. Rep. 2015, 5, 11994. doi:10.1038/srep11994 |
| 12. | Bunzen, H.; Kolbe, F.; Kalytta-Mewes, A.; Sastre, G.; Brunner, E.; Volkmer, D. J. Am. Chem. Soc. 2018, 140, 10191–10197. doi:10.1021/jacs.8b04582 |
| 9. | Makal, T. A.; Li, J.-R.; Lua, W.; Zhou, H.-C. Chem. Soc. Rev. 2012, 41, 7761–7779. doi:10.1039/c2cs35251f |
| 10. | He, Y.; Zhou, W.; Qian, G.; Chen, B. Chem. Soc. Rev. 2014, 43, 5657–5678. doi:10.1039/c4cs00032c |
| 11. | Eddaoudi, M.; Kim, J.; Rosi, N.; Vodak, D.; Wachter, J.; O’Keeffe, M.; Yaghi, O. M. Science 2002, 295, 469–472. doi:10.1126/science.1067208 |
| 21. | Murase, H.; Imai, T.; Inohara, T.; Toyoda, M. IEEE Trans. Dielectr. Electr. Insul. 2004, 11, 166–173. doi:10.1109/tdei.2004.1266332 |
| 22. | Toyoda, M.; Murase, H.; Imai, T.; Naotsuka, H.; Kobayashi, A.; Takano, K.; Ohkuma, K. IEEE Trans. Power Delivery 2003, 18, 442–448. doi:10.1109/tpwrd.2002.803691 |
| 23. | Cao, D. V.; Sircar, S. Ind. Eng. Chem. Res. 2001, 40, 156–162. doi:10.1021/ie000650b |
| 35. | Rappe, A. K.; Casewit, C. J.; Colwell, K. S.; Goddard, W. A.; Skiff, W. M. J. Am. Chem. Soc. 1992, 114, 10024–10035. doi:10.1021/ja00051a040 |
| 6. | Sculley, J.; Yuan, D.; Zhou, H.-C. Energy Environ. Sci. 2011, 4, 2721–2735. doi:10.1039/c1ee01240a |
| 7. | Suh, M. P.; Park, H. J.; Prasad, T. K.; Lim, D.-W. Chem. Rev. 2012, 112, 782–835. doi:10.1021/cr200274s |
| 8. | García-Holley, P.; Schweitzer, B.; Islamoglu, T.; Liu, Y.; Lin, L.; Rodriguez, S.; Weston, M. H.; Hupp, J. T.; Gómez-Gualdrón, D. A.; Yildirim, T.; Farha, O. K. ACS Energy Lett. 2018, 3, 748–754. doi:10.1021/acsenergylett.8b00154 |
| 15. | Christophorou, L. G.; Van Brunt, R. J. IEEE Trans. Dielectr. Electr. Insul. 1995, 2, 952–1003. doi:10.1109/94.469988 |
| 16. | Xiao, S.; Zhang, X.; Tang, J.; Liu, S. Energy Rep. 2018, 4, 486–496. doi:10.1016/j.egyr.2018.07.006 |
| 13. | Biswas, S.; Grzywa, M.; Nayek, H. P.; Dehnen, S.; Senkovska, I.; Kaskel, S.; Volkmer, D. Dalton Trans. 2009, 6487–6495. doi:10.1039/b904280f |
| 2. | Furukawa, H.; Cordova, K. E.; O'Keeffe, M.; Yaghi, O. M. Science 2013, 341, 1230444. doi:10.1126/science.1230444 |
| 3. | Farha, O. K.; Özgür Yazaydın, A.; Eryazici, I.; Malliakas, C. D.; Hauser, B. G.; Kanatzidis, M. G.; Nguyen, S. T.; Snurr, R. Q.; Hupp, J. T. Nat. Chem. 2010, 2, 944–948. doi:10.1038/nchem.834 |
| 4. | Ma, S.; Zhou, H.-C. Chem. Commun. 2010, 46, 44–53. doi:10.1039/b916295j |
| 5. | Li, H.; Wang, K.; Sun, Y.; Lollar, C. T.; Li, J.; Zhou, H.-C. Mater. Today 2018, 21, 108–121. doi:10.1016/j.mattod.2017.07.006 |
| 17. | Ravishankara, A. R.; Solomon, S.; Turnipseed, A. A.; Warren, R. F. Science 1993, 259, 194–199. doi:10.1126/science.259.5092.194 |
| 18. | Fang, X.; Hu, X.; Janssens-Maenhout, G.; Wu, J.; Han, J.; Su, S.; Zhang, J.; Hu, J. Environ. Sci. Technol. 2013, 47, 3848–3855. doi:10.1021/es304348x |
| 12. | Bunzen, H.; Kolbe, F.; Kalytta-Mewes, A.; Sastre, G.; Brunner, E.; Volkmer, D. J. Am. Chem. Soc. 2018, 140, 10191–10197. doi:10.1021/jacs.8b04582 |
| 14. | Breck, D. W. Recent Advances in Zeolite Science. In Molecular Sieve Zeolites-I; Flanigen, E. M.; Sand, L. B., Eds.; Advances in Chemistry, Vol. 101; American Chemical Society: Washington, DC, U.S.A., 1974; pp 1–19. doi:10.1021/ba-1971-0101.ch001 |
| 14. | Breck, D. W. Recent Advances in Zeolite Science. In Molecular Sieve Zeolites-I; Flanigen, E. M.; Sand, L. B., Eds.; Advances in Chemistry, Vol. 101; American Chemical Society: Washington, DC, U.S.A., 1974; pp 1–19. doi:10.1021/ba-1971-0101.ch001 |
| 42. | Wang, J.; Ding, W.; Yan, J.; Wang, Y.; Wang, Y.; Li, Z.; Li, G. IEEE Trans. Dielectr. Electr. Insul. 2017, 24, 3405–3415. doi:10.1109/tdei.2017.006572 |
| 13. | Biswas, S.; Grzywa, M.; Nayek, H. P.; Dehnen, S.; Senkovska, I.; Kaskel, S.; Volkmer, D. Dalton Trans. 2009, 6487–6495. doi:10.1039/b904280f |
| 14. | Breck, D. W. Recent Advances in Zeolite Science. In Molecular Sieve Zeolites-I; Flanigen, E. M.; Sand, L. B., Eds.; Advances in Chemistry, Vol. 101; American Chemical Society: Washington, DC, U.S.A., 1974; pp 1–19. doi:10.1021/ba-1971-0101.ch001 |
| 12. | Bunzen, H.; Kolbe, F.; Kalytta-Mewes, A.; Sastre, G.; Brunner, E.; Volkmer, D. J. Am. Chem. Soc. 2018, 140, 10191–10197. doi:10.1021/jacs.8b04582 |
| 40. | Ambrosetti, A.; Reilly, A. M.; Di Stasio, R. A., Jr.; Tkatchenko, A. J. Chem. Phys. 2014, 140, 18A508. doi:10.1063/1.4865104 |
| 12. | Bunzen, H.; Kolbe, F.; Kalytta-Mewes, A.; Sastre, G.; Brunner, E.; Volkmer, D. J. Am. Chem. Soc. 2018, 140, 10191–10197. doi:10.1021/jacs.8b04582 |
| 12. | Bunzen, H.; Kolbe, F.; Kalytta-Mewes, A.; Sastre, G.; Brunner, E.; Volkmer, D. J. Am. Chem. Soc. 2018, 140, 10191–10197. doi:10.1021/jacs.8b04582 |
| 41. | Dibeler, V. H.; Mohler, F. L. J. Res. Natl. Bur. Stand. (U. S.) 1948, 40, 25–29. doi:10.6028/jres.040.014 |
| 12. | Bunzen, H.; Kolbe, F.; Kalytta-Mewes, A.; Sastre, G.; Brunner, E.; Volkmer, D. J. Am. Chem. Soc. 2018, 140, 10191–10197. doi:10.1021/jacs.8b04582 |
| 24. | Senkovska, I.; Barea, E.; Navarro, J. A. R.; Kaskel, S. Microporous Mesoporous Mater. 2012, 156, 115–120. doi:10.1016/j.micromeso.2012.02.021 |
| 25. | Kim, M.-B.; Lee, S.-J.; Lee, C. Y.; Bae, Y.-S. Microporous Mesoporous Mater. 2014, 190, 356–361. doi:10.1016/j.micromeso.2014.02.028 |
| 26. | Skarmoutsos, I.; Eddaoudi, M.; Maurin, G. Microporous Mesoporous Mater. 2019, 281, 44–49. doi:10.1016/j.micromeso.2019.02.035 |
| 27. | Han, L.; Guo, T.; Guo, Z.; Wang, C.; Zhang, W.; Shakya, S.; Ding, H.; Li, H.; Xu, X.; Ren, Y.; Zhang, J. J. Phys. Chem. B 2018, 122, 5225–5233. doi:10.1021/acs.jpcb.8b01420 |
| 36. | Gale, J. D.; Rohl, A. L. Mol. Simul. 2003, 29, 291–341. doi:10.1080/0892702031000104887 |
| 28. | Hasell, T.; Miklitz, M.; Stephenson, A.; Little, M. A.; Chong, S. Y.; Clowes, R.; Chen, L.; Holden, D.; Tribello, G. A.; Jelfs, K. E.; Cooper, A. I. J. Am. Chem. Soc. 2016, 138, 1653–1659. doi:10.1021/jacs.5b11797 |
| 29. | Riddell, I. A.; Smulders, M. M. J.; Clegg, J. K.; Nitschke, J. R. Chem. Commun. 2011, 47, 457–459. doi:10.1039/c0cc02573a |
| 13. | Biswas, S.; Grzywa, M.; Nayek, H. P.; Dehnen, S.; Senkovska, I.; Kaskel, S.; Volkmer, D. Dalton Trans. 2009, 6487–6495. doi:10.1039/b904280f |
| 35. | Rappe, A. K.; Casewit, C. J.; Colwell, K. S.; Goddard, W. A.; Skiff, W. M. J. Am. Chem. Soc. 1992, 114, 10024–10035. doi:10.1021/ja00051a040 |
| 36. | Gale, J. D.; Rohl, A. L. Mol. Simul. 2003, 29, 291–341. doi:10.1080/0892702031000104887 |
| 34. | Dungan, C. H.; van Wazer, J. R. Compilation of reported F¹⁹ NMR chemical shifts, 1951 to mid-1967; Wiley-Interscience: New York, NY, U.S.A., 1970. |
| 13. | Biswas, S.; Grzywa, M.; Nayek, H. P.; Dehnen, S.; Senkovska, I.; Kaskel, S.; Volkmer, D. Dalton Trans. 2009, 6487–6495. doi:10.1039/b904280f |
| 32. | Chapados, C.; Birnbaum, G. J. Mol. Spectrosc. 1988, 132, 323–351. doi:10.1016/0022-2852(88)90329-3 |
| 38. | Perdew, J. P.; Burke, K.; Ernzerhof, M. Phys. Rev. Lett. 1996, 77, 3865–3868. doi:10.1103/physrevlett.77.3865 |
| 33. | Chen, B.; Wang, X.; Zhang, Q.; Xi, X.; Cai, J.; Qi, H.; Shi, S.; Wang, J.; Yuan, D.; Fang, M. J. Mater. Chem. 2010, 20, 3758–3767. doi:10.1039/b922528e |
| 30. | Flynn, J. H.; Wall, L. A. J. Polym. Sci., Part B: Polym. Lett. 1966, 4, 323–328. doi:10.1002/pol.1966.110040504 |
| 31. | Blaine, R. L.; Hahn, B. K. J. Therm. Anal. Calorim. 1998, 54, 695–704. doi:10.1023/a:1010171315715 |
| 44. | Sastre, G.; van den Bergh, J.; Kapteijn, F.; Denysenko, D.; Volkmer, D. Dalton Trans. 2014, 43, 9612–9619. doi:10.1039/c4dt00365a |
| 31. | Blaine, R. L.; Hahn, B. K. J. Therm. Anal. Calorim. 1998, 54, 695–704. doi:10.1023/a:1010171315715 |
© 2019 Bunzen et al.; licensee Beilstein-Institut.
This is an Open Access article under the terms of the Creative Commons Attribution License (http://creativecommons.org/licenses/by/4.0). Please note that the reuse, redistribution and reproduction in particular requires that the authors and source are credited.
The license is subject to the Beilstein Journal of Nanotechnology terms and conditions: (https://www.beilstein-journals.org/bjnano)