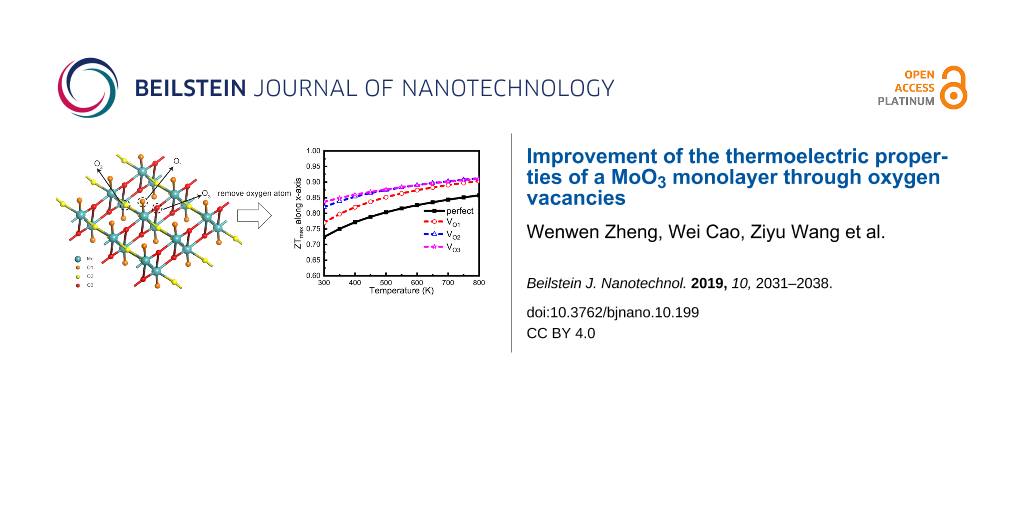
Improvement of the thermoelectric properties of a MoO3 monolayer through oxygen vacancies
1,
2,
3,
4,
2 and
2
Wenwen Zheng
Hubei Key Laboratory of Optical Information and Pattern Recognition, School of Mathematics and Physics, Wuhan Institute of Technology, Wuhan 430205, China
Key Laboratory of Artificial Micro- and Nano-Structures of Ministry of Education, School of Physics and Technology, Wuhan University, Wuhan 430072, China
State Key Laboratory of Superlattices and Microstructures, Institute of Semiconductors, Chinese Academy of Sciences, P. O. Box 912, Beijing 100083, China
Key Laboratory of Artificial Micro- and Nano-Structures of Ministry of Education, School of Physics and Technology, Wuhan University, Wuhan 430072, China
Key Laboratory of Artificial Micro- and Nano-Structures of Ministry of Education, School of Physics and Technology, Wuhan University, Wuhan 430072, China
1Hubei Key Laboratory of Optical Information and Pattern Recognition, School of Mathematics and Physics, Wuhan Institute of Technology, Wuhan 430205, China
2Key Laboratory of Artificial Micro- and Nano-Structures of Ministry of Education, School of Physics and Technology, Wuhan University, Wuhan 430072, China
3The Institute of Technological Sciences, Wuhan University, Wuhan 430072, China
4State Key Laboratory of Superlattices and Microstructures, Institute of Semiconductors, Chinese Academy of Sciences, P. O. Box 912, Beijing 100083, China
Corresponding author email
Associate Editor: N. Motta Beilstein J. Nanotechnol.2019,10, 2031–2038.https://doi.org/10.3762/bjnano.10.199 Received 23 Jul 2019,
Accepted 16 Oct 2019,
Published 25 Oct 2019
We have investigated the thermoelectric properties of a pristine MoO3 monolayer and its defective structures with different oxygen vacancies using first-principles methods combined with Boltzmann transport theory. Our results show that the thermoelectric properties of the MoO3 monolayer exhibit an evident anisotropic behavior which is caused by the similar anisotropy of the electrical and thermal conductivity. The thermoelectric materials figure of merit (ZT) value along the x- and the y-axis is 0.72 and 0.08 at 300 K, respectively. Moreover, the creation of oxygen vacancies leads to a sharp peak near the Fermi level in the density of states. This proves to be an effective way to enhance the ZT values of the MoO3 monolayer. The increased ZT values can reach 0.84 (x-axis) and 0.12 (y-axis) at 300 K.
Thermoelectric materials that can directly convert temperature gradients to voltage gradients and vice versa provide a valid strategy to mitigate the global energy crisis. Owing to the unique ability of utilizing waste heat without generating any greenhouse gas, thermoelectric technology has attracted increasing attention [1]. Nevertheless, the application of thermoelectric materials is limited by the low energy conversion efficiency. The performance of thermoelectric materials is usually measured by a figure of merit (ZT) defined as ZT = S2σT/κ, where S, σ, T and κ represent the Seebeck coefficient, electrical conductivity, temperature and thermal conductivity, respectively [2,3]. In the past decade, great efforts have been made to boost the capabilities of thermoelectric materials. Unfortunately, the application of conventional thermoelectric materials is still limited by inefficiency and problems with high-cost, stability and toxicity.
As promising candidates to address these severe challenges, transition metal oxides (TMOs) provide a vast variety of low-cost and environmentally friendly materials. From insulating to semiconducting and conducting, TMOs exhibit wide-ranging electrical and magnetic characteristics that depend on their geometric structure, doping concentration and stoichiometry ratio [4]. TMOs have been used in many fields such as Li-ion batteries, electrochemical capacitors and fuel cells [5]. Meanwhile, the thermoelectric application of TMO-based materials has been explored and their poor efficiency is still the major difficulty [6].
Among the TMOs, layered molybdenum trioxide (MoO3) has attracted attention as a potential electrode material in electrochemical products [7] and Li-ion batteries [8-11]. Like most TMOs, bulk MoO3 has a wide band gap (about 3.0 eV) and low electrical conductivity, which seems inappropriate for thermoelectric devices. However, the electrical properties (including band gap and conductivity) of MoO3 are strongly dependent on the concentration of O vacancy concentrations. Hydrogen-ion intercalation [12] and solar-light irradiation [13] can turn MoO3 into MoO3−x and hence increase the electrical conductivity. Understanding the effect of O vacancies in MoO3 is very beneficial for its thermoelectric applications. Moreover, low-dimensional materials show a better thermoelectric performance than bulk materials [14]. Few-layer MoO3 nanosheets have already been experimentally synthesized by exfoliation similar to graphene [12,13,15,16]. Theoretical research has proved that few-layer MoO3 possesses a markedly high carrier mobility above 3000 cm2·V−1·s−1[17]. Therefore, it is of profound significance to explore the thermoelectric properties of MoO3 monolayers and discuss the effect of O vacancies on it.
Computational methods
In this work, we evaluate the thermoelectric properties of a MoO3 monolayer by Boltzmann transport theory and first-principles calculations. The calculations of the electrical properties of the MoO3 monolayer are performed using density functional theory (DFT) as implemented in the Vienna ab initio simulation package (VASP) code [18,19]. We utilize the generalized gradient approximation (GGA) of the Perdew–Burke–Ernzerhof (PBE) [20] pseudopotentials without spin–orbit interaction. Since the PBE functional fails to capture the electrical and optical properties of bulk MoO3 by a large margin (band gap of less than half of the experimental value), we also employ the Heyd–Scuseria–Ernzerhof (HSE06) hybrid functional [21,22] to obtain a more accurate band structure. The vacuum distance is set to 15 Å to avoid interactions between the MoO3 monolayer and its periodic images. A plane-wave basis set with a cutoff of 520 eV is chosen, and the k-mesh is tested to be 10 × 10 × 1 for the purpose of convergence.
Based on the electronic structure, the electrical transport properties can be obtained using the Boltzmann transport theory and the constant scattering time approximation as implemented in the BoltzTraP code [23]. To get reliable electrical transport coefficients, a denser k-point mesh of 40 × 40 × 1 is used to obtain converged results. Based on the framework of Boltzmann transport theory, the electrical conductivity, σ, and the Seebeck coefficient, S, can be expressed as:
(1)(2)(3)
where the u is the chemical potential (corresponding to the carrier concentration), kB is the Boltzmann constant, e is the electron charge and T is the absolute temperature. Σ(ε) is the so-called transport distribution function [24]:
(4)
where is the group velocity of the carriers and is the relaxation time. The thermal conductivity κe is obtained by the Wiedemann–Franz law: κe = LσT, where L is the Lorenz number. For the calculation of the relaxation time τ, we apply the deformation potential (DP) theory [25] where τ is estimated by τ = μm*/e. The carrier mobility μ2D in 2D materials is given by
Where m* is the effective mass and md is the density of states (DOS) mass determined by
E1 is the DP constant and C2D is the elastic modulus. All parameters corresponding to the carrier mobility and the effective mass are taken from [17] and summarized in Table 1.
Table 1:
The effective mass (m*), carrier mobility (μ) and relaxation time (τ) along the x- and the y-directions of the MoO3 monolayer at 300 K.
carriers
mx*/m0
my*/m0
µx (cm2·V−1·s−1)
µy (cm2·V−1·s−1)
τx (ps)
τy (ps)
PBE
electron
0.873
0.594
1608.81
37.52
0.786
0.012
hole
2.064
0.974
800.57
25.56
0.925
0.013
HSE06
electron
1.056
0.588
793.59
33.60
0.469
0.011
hole
1.669
0.910
396.35
19.99
0.370
0.010
As for phononic transport properties, we calculate the thermal conductivity of the lattice using the Boltzmann transport theory as implemented in the Quantum ESPRESSO (QE) package [26,27] and the ShengBTE code [28]. The pseudopotential files are obtained from the standard solid-state pseudopotentials library [29] and the kinetic energy cutoff is set to 80 Ry. Density functional perturbation theory (DFPT) is adopted from the QE package for the calculation of second-order (harmonic) interatomic force constants (IFCs), and third-order (anharmonic) IFCs are obtained from the ShengBTE code [28] with the maximum atomic interaction distance of the sixth neighbor in the 4 × 4 × 1 supercell. Here, a dense phonon q-grid of 52 × 52 × 1 is used to compute the thermal conductivity of the lattice of MoO3, and the scale parameter for smearing is set to 0.1.
Results and Discussion
As shown in Figure 1a, the MoO3 monolayer is cut from an orthorhombic α-MoO3 bulk structure (space group Pbnm), and the primitive cell contains eight atoms. Apparently, there are three distinguishable O atoms, that are connected to different molybdenum atoms, as indicated by different colors in Figure 1a. The relaxed lattice constants of the MoO3 monolayer are a = 3.68 Å and b = 3.93 Å, which are similar to the bulk experimental data of 3.70 and 3.96 Å [30]. In Figure 1b, we give the electronic band structure of the MoO3 monolayer as calculated using the PBE potential and the HSE06 hybrid functional potential. One can see clearly that both of the two different potentials yield similar electronic band structures for the larger energy gaps. The minimum point of the first conduction band (CBM) appears at the Γ point, while the maximum of the first valence band (VBM) appears at the S point. The indirect bandgap of the MoO3 monolayer is computed as 1.79 eV for PBE and 2.85 eV for HSE06, which is consistent with previous studies [17,31]. Since the MoO3 monolayer is a wide-gap semiconductor, it is likely to exhibit a giant Seebeck coefficient and low electrical conductivity. The discrepancies between the results obtained using the PBE potential and the HSE06 hybrid functional are inconspicuous concerning the Seebeck coefficient and the electrical conductivity. Considering the extremely slow speed of the HSE06 hybrid functional potential, we use the PBE potential to get the electrical transport properties of the MoO3 monolayer in the following work.
Figure 1:
(a) Crystal structures of the MoO3 monolayer (3 × 3 × 1 supercell): top and side views. (b) The electronic band structure and (c) the phonon dispersion of the MoO3 monolayer along the high-symmetry path. (d) The lattice thermal conductivity, κph, of the MoO3 monolayer along different directions as a function of temperature.
Figure 1:
(a) Crystal structures of the MoO3 monolayer (3 × 3 × 1 supercell): top and side views. (b) The ele...
The phonon dispersion in the high-symmetry directions of the first Brillouin zone of the MoO3 monolayer is plotted in Figure 1c. There is no imaginary frequency, ensuring the stability of the MoO3 monolayer. It is well known that the acoustical phonon branches possess large group velocities and mainly determine the thermal conductivity of the lattice [32]. As the dashed lines emphasize in Figure 1c, the acoustic phonon group velocity along the Γ–Y direction is larger than that along the Γ–X direction, which is an indication of anisotropic phonon transport. The thermal conductivity of the lattice, κph, along different directions as a function of temperature is depicted in Figure 1d. It is obvious that the thermal transport properties of the MoO3 monolayer show an anisotropic behavior, where the thermal conductivity of the lattice along the x-axis is higher than that along the y-axis. At room temperature, κph is 5.38 and 3.07 W·mK−1 along the x- and y-direction, respectively. As a result of the intrinsic enhancement of the phonon–phonon scattering with temperature, the thermal conductivity of the lattice of the MoO3 monolayer decreases gradually with increasing temperature following a 1/T dependence like most crystalline materials.
In Figure 2a–c, we demonstrate the electrical transport properties of the MoO3 monolayer as a function of the carrier concentration at three typical temperatures (T = 300, 500 and 700 K). Note that the n-type and p-type transport properties of MoO3 monolayer are uniform. Therefore, only p-type cases are shown here. As shown in Figure 2a, the Seebeck coefficient S of the MoO3 monolayer has the same value along the x- and y-directions. While the temperature increases from 300 to 700 K, the Seebeck coefficient of the MoO3 monolayer decreases gradually according to the relation: S ~ (1/n)2/3[3]. The maximum value of S calculated for the MoO3 monolayer is 1.69 mV·K−1 at room temperature. Such a large S value can be explained by the proportionality of the Seebeck coefficient to the bandgap [33]. Unlike the Seebeck coefficient, the electrical and thermal conductivities exhibit a clear anisotropic behavior which is attributed to the anisotropic relaxation time [17]. Figure 2b reveals that the electrical conductivity along the x-axis is obviously much higher than along the y-axis. For example, we compute σ = 8268 S/m along the x-axis, while only σ = 338 S/m along the y-axis at room temperature and n = 1013 cm−2. The thermal conductivity of the MoO3 monolayer also exhibits an evident anisotropic behavior and increases gradually with temperature, as shown in Figure 2c. Particularly, κe = 1.29 and 0.032 W·mK−1 along the x- and y-axis at room temperature and n = 1013 cm−2. By combining the phononic and electrical transport properties presented above, we can obtain the ZT value of the MoO3 monolayer as a function of the carrier concentration, as presented in Figure 2d. It is found that the ZT value is much higher along the x-axis than along the y-axis. The maximum ZT value along the x-axis reaches 0.84 at 700 K which is nearly four times larger than the corresponding value along the y-axis. The carrier concentration needed to attain the maximum ZT value in the n-type MoO3 monolayer is about 1.16 × 1013 cm−2 (x-axis) and 6.67 × 1013 cm−2 (y-axis).
Figure 2:
Transport and thermoelectric properties of the MoO3 monolayer. (a) Seebeck coefficient, S, (b) electrical conductivity, σ, (c) electrical conductivity, κe, and (d) ZT values as a function of the carrier concentration.
Figure 2:
Transport and thermoelectric properties of the MoO3 monolayer. (a) Seebeck coefficient, S, (b) elec...
In order to improve the thermoelectric performance of the MoO3 monolayer, we decided to introduce an O vacancy. Therefore, we remove one O atom from the 3 × 3 × 1 supercell (72 atoms) to construct a neutral defect, such that the stoichiometric proportion is MoO2.94. Since there are three types of O atoms in the primitive cell, we named the three defective structures VO1, VO2 and VO3. Further details of the defect structures are presented in Supporting Information File 1. The formation energy, Ef, of a neutral defect is defined as: Ef = Etot(defect) − Etot(supercell) + ½ Etot(O2), where Etot(defect) is the total energy of the supercell containing the defect, Etot(supercell) is the total energy of the perfect supercell and Etot(O2) is the total energy of the oxygen molecules. Then we calculate the formation energies and band gaps of these defect structures. The absolute Ef values are 2.074 eV (VO1), 2.076 eV (VO2) and 4.108 eV (VO3) while the band gaps are 0.837 eV (VO1), 0.797 eV (VO2) and 0.831 eV (VO3). In contrast to the bulk MoO3, the three defective structures finally lead to only two stable structures after relaxation which is attributed to the absence of interlayer van der Waals forces.
It is difficult to calculate the thermal conductivity of the lattice and electrical relaxation time of a 71 atom primitive cell employing Boltzmann transport theory. Therefore, we assume that the thermal conductivity of the lattice and electrical relaxation time remain unchanged. In fact, O vacancies can result in the reduction of the thermal conductivity of the lattice due to anisotropic phonon scattering at the vacancies and the final ZT values will be higher. The structures exhibit strong Mo–O3–Mo chains along the x-axis and Mo–O2–Mo chains along the y-axis. The anisotropic thermal conductivity of the vacancy-induced MoO3 monolayer can be modified by controlling the O vacancy [34]. For instance, the O3 vacancy mainly disrupts the Mo–O3–Mo chain and reduces the phonon transport along the x-axis, which will result in a lower thermal conductivity of the lattice along the x-axis than along the y-axis. For briefness and clarity, we display the maximum ZT values in Figure 3a and Figure 3b. Note that when vacancies are induced, the ZT values along the x-axis increase immediately, especially in the low-temperature region. However, the behavior in the y-direction is considerably different. In Figure 3b, the ZT values along the y-axis are obviously higher for VO3 than in the other two cases at usual working temperatures of 300–600 K. The conclusion is that inducing the O vacancy at the O3 position (VO3) yields the largest enhancement of the thermoelectric properties of the MoO3 monolayer. The maximum ZT values along the x- and the y-axis are 0.83 and 0.12, respectively, at room temperature. This indicates that the defective MoO3 monolayer is indeed a promising candidate for good thermoelectric materials. We take the results at room temperature as an example and calculate the growth ratio of the Seebeck coefficient and the electrical conductivity along the x- and the y-axis in Figure 3c. It is found that the Seebeck coefficient and the electrical conductivity along the x-axis increase simultaneously, which results in higher ZT values, as shown in Figure 3a. However, the results are very different concerning the y-direction. The electrical conductivity along the y-axis increases faster than that along the x-axis. This leads also to a much lower Seebeck coefficient. As a consequence, the ZT values along the y-axis are not satisfactory compared with the corresponding values along the x-axis.
Figure 3:
The maximum ZT values as a function of temperature along (a) the x-axis and (b) the y-axis. (c) The growth ratio of the Seebeck coefficient and the electrical conductivity along the x-axis and the y-axis at room temperature.
Figure 3:
The maximum ZT values as a function of temperature along (a) the x-axis and (b) the y-axis. (c) The...
To give a clear reason for the strengthening of the thermoelectric properties, we show the electronic DOS of these structures in Figure 4. Upon the introduction of the O vacancy, the Fermi level moves closer to the conduction band and an asymmetric sharp peak occurs around the bottom of the conduction band, as highlighted in Figure 4a. The sharp peak in the DOS mainly comes from the Mo atom indicated by the projected DOS of Mo and O atoms presented in Figure 4b and Figure 4c. Additionally, the values for VO1 and VO2 are almost the same, which means that they lead to the same structure. The structural dependency of the defective MoO3 monolayer is reflected in the insets of Figure 4b and Figure 4c. Previous theoretical studies show that a narrow and sharp peak in the electronic DOS around the Fermi level will generate a large transport distribution function and maximize the power by a factor of S2σ [24,35]. Especially for VO3, the sharp peak is more clear than for the other structures, yielding the best thermoelectric performance. Finally, O vacancies can act as shallow donors and destroy the crystal symmetry, thereby enlarging the carrier concentration.
Figure 4:
Calculated (a) total electronic density of states (DOS) and projected DOS for (b) Mo and (c) O atoms of the MoO3 monolayer. The insets of (b) and (c) show the total charge density from different views.
Figure 4:
Calculated (a) total electronic density of states (DOS) and projected DOS for (b) Mo and (c) O atom...
In summary, we have presented a comprehensive study of the thermoelectric properties of the MoO3 monolayer by first-principles calculations and Boltzmann transport theory. Our results indicate that the MoO3 monolayer exhibits better thermoelectric performance along the x-axis than along the y-axis because of the strong anisotropic behavior of both the electrical and thermal conductivity. The ZT value along the x-axis reaches 0.72 at 300 K, which is much higher than the values obtained for other oxides. On the other hand, we find that the introduction of O vacancies is an efficient way to improve the thermoelectric performance of the MoO3 monolayer. Such an improvement can be attributed to a sharp peak in the electronic DOS, which leads to a large transport distribution function. The monolayer structure with the O vacancy at the O3 position possesses a maximum room temperature ZT value of 0.84 (x-axis) and 0.12 (y-axis). This work should provide helpful theoretical guidance that is relevant for possible thermoelectric applications of two-dimensional TMOs.
Supporting Information
Supporting Information File 1:
Crystal structures of MoO3 with oxygen vacancies.
This work was financially supported by the National Natural Science Foundation of China (grant nos. 11874291, 11774271 and 11474273).
References
Zebarjadi, M.; Esfarjani, K.; Dresselhaus, M. S.; Ren, Z. F.; Chen, G. Energy Environ. Sci.2012,5, 5147–5162. doi:10.1039/c1ee02497c
Return to citation in text:
[1]
Yuan, C.; Wu, H. B.; Xie, Y.; Lou, X. W. D. Angew. Chem., Int. Ed.2014,53, 1488–1504. doi:10.1002/anie.201303971
Return to citation in text:
[1]
Walia, S.; Balendhran, S.; Nili, H.; Zhuiykov, S.; Rosengarten, G.; Wang, Q. H.; Bhaskaran, M.; Sriram, S.; Strano, M. S.; Kalantar-zadeh, K. Prog. Mater. Sci.2013,58, 1443–1489. doi:10.1016/j.pmatsci.2013.06.003
Return to citation in text:
[1]
Brezesinski, T.; Wang, J.; Tolbert, S. H.; Dunn, B. Nat. Mater.2010,9, 146–151. doi:10.1038/nmat2612
Return to citation in text:
[1]
Mai, L. Q.; Hu, B.; Chen, W.; Qi, Y. Y.; Lao, C. S.; Yang, R. S.; Dai, Y.; Wang, Z. L. Adv. Mater. (Weinheim, Ger.)2007,19, 3712–3716. doi:10.1002/adma.200700883
Return to citation in text:
[1]
Chen, J. S.; Cheah, Y. L.; Madhavi, S.; Lou, X. W. J. Phys. Chem. C2010,114, 8675–8678. doi:10.1021/jp1017482
Return to citation in text:
[1]
Wang, Z.; Madhavi, S.; Lou, X. W. (David). J. Phys. Chem. C2012,116, 12508–12513. doi:10.1021/jp304216z
Return to citation in text:
[1]
Li, T.; Beidaghi, M.; Xiao, X.; Huang, L.; Hu, Z.; Sun, W.; Chen, X.; Gogotsi, Y.; Zhou, J. Nano Energy2016,26, 100–107. doi:10.1016/j.nanoen.2016.05.004
Return to citation in text:
[1]
Balendhran, S.; Deng, J.; Ou, J. Z.; Walia, S.; Scott, J.; Tang, J.; Wang, K. L.; Field, M. R.; Russo, S.; Zhuiykov, S.; Strano, M. S.; Medhekar, N.; Sriram, S.; Bhaskaran, M.; Kalantar-zadeh, K. Adv. Mater. (Weinheim, Ger.)2013,25, 109–114. doi:10.1002/adma.201203346
Return to citation in text:
[1]
[2]
Alsaif, M. M. Y. A.; Chrimes, A. F.; Daeneke, T.; Balendhran, S.; Bellisario, D. O.; Son, Y.; Field, M. R.; Zhang, W.; Nili, H.; Nguyen, E. P.; Latham, K.; van Embden, J.; Strano, M. S.; Ou, J. Z.; Kalantar-zadeh, K. Adv. Funct. Mater.2016,26, 91–100. doi:10.1002/adfm.201503698
Return to citation in text:
[1]
[2]
Dresselhaus, M. S.; Chen, G.; Tang, M. Y.; Yang, R. G.; Lee, H.; Wang, D. Z.; Ren, Z. F.; Fleurial, J.-P.; Gogna, P. Adv. Mater. (Weinheim, Ger.)2007,19, 1043–1053. doi:10.1002/adma.200600527
Return to citation in text:
[1]
Balendhran, S.; Walia, S.; Alsaif, M.; Nguyen, E. P.; Ou, J. Z.; Zhuiykov, S.; Sriram, S.; Bhaskaran, M.; Kalantar-zadeh, K. ACS Nano2013,7, 9753–9760. doi:10.1021/nn403241f
Return to citation in text:
[1]
Kalantar-zadeh, K.; Tang, J.; Wang, M.; Wang, K. L.; Shailos, A.; Galatsis, K.; Kojima, R.; Strong, V.; Lech, A.; Wlodarski, W.; Kaner, R. B. Nanoscale2010,2, 429–433. doi:10.1039/b9nr00320g
Return to citation in text:
[1]
Zhang, W.-B.; Qu, Q.; Lai, K. ACS Appl. Mater. Interfaces2017,9, 1702–1709. doi:10.1021/acsami.6b14255
Return to citation in text:
[1]
[2]
[3]
[4]
Kresse, G.; Furthmüller, J. Phys. Rev. B1996,54, 11169–11186. doi:10.1103/physrevb.54.11169
Return to citation in text:
[1]
Perdew, J. P.; Burke, K.; Ernzerhof, M. Phys. Rev. Lett.1996,77, 3865–3868. doi:10.1103/physrevlett.77.3865
Return to citation in text:
[1]
Heyd, J.; Scuseria, G. E.; Ernzerhof, M. J. Chem. Phys.2003,118, 8207–8215. doi:10.1063/1.1564060
Return to citation in text:
[1]
Krukau, A. V.; Vydrov, O. A.; Izmaylov, A. F.; Scuseria, G. E. J. Chem. Phys.2006,125, 224106. doi:10.1063/1.2404663
Return to citation in text:
[1]
Madsen, G. K. H.; Singh, D. J. Comput. Phys. Commun.2006,175, 67–71. doi:10.1016/j.cpc.2006.03.007
Return to citation in text:
[1]
Mahan, G. D.; Sofo, J. O. Proc. Natl. Acad. Sci. U. S. A.1996,93, 7436–7439. doi:10.1073/pnas.93.15.7436
Return to citation in text:
[1]
[2]
Bardeen, J.; Shockley, W. Phys. Rev.1950,80, 72–80. doi:10.1103/physrev.80.72
Return to citation in text:
[1]
Giannozzi, P.; Andreussi, O.; Brumme, T.; Bunau, O.; Buongiorno Nardelli, M.; Calandra, M.; Car, R.; Cavazzoni, C.; Ceresoli, D.; Cococcioni, M.; Colonna, N.; Carnimeo, I.; Dal Corso, A.; de Gironcoli, S.; Delugas, P.; DiStasio, R. A., Jr.; Ferretti, A.; Floris, A.; Fratesi, G.; Fugallo, G.; Gebauer, R.; Gerstmann, U.; Giustino, F.; Gorni, T.; Jia, J.; Kawamura, M.; Ko, H.-Y.; Kokalj, A.; Küçükbenli, E.; Lazzeri, M.; Marsili, M.; Marzari, N.; Mauri, F.; Nguyen, N. L.; Nguyen, H.-V.; Otero-de-la-Roza, A.; Paulatto, L.; Poncé, S.; Rocca, D.; Sabatini, R.; Santra, B.; Schlipf, M.; Seitsonen, A. P.; Smogunov, A.; Timrov, I.; Thonhauser, T.; Umari, P.; Vast, N.; Wu, X.; Baroni, S. J. Phys.: Condens. Matter2017,29, 465901. doi:10.1088/1361-648x/aa8f79
Return to citation in text:
[1]
Giannozzi, P.; Baroni, S.; Bonini, N.; Calandra, M.; Car, R.; Cavazzoni, C.; Ceresoli, D.; Chiarotti, G. L.; Cococcioni, M.; Dabo, I.; Dal Corso, A.; de Gironcoli, S.; Fabris, S.; Fratesi, G.; Gebauer, R.; Gerstmann, U.; Gougoussis, C.; Kokalj, A.; Lazzeri, M.; Martin-Samos, L.; Marzari, N.; Mauri, F.; Mazzarello, R.; Paolini, S.; Pasquarello, A.; Paulatto, L.; Sbraccia, C.; Scandolo, S.; Sclauzero, G.; Seitsonen, A. P.; Smogunov, A.; Umari, P.; Wentzcovitch, R. M. J. Phys.: Condens. Matter2009,21, 395502. doi:10.1088/0953-8984/21/39/395502
Return to citation in text:
[1]
Li, W.; Carrete, J.; A. Katcho, N.; Mingo, N. Comput. Phys. Commun.2014,185, 1747–1758. doi:10.1016/j.cpc.2014.02.015
Return to citation in text:
[1]
[2]
Prandini, G.; Marrazzo, A.; Castelli, I. E.; Mounet, N.; Marzari, N. npj Comput. Mater.2018,4, 72. doi:10.1038/s41524-018-0127-2
Return to citation in text:
[1]
Sitepu, H. Powder Diffr.2009,24, 315–326. doi:10.1154/1.3257906
Return to citation in text:
[1]
Li, F.; Chen, Z. Nanoscale2013,5, 5321. doi:10.1039/c3nr33009e
Return to citation in text:
[1]
Pichanusakorn, P.; Bandaru, P. Mater. Sci. Eng., R2010,67, 19–63. doi:10.1016/j.mser.2009.10.001
Return to citation in text:
[1]
Hung, N. T.; Nugraha, A. R. T.; Hasdeo, E. H.; Dresselhaus, M. S.; Saito, R. Phys. Rev. B2015,92, 165426. doi:10.1103/physrevb.92.165426
Return to citation in text:
[1]
Ji, H. S.; Kim, H.; Lee, C.; Rhyee, J.-S.; Kim, M. H.; Kaviany, M.; Shim, J. H. Phys. Rev. B2013,87, 125111. doi:10.1103/physrevb.87.125111
Return to citation in text:
[1]
Kerdsongpanya, S.; Alling, B.; Eklund, P. Phys. Rev. B2012,86, 195140. doi:10.1103/physrevb.86.195140
Return to citation in text:
[1]
Reference 33
33.
Hung, N. T.; Nugraha, A. R. T.; Hasdeo, E. H.; Dresselhaus, M. S.; Saito, R. Phys. Rev. B2015,92, 165426. doi:10.1103/physrevb.92.165426
Alsaif, M. M. Y. A.; Chrimes, A. F.; Daeneke, T.; Balendhran, S.; Bellisario, D. O.; Son, Y.; Field, M. R.; Zhang, W.; Nili, H.; Nguyen, E. P.; Latham, K.; van Embden, J.; Strano, M. S.; Ou, J. Z.; Kalantar-zadeh, K. Adv. Funct. Mater.2016,26, 91–100. doi:10.1002/adfm.201503698
Balendhran, S.; Deng, J.; Ou, J. Z.; Walia, S.; Scott, J.; Tang, J.; Wang, K. L.; Field, M. R.; Russo, S.; Zhuiykov, S.; Strano, M. S.; Medhekar, N.; Sriram, S.; Bhaskaran, M.; Kalantar-zadeh, K. Adv. Mater. (Weinheim, Ger.)2013,25, 109–114. doi:10.1002/adma.201203346
13.
Alsaif, M. M. Y. A.; Chrimes, A. F.; Daeneke, T.; Balendhran, S.; Bellisario, D. O.; Son, Y.; Field, M. R.; Zhang, W.; Nili, H.; Nguyen, E. P.; Latham, K.; van Embden, J.; Strano, M. S.; Ou, J. Z.; Kalantar-zadeh, K. Adv. Funct. Mater.2016,26, 91–100. doi:10.1002/adfm.201503698
15.
Balendhran, S.; Walia, S.; Alsaif, M.; Nguyen, E. P.; Ou, J. Z.; Zhuiykov, S.; Sriram, S.; Bhaskaran, M.; Kalantar-zadeh, K. ACS Nano2013,7, 9753–9760. doi:10.1021/nn403241f
16.
Kalantar-zadeh, K.; Tang, J.; Wang, M.; Wang, K. L.; Shailos, A.; Galatsis, K.; Kojima, R.; Strong, V.; Lech, A.; Wlodarski, W.; Kaner, R. B. Nanoscale2010,2, 429–433. doi:10.1039/b9nr00320g
Mai, L. Q.; Hu, B.; Chen, W.; Qi, Y. Y.; Lao, C. S.; Yang, R. S.; Dai, Y.; Wang, Z. L. Adv. Mater. (Weinheim, Ger.)2007,19, 3712–3716. doi:10.1002/adma.200700883
9.
Chen, J. S.; Cheah, Y. L.; Madhavi, S.; Lou, X. W. J. Phys. Chem. C2010,114, 8675–8678. doi:10.1021/jp1017482
10.
Wang, Z.; Madhavi, S.; Lou, X. W. (David). J. Phys. Chem. C2012,116, 12508–12513. doi:10.1021/jp304216z
Dresselhaus, M. S.; Chen, G.; Tang, M. Y.; Yang, R. G.; Lee, H.; Wang, D. Z.; Ren, Z. F.; Fleurial, J.-P.; Gogna, P. Adv. Mater. (Weinheim, Ger.)2007,19, 1043–1053. doi:10.1002/adma.200600527


![[2190-4286-10-199-i1]](/bjnano/content/inline/2190-4286-10-199-i1.svg?max-width=590&scale=1.18182)
![[2190-4286-10-199-i2]](/bjnano/content/inline/2190-4286-10-199-i2.svg?max-width=590&scale=1.18182)
![[2190-4286-10-199-i3]](/bjnano/content/inline/2190-4286-10-199-i3.svg?max-width=590&scale=1.18182)
![[2190-4286-10-199-i4]](/bjnano/content/inline/2190-4286-10-199-i4.svg?max-width=590&scale=1.18182)
![[Graphic 1]](/bjnano/content/inline/2190-4286-10-199-i5.svg?max-width=637&scale=1.18182) is the group velocity of the carriers and
is the group velocity of the carriers and ![[Graphic 2]](/bjnano/content/inline/2190-4286-10-199-i6.svg?max-width=637&scale=1.18182) is the relaxation time. The thermal conductivity κe is obtained by the Wiedemann–Franz law: κe = LσT, where L is the Lorenz number. For the calculation of the relaxation time τ, we apply the deformation potential (DP) theory [25] where τ is estimated by τ = μm*/e. The carrier mobility μ2D in 2D materials is given by
is the relaxation time. The thermal conductivity κe is obtained by the Wiedemann–Franz law: κe = LσT, where L is the Lorenz number. For the calculation of the relaxation time τ, we apply the deformation potential (DP) theory [25] where τ is estimated by τ = μm*/e. The carrier mobility μ2D in 2D materials is given by![[Graphic 3]](/bjnano/content/inline/2190-4286-10-199-i7.svg?max-width=637&scale=1.18182)
![[Graphic 4]](/bjnano/content/inline/2190-4286-10-199-i8.svg?max-width=637&scale=1.18182)
![[2190-4286-10-199-1]](/bjnano/content/figures/2190-4286-10-199-1.png?scale=2.0&max-width=1024&background=FFFFFF)
![[2190-4286-10-199-2]](/bjnano/content/figures/2190-4286-10-199-2.png?scale=2.0&max-width=1024&background=FFFFFF)
![[2190-4286-10-199-3]](/bjnano/content/figures/2190-4286-10-199-3.png?scale=2.0&max-width=1024&background=FFFFFF)
![[2190-4286-10-199-4]](/bjnano/content/figures/2190-4286-10-199-4.png?scale=2.0&max-width=1024&background=FFFFFF)