1Institut für Chemie und Biochemie, Physikalische und Theoretische Chemie, Freie Universität Berlin, Takustraße 3, D-14195 Berlin, Germany
2Department of Biology & CESAM, University of Aveiro, 3810-193 Aveiro, Portugal
3Hochschule Darmstadt - University of Applied Sciences, Fachbereich Chemie- und Biotechnologie, Stephanstr. 7, D-64295 Darmstadt, Germany
Corresponding author email
Associate Editor: J. J. Schneider Beilstein J. Nanotechnol.2021,12, 35–48.https://doi.org/10.3762/bjnano.12.3 Received 03 Sep 2020,
Accepted 03 Dec 2020,
Published 08 Jan 2021
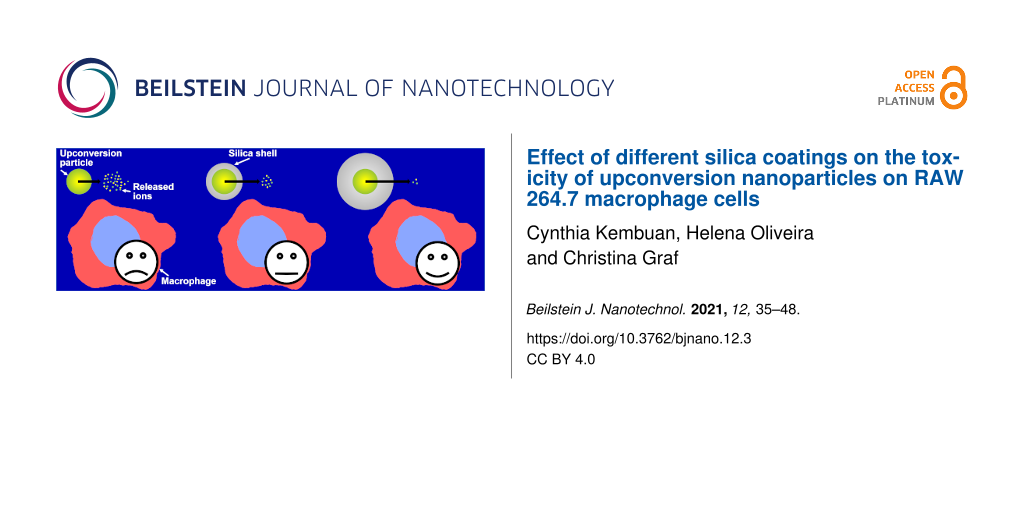
Upconversion nanoparticles (UCNPs), consisting of NaYF4 doped with 18% Yb and 2% Er, were coated with microporous silica shells with thickness values of 7 ± 2 and 21 ± 3 nm. Subsequently, the negatively charged particles were functionalized with N-(6-aminohexyl)-3-aminopropyltrimethoxysilane (AHAPS), which provide a positive charge to the nanoparticle surface. Inductively coupled plasma optical emission spectrometry (ICP-OES) measurements revealed that, over the course of 24h, particles with thicker shells release fewer lanthanide ions than particles with thinner shells. However, even a 21 ± 3 nm thick silica layer does not entirely block the disintegration process of the UCNPs. 3-(4,5-dimethylthiazol-2-yl)-2,5-diphenyltetrazolium bromide (MTT) assays and cell cytometry measurements performed on macrophages (RAW 264.7 cells) indicate that cells treated with amino-functionalized particles with a thicker silica shell have a higher viability than those incubated with UCNPs with a thinner silica shell, even if more particles with a thicker shell are taken up. This effect is less significant for negatively charged particles. Cell cycle analyses with amino-functionalized particles also confirm that thicker silica shells reduce cytotoxicity. Thus, growing silica shells to a sufficient thickness is a simple approach to minimize the cytotoxicity of UCNPs.
Upconversion nanoparticles (UCNPs) convert excitation radiation with long wavelengths to a short-wavelength emission. Since biological molecules do not have an upconversion mechanism, imaging with UCNPs avoids autofluorescence. Besides, UCNPs have further advantages for applications in life science, such as deep penetration depth, minimal photodamage, and high resistance to photobleaching [1-9]. Moreover, high thermal and photochemical stability, as well as high chemical inertness and relatively low toxicity are also claimed advantages [7,10,11]. Due to these unique features, UCNPs have already been used in medical and biological applications, such as multimodal bioimaging, drug delivery, photodynamic therapy, and biosensing [9,12-17].
However, UCNPs in aqueous dispersions undergo minor disintegration, which also results in the quenching of their luminescence intensity [8,10,18-23]. This concentration-dependent effect is especially significant when the dispersions are highly diluted [8,19,22], when the pH value is low [22], or when ions forming lanthanide salts with a low solubility (such as phosphates) are present [10,20,24], which is relevant for their application in physiological solutions. The cytotoxicity of F− ions is in the range of a few millimoles per liter [25,26]. The release of F− ions can induce oxidative stress and cause apoptosis. In addition, intracellular redox homeostasis and gene expression can be modulated [26]. Lanthanide ions are usually not reported as highly toxic. However, they can interact with proteins, enzymes, and other biomolecules [27,28] and might also cause oxidative damage or lipid peroxidation [29].
When UCNPs are applied in life sciences, it is usually necessary to modify their surfaces with hydrophilic ligands or layers [21,30,31]. These coatings can also prevent, to some extent, the interaction between UCNPs and the aqueous environment and, consequently, reduce their disintegration processes. Several authors have reported the use of protective coatings, such as poly(acrylic acid) and poly(allylamine hydrochloride) [18], multichelating phosphonate [30,32,33], block copolymers [34], amphiphilic polymers [8,21], or polysulfonates [22]. Silica shells can also be used to protect UCNPs surfaces from dissolution. In contrast to a more complex polymeric coating, silica surfaces can be easily functionalized with a wide range of coupling agents and biomolecules, and the interior of the silica shell can be modified by integrating dye molecules, for example. However, amorphous silica is a porous material. A typical Stöber silica has a pore size of around 1–4 nm [35,36]; therefore, a thin silica coating shell cannot completely inhibit the dissolution of UCNPs [37]. The thickness of silica shells on UCNPs can be easily adjusted over a wide range [38]. Lathinen et al. have shown that even a thin silica coating shell of <2 nm or of 5 nm can already reduce the luminescence quenching of UCNPs in an aqueous dispersion [19]. Besides, several studies revealed that silica-coated UCNPs have a low toxicity in vitro and in vivo compared with other nanoparticles [7,11,39]. Amorphous silica is highly stable over a broad pH range. Thus, it is expected that it protects UCNP cores [40] even if the pH is reduced to values of approx. 4.5–5 in lysosomes during cellular uptake processes [41].
In the present work, the cytotoxicity of UCNP cores coated with silica shells was investigated in the macrophage cell line RAW 264.7. RAW 264.7 cells are particularly sensitive to the treatment with nanoparticles [42-44]. They are an established model of activated macrophages and they actively take up nanomaterials from biological media. This way, RAW264.7 cells mimic the behavior of macrophages and other immune cells, which eliminate foreign substances from the organism. Moreover, they have already been applied in studies involving uncoated NaGdF4[42] and silica particles [43-46].
Upconversion cores consisting of NaYF4 doped with 18% Yb and 2% Er were synthesized. Microporous silica shells with two different thickness values were grown onto these cores to enable the investigation of a possible relation between the degree of cytotoxicity, particle size, and silica shell thickness. The particles were subsequently functionalized with N-(6-aminohexyl)-3-aminopropyltrimethoxysilane (AHAPS), which provides the nanoparticle surface with a positive charge, increasing their interaction with the cell membrane. The particles were characterized by scanning transmission electron microscopy (STEM), dynamic light scattering (DLS), electrophoretic light scattering (ELS), and inductively coupled plasma optical emission spectrometry (ICP-OES). Before the cell experiments, the stability of the particles in cell culture media was investigated via DLS and ELS. The cytotoxicity of the UCNPs was determined by MTT assays and cell cycle analysis. The UCNP uptake potential was evaluated by flow cytometry through the measurement of side-scattered light, which is proportional to changes in cell granularity or to the internal complexity.
Results and Discussion
Preparation and characterization of upconversion nanoparticles
Oleate-functionalized NaYF4:Yb,Er nanocrystals were prepared by a thermal decomposition method [47], yielding spherical particles with a low polydispersity (Figure 1A, STEM diameter (dSTEM) = 33 ± 2 nm). The hydrodynamic diameter (Z-average) was 47 ± 1 nm (polydispersity index, PDI = 0.38 ± 0.05). ICP-OES measurements yielded a percentual molar ratio of Y/Yb/Er = [74 ± 1]:[25 ± 1]:[2 ± 0.5]. The XRD diffractogram shows a predominantly hexagonal crystal structure (JCPDS No. 00-028-1192), which is typical for such UCNPs (Supporting Information File 1, Figure S1) [47]. The core was coated with two different silica layers: 7 ± 1 nm for the thin-shelled silica layer and 21 ± 2 nm for the thick-shelled silica layer (samples UC@thin, Figure 1B, and UC@thick, Figure 1C, respectively). A thicker silica shell protects the UCNP core more efficiently than a thinner silica shell by reducing the diffusion of water molecules to the UCNPs and also by reducing a possible leakage of ions from the core. The UC emission spectrum shows the typical green and red Er3+ emission bands of Er- and Yb-doped NaYF4 NP (Supporting Information File 1, Figure S2) [48-50]. The shape of the UC luminescence spectra is not influenced by the thickness of the silica coating, as reported in our previous work [38]. Additionally, UC@thin and UC@thick samples were surface-functionalized with N-(6-aminohexyl)-3-aminopropyltrimethoxysilane (AHAPS) (samples UC@thin_NH2 and UC@thick_NH2). AHAPS was chosen as a surface ligand due to its ability to provide the particles with a positive surface charge [51]. Positively charged silica particles interact more efficiently with the negatively charged cell membrane than negatively charged particles [45], which can also cause an enhanced uptake [51,52]. This process is supported by the fact that the hydrodynamic diameter of the AHAPS-functionalized particles is small enough for the particles to be internalized via the endocytic uptake [51]. (3-Aminopropyl)trimethoxysilane (APS) was not chosen as the amine ligand due to the increased aggregation of APS-functionalized particles in the cell culture medium [51].
In addition, particles with a modified silica shell were prepared such that the coupling product of rhodamine B isothiocyanate and APS (RBITC-APS) was coupled into the silica shell. Samples with two different thickness values were prepared: 9 ± 2 nm for the thin-shelled samples (sample UC@thin_RBITC_NH2) and 22 ± 2 nm for the thick-shelled samples (sample UC@thick_RBITC_NH2). The silica shells of the dye-doped samples were slightly thicker than those of the samples without the dye, as APS and RBITC-APS slightly increase the porosity of the silica shell. Consequently, identical amounts of silica per particle result in slightly thicker shells. As a reference system, pure silica nanoparticles with a size of 50 nm were also coupled with RBITC and functionalized with AHAPS (sample SiO2 @RBITC_NH2). STEM images of each sample are shown in Supporting Information File 1, Figure S3. The STEM data of all the particles is summarized in Table 1.
Table 1:
STEM diameter, silica shell thickness as well as hydrodynamic diameter (Z-average, Z-ave), polydispersity index, and zeta potential (ZP) values of silica-coated UCNPs in EtOH, water, and in supplemented DMEM complete medium.
Samples
dSTEM [nm]
tSiO2 [nm]
EtOH
Water
DMEM
Z-ave [nm]
ZP [mV]
PDI
Z-ave [nm]
ZP [mV]
PDI
Z-ave [nm]
PDI
UC@thin_NH2
48 ± 2
8 ± 2
105 ± 1
34 ± 1
0.099 ± 0.005
128 ± 5
26 ± 2
0.118 ± 0.004
318 ± 13
0.720 ± 0.045
UC@thick_NH2
75 ± 2
21 ± 2
145 ± 1
37 ± 2
0.177 ± 0.015
295 ± 2
29 ± 1
0.258 ± 0.028
220 ± 2
0.460 ± 0.010
UC@thin_RBITC_NH2
50 ± 2
9 ± 2
127 ± 1
30 ± 2
0.117 ± 0.014
138 ± 2
26 ± 1
0.172 ± 0.028
97 ± 8
0.575 ± 0.098
UC@thick_RBITC_NH2
76 ± 3
22 ± 2
118 ± 1
27 ± 2
0.065 ± 0.009
139 ± 2
19 ± 1
0.161 ± 0.023
144 ± 2
0.367 ± 0.049
UC@thin
47 ± 2
7 ± 2
80 ± 2
24 ± 1
0.112 ± 0.004
104 ± 1
31 ± 2
0.203 ± 0.006
93 ± 1
0.460 ± 0.004
UC@thick
75 ± 3
21 ± 3
98 ± 2
21 ± 1
0.037 ± 0.006
142 ± 1
29 ± 1
0.098 ± 0.014
125 ± 3
0.159 ± 0.011
SiO2@RBITC_NH2
52 ± 3
—
98 ± 1
16 ± 1
0.100 ± 0.010
103 ± 2
10 ± 1
0.100 ± 0.010
208 ± 5
—
The dispersion behavior and changes in the surface charge of the samples in various media (ethanol, water, and Dulbecco's Modified Eagle Medium (DMEM) supplemented with 10% fetal bovine serum (FBS), 1% glutamine, 1% fungizone, and 1% penicillin) were studied by conducting DLS and ELS measurements. The DLS and ZP results are also shown in Table 1.
The zeta potential changed from negative to positive after AHAPS functionalization due to the positive surface charge of the amine group in the AHAPS ligand. The zeta potential values of the AHAPS-functionalized samples slightly decreased after transfer from ethanol to water, as reported in several publications [51,52], and, consequently, their hydrodynamic diameter values increased. The zeta potential of the non-functionalized particles is more negative in water than in ethanol, and, in this case, the Z-average value also increases.
The Z-average values of the samples after redispersion in DMEM were lower than in water, except for the samples UC@thin_NH2, UC@thick_RBITC_NH2, and SiO2@RBITC_NH2. The lower Z-average values of these samples may indicate an increased stabilization by a protein corona [52-56]. However, the high ionic strength of the cell culture medium (I = 168 mmol/L) reduces the electrostatic stabilization. Besides, the proteins in the DMEM cell culture medium supplemented with 10% FBS contribute to the measured hydrodynamic diameter values [51]. FBS consists mostly of bovine serum albumin. The Z-average value of the supplemented DMEM used in this study (without particles) was 13 ± 1 nm, and the corresponding PDI was 0.380 ± 0.003. This causes an additional reduction of the hydrodynamic diameter compared to water, which also explains the large PDI of the samples.
Izak-Nau et al. investigated the aggregation of silica nanoparticles that occurred after redispersion in buffered solution and in physiological medium [54]. They reported that various proteins in a medium containing FBS were adsorbed onto the surface of bare SiO2 and amine-functionalized SiO2 nanoparticles, forming a protein corona with a new surface charge, which depended on the type of proteins that built the corona. The adsorbed protein corona, consisting of the proteins present in FBS, could increase or reduce the stability of the particles and, consequently, their hydrodynamic diameter [53-57]. The non-functionalized samples, which have a negative surface charge due to the presence of silanol groups on the surface, were more stable in the cell culture medium than the amino-functionalized particles, which is in line with previous findings [51,54]. The adsorption of a protein corona makes the surface charge of the nanoparticles more negative; hence, it reduces the stability of positively charged particles [52,58,59]. Although the particles in this work showed increased aggregation in DMEM, they can still be taken up by macrophages, such as RAW 264.7 cells [45]. This is also indicated by the different cytotoxicity degrees of the samples in RAW 264.7 cells (the cytotoxicity of the samples was dose-dependent) and by the flow cytometry results (see below).
Ion release experiments
For the investigation of released lanthanide ions, UC@thin_NH2 and UC@thick_NH2, as representative samples of thin- and thick-shelled samples, were redispersed in water.
For a better comparison with the results obtained from cell culture experiments (see below), samples with 200 μg/mL of silica-coated UCNPs or with 200 μg/mL of uncoated UCNP cores were prepared, allowed to stand for 24 h, and centrifuged with centrifuge tubes containing a filter unit (pore size: 3000 NWCO) to separate the UCNPs from possibly released ions. A concentration of 200 μg/mL was chosen, since this was the highest concentration used in the cytotoxicity experiments. Hence, the concentration of released ions is representative of the maximum concentration of released ions, which should correlate with the cytotoxicity results. The filtrates were measured by ICP-OES regarding their content of Y3+, Yb3+, and Er3+. Additionally, a certain amount of the three corresponding lanthanide chlorides was dissolved in water to yield lanthanide ion concentration values of 1.0 ± 0.1 and 2.0 ± 0.1 ppm. These solutions were, then, centrifuged with centrifuge tubes containing a filter unit. The filtrate was measured via ICP-OES to determine the percentage of ions filtered through the centrifuge tube filter.
Similar preliminary tests were also performed with UCNPs and lanthanide chlorides in DMEM. However, only Er3+ could be detected, with a high measurement uncertainty, in the filtrate of lanthanide chloride solutions. Lanthanide ions are known to bind to phosphate in phosphate-buffered saline (PBS) and form stable lanthanide phosphates [20]. Since DMEM contains Na2HPO4, it can be assumed that the lanthanide ions will also bind to these mentioned compounds. Therefore, a quantitative analysis of ion release was not performed in DMEM.
Table 2 shows the percentages of filtered ions detected by ICP-OES after 24 h of redispersion in water. Supporting Information File 1, Table S1 shows the amounts of detected filtered ions, from initial ion concentration values of 1.0 ± 0.1 and 2.0 ± 0.1 ppm, after dissolution in water. The recovery rate of the ions in water was the lowest for Er3+ (approx. 6%), followed by Yb3+ (17–21%) and Y3+ (38–45%). Due to these results and to the relatively low Er3+ content of the samples, data regarding Er3+ ions was not further considered.
Table 2:
Percentages of released lanthanide ions from silica-coated UCNPs obtained via ICP-OES after 24 h of dispersion in water.
Sample
c = 200 μg/mL UCNP cores
c = 200 μg/mL silica-coated UCNPs
Y
[%]
Yb
[%]
c (UCNP cores)
[µg/mL]
Y
[%]
Yb
[%]
UC@thin_NH2
0.97 ± 0.01
0.18 ± 0.03
96
1.88 ± 0.07
0.41 ± 0.05
UC@thick_NH2
0.33 ± 0.02
0.20 ± 0.02
33
0.97 ± 0.03
0.15 ± 0.08
The sample UC@thin_NH2 showed a significantly higher percentage of released lanthanide ions after 24 h of redispersion in water and centrifugation when compared to UC@thick_NH2 (Table 2). However, the difference would have been much larger if only the reduction of the diffusion rate through the three times thicker shell had delayed the dissolution of the UCNPs [60]. The percentage values for Y3+ release are generally higher than that for Yb3+. This can be partially explained by the lower content of Yb3+ and the lower recovery rate of Yb3+ compared to Y3+, which decreases further with decreasing concentration. Nonetheless, the difference is more significant than what is expected from these considerations. Lahtinen et al. have also observed that, in comparison to Yb3+, a significantly higher molar fraction of Y3+ is released from NaYF4:Yb,Er nanocrystals [19]. Dong et al. reported an analogous observation for the ratio of Y3+ and Gd3+ during a partial disintegration of NaGdF4:Y3+,Tb3+[61]. This finding can be explained assuming that Y3+ ions are concentrated at the nanoparticle surface and, consequently, are more easily dissolved compared to the other ions [19].
The samples with 200 μg/mL silica-coated UCNPs show a higher percentage of released ions compared to the samples with 200 μg/mL UCNP cores, since the dissolution of NaYF4:Yb,Er UCNPs in water is limited by its low solubility product [62,63]. The ICP-OES data shows that the release of lanthanides from UCNPs even with a silica coating is not negligible; however, a thicker layer reduces the release of lanthanides. Lahtinen et al. reported that NaYF4:Yb,Er particles with a similar diameter (26–31 nm) but with a poly(acrylic acid) coating release more than 7% of their F− ions in 24 h at a concentration of 50 µg/mL [19]. This comparison suggests that a 7 nm thick silica layer is enough to significantly reduce the disintegration process. In line with our findings, Saleh et al. also observed, in a study published during the review process of this work, by measuring released F− and Y3+ ions that the dissolution of UCNPs in water can be almost completely suppressed by a thick (73 nm) microporous silica shell. In the case of a 10 nm thick silica shell, they observed that the amount of released ions increases with time [57].
Cytotoxicity studies
Figure 2 shows the viability results for the RAW 264.7 cells upon exposure to UCNPs. Due to the results of the ion release experiments, the same total particle mass values were compared. The cytotoxicity of UC@thin_NH2 was higher than that of UC@thick_NH2 in RAW 264.7 cells. At the highest particle concentration (c = 200 µg/mL), the cell viability after exposure to UC@thin_NH2 was approx. 51 ± 5%, whereas in the UC@thick_NH2 sample, the cell viability was 75 ± 6%. At the lowest concentration (c = 12.5 µg/mL) the cell viability was 110 ± 12% for UC@thin_NH2 and 95 ± 14% for UC@thick_NH2. UC@thin_RBITC_NH2 caused a slightly higher cytotoxicity than UC@thin_NH2, especially at lower concentration values, such as 12.5 and 25 µg/mL. At these concentration values, the cytotoxicity of the former sample was approx. 74 ± 1%. In general, UC@thick_NH2 was the least cytotoxic particle type for all samples. At the highest concentration values (c = 150 and 200 µg/mL) of UC@thick_NH2, no significant difference in the cell viability was observed between the two values. The cytotoxicity of pure silica without a UCNP core (sample SiO2@RBITC_NH2) was also measured. The cell viability at the lowest concentration was 83 ± 5%, and at the highest concentration was 68 ± 4%, indicating a moderate cytotoxicity.
Figure 2:
MTT assay results of silica-coated UCNPs and SiO2 nanoparticles on RAW 264.7 cells.
Figure 2:
MTT assay results of silica-coated UCNPs and SiO2 nanoparticles on RAW 264.7 cells.
The aggregation state of the nanoparticles can also influence the formation of their protein corona and, consequently, the release of ions in the cells. However, no indication of such effects were found in the present study. The sample UC@thin_NH2 has a larger hydrodynamic diameter than the sample UC@thick_NH2 in DMEM and the situation is reversed for sample UC@thin_RBITC_NH2 and sample UC@thick_RBITC_NH2. However, in both cases the cell viability increases with shell thickness. Since the light scattering is proportional to the 6th power of the particle size, small changes in the aggregation state of the nanoparticles cause significant changes in the Z-average in DLS.
Both non-functionalized samples were more cytotoxic compared to the amino-functionalized particles. UC@thin exhibits only a slightly higher degree of cytotoxicity than UC@thick. Nabeshi et al. investigated the cytotoxicity of non-modified, amine-functionalized, and carboxyl-functionalized 70 nm SiO2 NPs in RAW 264.7 cells [46]. They observed that unmodified SiO2 nanoparticles had the highest cytotoxicity due to the higher degree of uptake into cells. In contrast, the amine-functionalized particles were only adsorbed onto the cell membrane. Similar results were also obtained by Kurtz-Chalot et al., in which SiO2 nanoparticles with a high positive charge were more adsorbed than taken up by cells compared to the corresponding non-modified particles [45]. Xia et al. investigated cell type-dependent cytotoxicity in RAW 264.7, epithelial (BEAS-2B), human microvascular endothelial (HMEC), hepatoma (HEPA-1), and pheochromocytoma (PC-12) cells after exposure to amine-functionalized polystyrene nanoparticles (NH2-PS) [64]. They observed that lysosomal permeabilization and mitochondrial damage happened in RAW 264.7 cells but not in the other cell types. The particles were cytotoxic to RAW 264.7 and BEAS-2B cells but not to other cells. The nanoparticles perturbed the proton pump activity in RAW 264.7 cells, causing osmotic swelling and lysosomal rupture.
According to these results, RAW 264.7 cells internalize negatively charged particles to a greater extent than positively functionalized ones, causing the former to have higher cytotoxicity on RAW 264.7 cells, as it was also observed in this work. Nevertheless, the thicker silica shell reduces the degree of cytotoxicity of the amino-functionalized samples in macrophages more than that of non-functionalized particles. Possibly, the ions released at the cell membrane also can reduce cell viability.
In this work, the cell viability of silica-coated particles is higher than that of non-coated NaGdF4 nanoparticles. Wysokińska et al. investigated such particles, with average sizes between 4 and 249 nm and IC50 values below 2 µg/mL, via 3-(4,5-dimethylthiazol-2-yl)-5-(3-carboxymethoxyphenyl)-2-(4-sulfophenyl)-2H-tetrazolium (MTS) assays [42].
Despite the significant effects of the silica shell on cell viability, it should be noted that other factors, besides shell and surface functionalization, can influence the cytotoxicity of lanthanide-containing particles and might be entangled with the present observations. Liu et al. recently observed that the cellular concentration of Eu- and Bi-doped GdVO4 nanoparticles in polymer shells decreases with incubation time due to the occurrence of proliferation and exocytosis [65]. Such effects can be related to the functionalization and size of the nanoparticles as well as to ion release, and modulate the toxicity of lanthanide-containing particles as a function of time.
The obtained data shows that a particle concentration of up to 12.5 μg/mL does not lead to a critical decline in cell viability for all the particles under study. This quantity can be used as a reference point for the biomedical implementation of these particles. In addition, an incubation time longer than 24 h can be used in future experiments to determine the influence of prolonged contact with UCNP-containing particles and a small amount of released ions on cytotoxicity.
Cellular uptake
Flow cytometry can provide qualitative and quantitative information about internalized particles in cells or particles adsorbed onto cellular membranes, relying on the fact that when cells internalize nanoparticles they increase their internal complexity [66,67]. Several publications have shown that side-scattering correlates with the concentration of nanoparticles attached to or taken up by cells [67-73].
The flow cytometry measurements were carried out in cells incubated with nanoparticles (c = 100 µg/mL) for 24 h at 37 °C. Figure 3 shows side-scatter (SSC) histograms of RAW 264.7 cells after exposure to UC@thin_NH2 (blue-framed area) and UC@thick_NH2 (red-framed area). The data for non-particle-treated controls is marked as a yellow-framed area. After 24 h, the SSC mean value for UC@thin_NH2 was (251 ± 8) × 103, and that of UC@thick_NH2 was (323 ± 17) × 103, while the control value was (212 ± 6) × 103. The percentage increase of the SSC mean value for UC@thin_NH2 was 18 ± 5%, whereas for UC@thick_NH2 it was 52 ± 9%, indicating a higher increase of cell granularity and a higher uptake rate for UC@thick_NH2 compared to the samples with thin-shelled particles. The MTT cytotoxicity assay showed a higher cytotoxicity for UC@thin_NH2 compared to UC@thick_NH2, meaning that a higher increase in the side-scattering signal of the thick-coated particles does not correspond to a higher cytotoxicity. Therefore, although more thick-shelled particles were taken up, they are less toxic to the cells than a smaller quantity of thin-shelled particles.
Figure 3:
(A) SSC histograms of RAW 264.7 cells after particle exposure for 24 h at 37 °C. UC@thin_NH2 is marked by a blue-framed peak, UC@thick_NH2 is marked by a red-framed peak, and the control is marked by a yellow-framed peak. (B) Summary of mean SSC flow cytometry measurements on all samples in RAW 264.7 cells after particle exposure for 24 h at 37 °C.
Figure 3:
(A) SSC histograms of RAW 264.7 cells after particle exposure for 24 h at 37 °C. UC@thin_NH2 is mar...
Figure 3 shows a bar chart of the SSC mean values for RAW 264.7 cells. The flow cytometry measurements of UC@thin and UC@thick were performed at a different time than the rest of the samples. Hence, each had their own negative control samples.
In the case of UC@thin_RBITC_NH2 and UC@thin samples, the particles with thinner shells had higher SSC mean values than those with thicker shells, indicating greater changes in cellular granularity after exposure to the nanoparticles (i.e., a higher amount of incorporated particles). This was not the case for the sample UC@thin_NH2, which had the lowest SSC intensity of all coated UCNP samples. However, this does not go along with a higher cytotoxicity since the thin-coated samples had a higher degree of cytotoxicity in the MTT assay in comparison to the thick-coated particles (Figure 2). The cytotoxicity of the thin-coated samples must have been caused by other effects that did not result in a stronger increase in cell granularity, such as a higher release of ions and a related reduction in cell viability, as indicated by the ion-release experiments and MTT data (Figure 2 and Figure 3, respectively).
Cell cycle analysis
To gain a deeper understanding of the effect of silica-coated UCNPs on RAW 264.7 macrophages, an analysis of the cell cycle dynamics of UCNP@thin_NH2 and UCNP@thick_NH2 samples was carried out. The cell cycle consists of four parts: The rest phase (G0); the first gap phase (G1), in which the cells grow and produce enzymes necessary for cell division; the synthesis phase (S), in which the DNA is replicated; and the second gap phase (G2), in which the cell continues to grow further and to perform processes that are necessary for mitosis [74]. Both silica-coated samples show a significant increase in the G0/G1 phase compared to control cells (not treated with nanoparticles) (Figure 4). Accordingly, the cell population in the S phase is reduced relative to the control group. This effect is more pronounced in the sample with a thinner silica shell. In the case of the sample UCNP@thin_NH2, the percentage of the cell population in the second rest phase (G2) is strongly increased, whereas for the sample UCNP@thick_NH2 this percentage is comparable to that of the control. The calculation of the proliferative index (PI), according to Equation 1, shows that cells treated with both types of nanoparticles show a significantly decreased PI value (0.39 ± 0.05 for the UCNP@thin_NH2 sample and 0.35 ± 0.14 for the UCNP@thick_NH2 sample) compared to the control (0.53 ± 0.06).
(1)
Figure 4:
Effect of (A) UC@thin_NH2 (tSiO2 = 8 ± 2 nm) and (B) UC@thick_NH2 (tSiO2 = 21 ± 2 nm) on the cell cycle dynamics of RAW 264.7 macrophages after 24 h of exposure. The concentration used was 200 µg/mL. The asterisk indicates significant differences relative to the control p < 0.05.
Figure 4:
Effect of (A) UC@thin_NH2 (tSiO2 = 8 ± 2 nm) and (B) UC@thick_NH2 (tSiO2 = 21 ± 2 nm) on the cell c...
In contrast to this observation, the silica particles without a UCNP core (sample NP@SiO2-RBITC-NH2) exhibit similar cell-cycle dynamics as the nanoparticle-free control (Figure S4, Supporting Information File 1). Their PI value (0.54 ± 0.10) is also similar to that of the control (0.48 ± 0.06) and of the control used for the other particles (0.53 ± 0.06).
The observation that an affected cell cycle has longer rest phases and a shorter S phase, especially for cells exposed to particles with a thinner silica shell, roughly correlates with the reduced cell viability of these samples in MTT assays. However, it is surprising that the cell cycle of cells treated with UCNP-free silica particles is not significantly influenced. Similar findings suggesting a partial blocking of the cell cycle by UCNPs were reported by Liu et al., who also observed a G0/G1 cell-cycle arrest and a significant decrease of the PI for human gastric adenocarcinoma (SGC-7901) cells incubated with poly(N-vinylpyrrolidone) (PVP)-coated NaYF4:Yb,Er particles in a similar concentration range [74]. Chen et al. investigated NaYF4:Yb,Er nanoparticles capped with (aminomethyl)phosphonic (AMPA), (aminopropyl)triethoxysilane (APTES), and dihydrocinnamic acid (DHCA) on epithelial cells (Chinese hamster ovary cells, CHO-K1) [75]. They observed that the positively charged AMPA and APTES UCNPs, as well as the negatively charged DHCA-capped particles led to a severe dysregulation of the cell cycle. In contrast to the present results, the authors found a dramatic decrease in the proportion of cells in the G1 phase and a substantial increase in the proportion of cells in the G2 phase. The latter is in line with an increase in dead or lysed cells compared to the untreated control. According to Chen et al., the amino-functionalized UCNPs were only capped at the surface with silane and no closed silica shell had grown around the particles, such that the release of cytotoxic ions was not reduced as in the present work.
Lu et al. investigated the effect of silica particles of various sizes and surface coatings on RAW.246.7 cells. Their results are in agreement with our findings, which demonstrate that amino-functionalized silica particles have only a negligible impact on the cell cycle given that they are in the same size and concentration range as in the present work [76]. These results suggest that silica is a suitable coating material to reduce cytotoxicity. The effect of UCNPs on RAW 246.7 cells has not been studied so far.
Conclusion
In bioimaging applications using UCNPs, it is crucial to keep the particles intact (i.e., without dissolution processes) in the cellular environment as these processes reduce the viability of the investigated cells due to ion release. Coating NaYF4:Yb,Er nanocrystals with silica shells with two different thickness values is an efficient way to reduce the release of toxic ions from these particles and, consequently, their cytotoxicity. This assumption is well supported by cell viability, ion release, cellular uptake, and cell cycle assays, even if other factors (e.g., surface functionalization and subsequent effects, such as agglomeration) also influence these processes. However, it was shown that silica shells with thickness values of 7 nm or even 21 nm were not sufficient to completely hinder the release of lanthanide ions from UCNPs. According to MTT assays and, more specifically, cell cycle analysis, the UCNPs did not exhibit a biocompatibility level similar to that of silica particles without a lanthanide core. It has to be considered that amorphous silica obtained from a Stöber-like growth process is an inherently porous material with a pore size of 1–4 nm [35,36]. Thus, it contains pores that are larger than water molecules, as well as lanthanide and other ions (e.g., Na+ and F−) that are contained in UCNPs. An increase in the silica shell thickness likely reduces ion release. Moreover, ligands that actively reduce the release/dissolution process of lanthanide nanocrystals, such as (multi)chelating phosphonates [30,32,33], can be bound into or onto the surface of silica shells [77]. The use of different surfactants during the shell growth process might allow for a slightly further reduction of the pore size. Silica coating of UCNPs is a simple and well-established process. The thickness of the silica shell on UCNPs can easily be adjusted over a wide range up to 200 nm depending on the intended application [38]. Hence, it opens up not only a variety of possibilities for the (bio)-functionalization of UCNPs [52], but also it provides a simple approach to make UCNPs less cytotoxic.
Experimental
All synthesis procedures were performed with standard glass equipment. Before use, the reaction vessels were cleaned with hydrofluoric acid (8 vol %) and repeatedly rinsed with water. The nanoparticles were redispersed using an ultrasonic bath operating at 860 W, 35 kHz (Sonorex RK512H, Bandelin). Ultrapure water (filter size = 0.22 μm, R = 18.2 MΩ·cm, Millipore) was used for all synthesis procedures.
Materials
Oleic acid (OA, 90%), erbium chloride hexahydrate (ErCl3·6H2O, 99.9%), ytterbium chloride hexahydrate (YbCl3·6H2O, 99.9%), and yttrium chloride hexahydrate (YCl3·6H2O, 99.9%) were purchased from ABCR. N-(6-Aminohexyl)-3-aminopropyltrimethoxysilane (AHAPS, 97%), 3-aminopropyltrimethoxysilane (APS, 99%), rhodamine B isothiocyanate (RBITC, ≥95%), polyoxyethylene-(5)-nonylphenyl ether (Igepal® CO-520), ammonium fluoride (NH4F, 99.8%), 1-octadecene (tech. 95%), sodium oleate (82%), tetraethyl orthosilicate (TEOS, 98%), as well as erbium, yttrium, and ytterbium standards for ICP-OES measurements (TraceCERT®, c = 1000 mg/mL) were obtained from Sigma-Aldrich. Cyclohexane (tech. 99.5%) and ammonia water (p.a., 25 wt % NH3) were purchased from Roth. Ethanol (EtOH, 100%) was purchased from Berkel AHK, hydrofluoric acid (HF, 30%) was purchased from Riedel de Haën, and sodium hydroxide (NaOH, 99%) was purchased from Grüssing.
DMEM, FBS, antibiotics, and PBS (pH 7.4) were purchased from Life Technologies (Carlsbad, CA, USA). 3-(4,5-Dimethylthiazol-2-yl)-2,5-diphenyltetrazolium bromide (MTT), dimethyl sulfoxide (DMSO), propidium iodide, and RNase were obtained from Sigma-Aldrich (St. Louis, MO, USA). The T-75 and T-25 flasks, used for growing the cells, and the 12- and 96-well plates were purchased from Corning®. Cell scrapers used to scrape RAW 264.7 cells from the bottom of the flasks were purchased from PLC Labclinics. All chemicals were used without further purification.
Synthesis
NaYF4:Yb,Er UCNPs were synthesized from the corresponding lanthanide oleates [78,79] according to a modified procedure from Na et al. [47], which is described in detail in [38].
Growth of silica shells
For silica shells (thickness = 7 ± 1 nm), a dispersion of UCNPs (diameter = 33 ± 2 nm; c = 3 g/L) in 33.3 mL of cyclohexane was used. After sonicating for 10 min, 3.736 mL of Igepal CO-520 was added. After a brief mixing using an ultrasonic bath, 0.331 mL of ammonia water was added, and the dispersion was sonicated again for 20 min. Subsequently, 0.331 mL of TEOS was added and the whole mixture was sonicated for at least 1 h. Finally, the dispersion was stirred for 12 h at 1200 rpm at room temperature [38].
For growing 21 ± 2 nm thick silica shells, additional cyclohexane, Igepal CO-520, and ammonia water were added to the non-purified dispersion of UCNPs coated with 7 ± 1 nm thick shells to maintain a surfactant concentration of 11 wt % and a maximum water concentration of 2–3 wt %. The initial concentration of UCNP cores was set to 20 g/L and the total volume was 5 mL. Next, 1.551 mL of TEOS was added stepwise at a rate of 20.8 μL/min through a peristaltic pump (REGLO Digital MS–2/8–160, Ismatec, with a TYGON R-3603 tubing, type AME-01) while the dispersion was stirred for 12 h at 1200 rpm at room temperature. When the desired shell thickness was reached, the particles were precipitated by adding 5–10 mL of EtOH, purified by three cycles of centrifugation (1200g, 1 h) and redispersion in 10 mL of EtOH. Finally, the particles were redispersed in 10–15 mL of EtOH [38].
For the growth of silica shells with covalently bound RBITC, a modified method from Verhaegh et al. was used [80]. The reaction was carried out under inert atmosphere. The dye was first coupled with APS yielding the dye-coupling product RBITC-APS. For this, 2.7 mg (5 ± 10−3 mmol) of RBITC was diluted to 1 mM in absolute EtOH and 10 µL (5 ± 10−2 mmol) of APS was added. The solution was stirred overnight at room temperature under inert atmosphere and the coupling product was not purified. The growth of the silica shell was performed as described above. In addition, ammonia water was added as the last reagent and, after the addition of TEOS, 108 µL of the ethanolic solution of RBITC-APS was continuously added dropwise through a syringe in the case of the particles with thin silica shells for 100 mg mass of non-coated UCNPs. In the case of the second growth step of the thicker shells, 432 µL of this solution was added instead.
To obtain a positive surface charge, silica-coated UCNPs were functionalized with AHAPS. The reaction was carried under inert atmosphere and it was modified from [51]. As an example, in the case of the particles with thin shells, 1.5 mL (c = 20 g/L in ethanol, particle mass = 30 mg) of the nanoparticle dispersion was diluted in ethanol to c = 1 g/L. To ensure that the entire surface was covered with AHAPS and to keep the pH value at 9, a ten-time excess of 30 µL of AHAPS and a few drops of ammonia water (30% v/v) were added, respectively. The mixture was stirred overnight under argon atmosphere, followed by heating under reflux for 1 h. For the particles with thicker silica coating, 1.5 mL (c = 20 g/L in ethanol, particle mass = 30 mg) of the dispersion was diluted to c = 1 g/L and reacted with 25 µL of a solution containing AHAPS and ammonium hydroxide. The nanoparticles were washed three times under inert atmosphere by repeated centrifugation (1200g, 1 h) and redispersion in 10 mL of EtOH. Finally, the particles were redispersed in 10–15 mL of EtOH.
The silica particles without an UCNP core were prepared as described in [51]. However, instead of fluorescein isothiocyanate, rhodamine isothiocyanate was used. The functionalization with AHAPs was carried out by using the same procedure, which was also used for the silica-coated UCNPs.
Characterization
Scanning transmission electron microscopy
STEM images were taken using a Hitachi SU 8030 scanning electron microscope with an electron acceleration voltage of 30 kV and a current of 20 µA. A droplet of the nanoparticle dispersion (c = 0.5–1 g/L) in either cyclohexane, for oleate-functionalized UCNP cores, or in ethanol, for silica-coated UCNPs, was dried on a carbon-coated copper grid (Cu 400 mesh, Quantifoil®: 100 carbon support films). The images were analyzed using the software FIJI. At least 300 particles per sample were analyzed.
Dynamic light scattering and electrophoretic light scattering
The DLS and ELS measurements were performed using a Zetasizer Nano ZS system (Malvern Instruments) at 25 °C and at a wavelength of 633 nm. The uncoated UCNPs were dispersed in cyclohexane, whereas the silica-coated particles were dispersed in ethanol, water, or in supplemented DMEM. Then, they were filtered through sterile syringe filters (pore size: 0.2 µm, Rotilab). Nylon filters were used for particles dispersed in cyclohexane and ethanol, whereas regenerated cellulose filters were used for particles dispersed in water or DMEM. Zeta potential measurements of the dispersions in ethanol and water were carried out using capillary zeta cells (DTS 1070, Malvern Instruments). In all measurements, the concentration of the samples was in the range of 0.5–1 mg/mL.
Ion release experiments
The silica-coated UCNPs were redispersed in 4 mL of ultrapure water or supplemented DMEM, such that a final particle concentration of 200 μg/mL for the silica-coated UCNPs and for the UCNP cores was obtained. The dispersions were kept at 37 °C for 24 h, and centrifuged with centrifuge tubes containing membrane filters (Amicon ultracentrifuge, low-binding ultracel membrane, 3000 molecular weight cutoff (MWCO)) for 2 h at 3080g. Aliquots were diluted in 10 mL of a solution containing ultrapure water and aqua regia (water/aqua regia = 4:1 v/v) and measured via ICP-OES for determining the concentration of the Er3+, Yb3+, and Y3+ ions (Supporting Information File 1).
Aqueous solutions containing 1.0 ± 0.1 and 2.0 ± 0.1 ppm of Er3+, Yb3+, or Y3+ (prepared from the corresponding lanthanoid chlorides) were also centrifuged through the same Amicon filter tubes mentioned above, diluted in 10 mL of ultrapure water and aqua regia (water/aqua regia = 4:1 v/v) solution, and analyzed via ICP-OES to determine the concentration of the Er3+, Yb3+, or Y3+ ions (Supporting Information File 1).
Cell culture of RAW 264.7 cells
RAW 264.7 cells were provided by the group of Dr. Philipp Seib at the University of Strathclyde, Glasgow, UK. The cells were grown in DMEM medium supplemented with 10% FBS, 2 mM L-glutamine, 100 U/mL penicillin, 100 μg/mL streptomycin, and 250 μg/mL fungizone at 37 °C in a 5% CO2 humidified atmosphere [73]. The cells were observed daily for confluence and cell morphology by using an inverted phase-contrast Eclipse TS100 microscope (Nikon, Tokyo, Japan). For routine subculturing, cells at approx. 80% confluency were gently lifted off by scrapping and transferred into fresh growth medium. For each experiment, cells were allowed to adhere for 24 h, and then the medium was replaced with fresh medium containing UCNPs.
MTT cell viability assay
Cell viability was determined by the colorimetric changes in the MTT cytotoxicity assay. For that, 103 cells per well were seeded into a 96-well Corning plate. Cells were, then, incubated for 24 h at 37 °C in a 5% CO2 humidified atmosphere. After that, the culture medium was replaced with fresh medium containing UCNPs at 12.5, 25, 50, 100, 150, and 200 µg/mL for 24 h. RAW 264.7 cells exposed to culture medium without UCNPs were used as controls. Then, 50 µL of MTT at 1 mg/mL in PBS was added to each well and the cells were incubated for another 4 h at 37 °C in 5% CO2. Afterward, 150 µL of DMSO was added to each well and the plates were shaken in the dark using an orbital shaker (Mini Shaker, Kisker Biotec). The absorbance was recorded at 570 nm using a microtiter plate reader (Synergy HT, BioTeK Instruments Inc).
The percentage of cell growth inhibition was calculated using Equation 2:
(2)
Cell cycle analysis
The cell cycle was analyzed by using flow cytometry, according to the method previously described [81]. Briefly, cells were seeded onto 6-well plates and incubated with UCNPs at a concentration of 200 µg/mL. After exposure, the cells were washed with PBS, harvested through scrapping, and centrifuged twice at 300g for 5 min. Cells were then fixed with 85% ice-cold ethanol and kept at −20 °C until analysis. At the time of analysis, cells were centrifuged at 300g for 5 min, resuspended in PBS, and filtered through a 50 µm nylon mesh to separate aggregates. Cells were then incubated with 50 µL of propidium iodide (1 mg/mL), a DNA intercalating fluorochrome, and 50 µL of RNase (1 mg/mL) for 20 min, in the dark and at room temperature. Cell cycle distribution data was assessed by using a Beckman Coulter EPICS XL flow cytometer (Coulter Electronics, Hialeah, Florida, USA), and the percentage of cells in sub-G1, G0/G1, S, and G2 phases was determined by using the FlowJo software (FlowJo LLC, Ashland, OR, USA) applying the Watson Pragmatic model.
Uptake potential analysis by flow cytometry
The uptake potential of UCNPs by RAW 264.7 cells was obtained by using flow cytometry. RAW 264.7 cells were seeded (105 per well) onto a 12-well plate and incubated for 24 h at 37 °C in a 5% CO2 humidified atmosphere in order to adhere to the bottom of the wells. After that, the medium was replaced with fresh medium containing nanoparticles at a concentration of 100 µg/mL. Fresh medium, without particles, was added to the control and blank wells. Cells were incubated for 24 h at 37 °C. After that, the supernatant was removed from each well, and the cells were washed once with PBS. Then, 1 mL of supplemented DMEM was added and the cells were finally collected by scraping and analyzed via flow cytometry in an Attune® Acoustic Focusing Cytometer (ThermoFisher Scientific). Both forward-scatter (FS), which provides information regarding particle size, and side-scatter (SS), which provides information regarding the complexity of the particles, parameters were measured.
Supporting Information
Supporting Information File 1:
Experimental details, additional UC luminescence spectra, XRD data, STEM images, ICP-OES, and cell cycle data.
We thank I. Pieper from the research group of Prof. Dr. Martin Kaupenjohann (Technische Universität Berlin) for the ICP-OES measurements, Prof. Dr. R. Haag (Freie Universität Berlin) for providing access to the dynamic light scattering setup, Prof. Dr. E. Rühl (Freie Universität Berlin) for providing access to the fluorescence spectrometer, and Dr. S. Berendts from the research group of Prof. Dr. M. Lerch (Technische Universität Berlin) for the XRD measurements. This work is primarily based on the doctoral dissertation of its first author, Cynthia Kembuan, published as "Synthesis and characterization of gold shell nanoparticles for controlled enhancement of photon upconversion process" (Freie Universität Berlin, 2020).
Funding
This research was supported by the EU (COST Action 1403), the Deutsche Forschungsgemeinschaft (DFG) within the ERA-NET program (grant GR 2113/6‐1), and the Freie Universität Berlin.
Thanks are due to FCT/MCTES for the financial support to CESAM (UIDP/50017/2020+UIDB/50017/2020), through national funds. This work was supported by the project PTDC/BTM-MAT/31794/2017 (POCI-01-0145-FEDER-031794) funded by FEDER, through COMPETE2020 - Programa Operacional Competitividade e Internacionalização (POCI), and by national funds (OE), through FCT/MCTES. Research contract under Stimulus of Scientific Employment to H.O. (CEECIND/04050/2017) is acknowledged.
References
Lu, Y.; Zhao, J.; Zhang, R.; Liu, Y.; Liu, D.; Goldys, E. M.; Yang, X.; Xi, P.; Sunna, A.; Lu, J.; Shi, Y.; Leif, R. C.; Huo, Y.; Shen, J.; Piper, J. A.; Robinson, J. P.; Jin, D. Nat. Photonics2014,8, 32–36. doi:10.1038/nphoton.2013.322
Return to citation in text:
[1]
Bettinelli, M.; Carlos, L.; Liu, X. Phys. Today2015,68 (9), 38–44. doi:10.1063/pt.3.2913
Return to citation in text:
[1]
Sun, S.-K.; Wang, H.-F.; Yan, X.-P. Acc. Chem. Res.2018,51, 1131–1143. doi:10.1021/acs.accounts.7b00619
Return to citation in text:
[1]
Li, Z.; Yuan, H.; Yuan, W.; Su, Q.; Li, F. Coord. Chem. Rev.2018,354, 155–168. doi:10.1016/j.ccr.2017.06.025
Return to citation in text:
[1]
Li, X.; Zhang, F.; Zhao, D. Chem. Soc. Rev.2015,44, 1346–1378. doi:10.1039/c4cs00163j
Return to citation in text:
[1]
Jalani, G.; Tam, V.; Vetrone, F.; Cerruti, M. J. Am. Chem. Soc.2018,140, 10923–10931. doi:10.1021/jacs.8b03977
Return to citation in text:
[1]
Zhou, M.; Ge, X.; Ke, D.-M.; Tang, H.; Zhang, J.-Z.; Calvaresi, M.; Gao, B.; Sun, L.; Su, Q.; Wang, H. Front. Chem. (Lausanne, Switz.)2019,7, 218. doi:10.3389/fchem.2019.00218
Return to citation in text:
[1]
[2]
[3]
Dukhno, O.; Przybilla, F.; Muhr, V.; Buchner, M.; Hirsch, T.; Mély, Y. Nanoscale2018,10, 15904–15910. doi:10.1039/c8nr03892a
Return to citation in text:
[1]
[2]
[3]
[4]
Oliveira, H.; Bednarkiewicz, A.; Falk, A.; Fröhlich, E.; Lisjak, D.; Prina-Mello, A.; Resch, S.; Schimpel, C.; Vrček, I. V.; Wysokińska, E.; Gorris, H. H. Adv. Healthcare Mater.2019,8, 1801233. doi:10.1002/adhm.201801233
Return to citation in text:
[1]
[2]
Plohl, O.; Kraft, M.; Kovač, J.; Belec, B.; Ponikvar-Svet, M.; Würth, C.; Lisjak, D.; Resch-Genger, U. Langmuir2017,33, 553–560. doi:10.1021/acs.langmuir.6b03907
Return to citation in text:
[1]
[2]
[3]
Kostiv, U.; Rajsiglová, L.; Luptáková, D.; Pluháček, T.; Vannucci, L.; Havlíček, V.; Engstová, H.; Jirák, D.; Šlouf, M.; Makovicky, P.; Sedláček, R.; Horák, D. RSC Adv.2017,7, 45997–46006. doi:10.1039/c7ra08712h
Return to citation in text:
[1]
[2]
Zhou, L.; Wang, R.; Yao, C.; Li, X.; Wang, C.; Zhang, X.; Xu, C.; Zeng, A.; Zhao, D.; Zhang, F. Nat. Commun.2015,6, 6938. doi:10.1038/ncomms7938
Return to citation in text:
[1]
Yang, D.; Ma, P.; Hou, Z.; Cheng, Z.; Li, C.; Lin, J. Chem. Soc. Rev.2015,44, 1416–1448. doi:10.1039/c4cs00155a
Return to citation in text:
[1]
Tsai, Y.-C.; Vijayaraghavan, P.; Chiang, W.-H.; Chen, H.-H.; Liu, T.-I.; Shen, M.-Y.; Omoto, A.; Kamimura, M.; Soga, K.; Chiu, H.-C. Theranostics2018,8, 1435–1448. doi:10.7150/thno.22482
Return to citation in text:
[1]
Chen, B.; Su, Q.; Kong, W.; Wang, Y.; Shi, P.; Wang, F. J. Mater. Chem. B2018,6, 2924–2944. doi:10.1039/c8tb00614h
Return to citation in text:
[1]
Green, K.; Huang, K.; Pan, H.; Han, G.; Lim, S. F. Front. Chem. (Lausanne, Switz.)2018,6, 416. doi:10.3389/fchem.2018.00416
Return to citation in text:
[1]
Palo, E.; Salomäki, M.; Lastusaari, M. J. Colloid Interface Sci.2019,538, 320–326. doi:10.1016/j.jcis.2018.11.094
Return to citation in text:
[1]
[2]
Lahtinen, S.; Lyytikäinen, A.; Päkkilä, H.; Hömppi, E.; Perälä, N.; Lastusaari, M.; Soukka, T. J. Phys. Chem. C2017,121, 656–665. doi:10.1021/acs.jpcc.6b09301
Return to citation in text:
[1]
[2]
[3]
[4]
[5]
[6]
Lisjak, D.; Plohl, O.; Vidmar, J.; Majaron, B.; Ponikvar-Svet, M. Langmuir2016,32, 8222–8229. doi:10.1021/acs.langmuir.6b02675
Return to citation in text:
[1]
[2]
[3]
Plohl, O.; Kralj, S.; Majaron, B.; Fröhlich, E.; Ponikvar-Svet, M.; Makovec, D.; Lisjak, D. Dalton Trans.2017,46, 6975–6984. doi:10.1039/c7dt00529f
Return to citation in text:
[1]
[2]
[3]
Estebanez, N.; González-Béjar, M.; Pérez-Prieto, J. ACS Omega2019,4, 3012–3019. doi:10.1021/acsomega.8b03015
Return to citation in text:
[1]
[2]
[3]
[4]
Lisjak, D.; Plohl, O.; Ponikvar-Svet, M.; Majaron, B. RSC Adv.2015,5, 27393–27397. doi:10.1039/c5ra00902b
Return to citation in text:
[1]
Mandl, G. A.; Cooper, D. R.; Hirsch, T.; Seuntjens, J.; Capobianco, J. A. Methods Appl. Fluoresc.2019,7, 012004. doi:10.1088/2050-6120/aafa3d
Return to citation in text:
[1]
Agalakova, N. I.; Gusev, G. P. ISRN Cell Biol.2012, 403835. doi:10.5402/2012/403835
Return to citation in text:
[1]
Barbier, O.; Arreola-Mendoza, L.; Del Razo, L. M. Chem.-Biol. Interact.2010,188, 319–333. doi:10.1016/j.cbi.2010.07.011
Return to citation in text:
[1]
[2]
Pałasz, A.; Czekaj, P. Acta Biochim. Pol.2000,47, 1107–1114. doi:10.18388/abp.2000_3963
Return to citation in text:
[1]
Gnach, A.; Lipinski, T.; Bednarkiewicz, A.; Rybka, J.; Capobianco, J. A. Chem. Soc. Rev.2015,44, 1561–1584. doi:10.1039/c4cs00177j
Return to citation in text:
[1]
Elsaesser, A.; Howard, C. V. Adv. Drug Delivery Rev.2012,64, 129–137. doi:10.1016/j.addr.2011.09.001
Return to citation in text:
[1]
Li, R.; Ji, Z.; Dong, J.; Chang, C. H.; Wang, X.; Sun, B.; Wang, M.; Liao, Y.-P.; Zink, J. I.; Nel, A. E.; Xia, T. ACS Nano2015,9, 3293–3306. doi:10.1021/acsnano.5b00439
Return to citation in text:
[1]
[2]
[3]
Liu, J.-N.; Bu, W.-B.; Shi, J.-L. Acc. Chem. Res.2015,48, 1797–1805. doi:10.1021/acs.accounts.5b00078
Return to citation in text:
[1]
Kostiv, U.; Lobaz, V.; Kučka, J.; Švec, P.; Sedláček, O.; Hrubý, M.; Janoušková, O.; Francová, P.; Kolářová, V.; Šefc, L.; Horák, D. Nanoscale2017,9, 16680–16688. doi:10.1039/c7nr05456d
Return to citation in text:
[1]
[2]
Li, R.; Ji, Z.; Chang, C. H.; Dunphy, D. R.; Cai, X.; Meng, H.; Zhang, H.; Sun, B.; Wang, X.; Dong, J.; Lin, S.; Wang, M.; Liao, Y.-P.; Brinker, C. J.; Nel, A.; Xia, T. ACS Nano2014,8, 1771–1783. doi:10.1021/nn406166n
Return to citation in text:
[1]
[2]
Hemmer, E.; Yamano, T.; Kishimoto, H.; Venkatachalam, N.; Hyodo, H.; Soga, K. Acta Biomater.2013,9, 4734–4743. doi:10.1016/j.actbio.2012.08.045
Return to citation in text:
[1]
Li, S.; Wan, Q.; Qin, Z.; Fu, Y.; Gu, Y. Langmuir2015,31, 824–832. doi:10.1021/la5042103
Return to citation in text:
[1]
[2]
Raschpichler, C.; Goroncy, C.; Langer, B.; Antonsson, E.; Wassermann, B.; Graf, C.; Klack, P.; Lischke, T.; Rühl, E. J. Phys. Chem. C2020,124, 16663–16674. doi:10.1021/acs.jpcc.0c04308
Return to citation in text:
[1]
[2]
Plohl, O.; Majaron, B.; Ponikvar-Svet, M.; Makovec, D.; Lisjak, D. Acta Chim. Slov.2015,62, 789–795. doi:10.17344/acsi.2015.1508
Return to citation in text:
[1]
Kembuan, C.; Saleh, M.; Rühle, B.; Resch-Genger, U.; Graf, C. Beilstein J. Nanotechnol.2019,10, 2410–2421. doi:10.3762/bjnano.10.231
Return to citation in text:
[1]
[2]
[3]
[4]
[5]
[6]
Wang, K.; Ma, J.; He, M.; Gao, G.; Xu, H.; Sang, J.; Wang, Y.; Zhao, B.; Cui, D. Theranostics2013,3, 258–266. doi:10.7150/thno.5701
Return to citation in text:
[1]
Appelqvist, H.; Wäster, P.; Kågedal, K.; Öllinger, K. J. Mol. Cell Biol.2013,5, 214–226. doi:10.1093/jmcb/mjt022
Return to citation in text:
[1]
Iler, R. K. The Chemistry of Silica: Solubility, Polymerization, Colloid and Surface Properties and Biochemistry of Silica; John Wiley & Sons: New York, NY, USA, 1979.
Return to citation in text:
[1]
Wysokińska, E.; Cichos, J.; Kowalczyk, A.; Karbowiak, M.; Strządała, L.; Bednarkiewicz, A.; Kałas, W. Biomolecules2019,9, 14. doi:10.3390/biom9010014
Return to citation in text:
[1]
[2]
[3]
Dussert, F.; Arthaud, P.-A.; Arnal, M.-E.; Dalzon, B.; Torres, A.; Douki, T.; Herlin, N.; Rabilloud, T.; Carriere, M. Nanomaterials2020,10, 1418. doi:10.3390/nano10071418
Return to citation in text:
[1]
[2]
Dalzon, B.; Aude-Garcia, C.; Collin-Faure, V.; Diemer, H.; Béal, D.; Dussert, F.; Fenel, D.; Schoehn, G.; Cianférani, S.; Carrière, M.; Rabilloud, T. Nanoscale2017,9, 9641–9658. doi:10.1039/c7nr02140b
Return to citation in text:
[1]
[2]
Kurtz-Chalot, A.; Villiers, C.; Pourchez, J.; Boudard, D.; Martini, M.; Marche, P. N.; Cottier, M.; Forest, V. Mater. Sci. Eng., C2017,75, 16–24. doi:10.1016/j.msec.2017.02.028
Return to citation in text:
[1]
[2]
[3]
[4]
Zhang, J.; Liu, F.; Li, T.; He, X.; Wang, Z. RSC Adv.2015,5, 7773–7780. doi:10.1039/c4ra11374h
Return to citation in text:
[1]
[2]
[3]
[4]
[5]
Wang, Y.; Zhao, Q.; Han, N.; Bai, L.; Li, J.; Liu, J.; Che, E.; Hu, L.; Zhang, Q.; Jiang, T.; Wang, S. Nanomedicine (N. Y., NY, U. S.)2015,11, 313–327. doi:10.1016/j.nano.2014.09.014
Return to citation in text:
[1]
[2]
Izak-Nau, E.; Voetz, M.; Eiden, S.; Duschl, A.; Puntes, V. F. Part. Fibre Toxicol.2013,10, 56. doi:10.1186/1743-8977-10-56
Return to citation in text:
[1]
[2]
[3]
[4]
Monopoli, M. P.; Walczyk, D.; Campbell, A.; Elia, G.; Lynch, I.; Baldelli Bombelli, F.; Dawson, K. A. J. Am. Chem. Soc.2011,133, 2525–2534. doi:10.1021/ja107583h
Return to citation in text:
[1]
[2]
Saleh, M. I.; Rühle, B.; Wang, S.; Radnik, J.; You, Y.; Resch-Genger, U. Sci. Rep.2020,10, 19318. doi:10.1038/s41598-020-76116-z
Return to citation in text:
[1]
[2]
Qiu, Y.; Liu, Y.; Wang, L.; Xu, L.; Bai, R.; Ji, Y.; Wu, X.; Zhao, Y.; Li, Y.; Chen, C. Biomaterials2010,31, 7606–7619. doi:10.1016/j.biomaterials.2010.06.051
Return to citation in text:
[1]
Lundqvist, M.; Stigler, J.; Elia, G.; Lynch, I.; Cedervall, T.; Dawson, K. A. Proc. Natl. Acad. Sci. U. S. A.2008,105, 14265–14270. doi:10.1073/pnas.0805135105
Return to citation in text:
[1]
Lettinga, M. P.; van Zandvoort, M. A. M. J.; van Kats, C. M.; Philipse, A. P. Langmuir2000,16, 6156–6165. doi:10.1021/la9916023
Return to citation in text:
[1]
Dong, C.; Pichaandi, J.; Regier, T.; van Veggel, F. C. J. M. J. Phys. Chem. C2011,115, 15950–15958. doi:10.1021/jp206441u
Return to citation in text:
[1]
Itoh, H.; Hachiya, H.; Tsuchiya, M.; Suzuki, Y.; Asano, Y. Bull. Chem. Soc. Jpn.1984,57, 1689–1690. doi:10.1246/bcsj.57.1689
Return to citation in text:
[1]
Xia, T.; Kovochich, M.; Liong, M.; Zink, J. I.; Nel, A. E. ACS Nano2008,2, 85–96. doi:10.1021/nn700256c
Return to citation in text:
[1]
Liu, Z.; Escudero, A.; Carrillo-Carrion, C.; Chakraborty, I.; Zhu, D.; Gallego, M.; Parak, W. J.; Feliu, N. Chem. Mater.2020,32, 245–254. doi:10.1021/acs.chemmater.9b03673
Return to citation in text:
[1]
Jochums, A.; Friehs, E.; Sambale, F.; Lavrentieva, A.; Bahnemann, D.; Scheper, T. Toxics2017,5, 15. doi:10.3390/toxics5030015
Return to citation in text:
[1]
Suzuki, H.; Toyooka, T.; Ibuki, Y. Environ. Sci. Technol.2007,41, 3018–3024. doi:10.1021/es0625632
Return to citation in text:
[1]
[2]
Zucker, R. M.; Daniel, K. M.; Massaro, E. J.; Karafas, S. J.; Degn, L. L.; Boyes, W. K. Cytometry, Part A2013,83, 962–972. doi:10.1002/cyto.a.22342
Return to citation in text:
[1]
Kumar, A.; Pandey, A. K.; Singh, S. S.; Shanker, R.; Dhawan, A. Cytometry, Part A2011,79A, 707–712. doi:10.1002/cyto.a.21085
Return to citation in text:
[1]
Zucker, R. M.; Massaro, E. J.; Sanders, K. M.; Degn, L. L.; Boyes, W. K. Cytometry, Part A2010,77A, 677–685. doi:10.1002/cyto.a.20927
Return to citation in text:
[1]
Toduka, Y.; Toyooka, T.; Ibuki, Y. Environ. Sci. Technol.2012,46, 7629–7636. doi:10.1021/es300433x
Return to citation in text:
[1]
Rosário, F.; Hoet, P.; Santos, C.; Oliveira, H. Toxicology2016,368–369, 103–115. doi:10.1016/j.tox.2016.08.020
Return to citation in text:
[1]
Bastos, V.; Ferreira de Oliveira, J. M. P.; Brown, D.; Jonhston, H.; Malheiro, E.; Daniel-da-Silva, A. L.; Duarte, I. F.; Santos, C.; Oliveira, H. Toxicol. Lett.2016,249, 29–41. doi:10.1016/j.toxlet.2016.03.005
Return to citation in text:
[1]
[2]
Liu, C.; Chen, H.; Li, S.; Xu, H.; Zhao, D. J. Nanosci. Nanotechnol.2016,16, 3653–3658. doi:10.1166/jnn.2016.11889
Return to citation in text:
[1]
[2]
Chen, Y.; D'Amario, C.; Gee, A.; Duong, H. T. T.; Shimoni, O.; Valenzuela, S. M. Acta Biomater.2020,102, 384–393. doi:10.1016/j.actbio.2019.11.048
Return to citation in text:
[1]
Lu, X.; Jin, T.; Zheng, J.; Fan, X. J. Nanosci. Nanotechnol.2017,17, 954–967. doi:10.1166/jnn.2017.12811
Return to citation in text:
[1]
Duncan, A. K.; Klemm, P. J.; Raymond, K. N.; Landry, C. C. J. Am. Chem. Soc.2012,134, 8046–8049. doi:10.1021/ja302183w
Return to citation in text:
[1]
Park, J.; An, K.; Hwang, Y.; Park, J.-G.; Noh, H.-J.; Kim, J.-Y.; Park, J.-H.; Hwang, N.-M.; Hyeon, T. Nat. Mater.2004,3, 891–895. doi:10.1038/nmat1251
Return to citation in text:
[1]
Wei, Y.; Lu, F.; Zhang, X.; Chen, D. Chem. Mater.2006,18, 5733–5737. doi:10.1021/cm0606171
Return to citation in text:
[1]
Verhaegh, N. A. M.; van Blaaderen, A. Langmuir1994,10, 1427–1438. doi:10.1021/la00017a019
Return to citation in text:
[1]
Oliveira, H.; Monteiro, C.; Pinho, F.; Pinho, S.; Ferreira de Oliveira, J. M. P.; Santos, C. Mutat. Res., Genet. Toxicol. Environ. Mutagen.2014,775–776, 38–47. doi:10.1016/j.mrgentox.2014.10.002
Return to citation in text:
[1]
Reference 47
47.
Na, H.; Woo, K.; Lim, K.; Jang, H. S. Nanoscale2013,5, 4242–4251. doi:10.1039/c3nr00080j
Bastos, V.; Ferreira de Oliveira, J. M. P.; Brown, D.; Jonhston, H.; Malheiro, E.; Daniel-da-Silva, A. L.; Duarte, I. F.; Santos, C.; Oliveira, H. Toxicol. Lett.2016,249, 29–41. doi:10.1016/j.toxlet.2016.03.005
Lundqvist, M.; Stigler, J.; Elia, G.; Lynch, I.; Cedervall, T.; Dawson, K. A. Proc. Natl. Acad. Sci. U. S. A.2008,105, 14265–14270. doi:10.1073/pnas.0805135105
Bastos, V.; Ferreira de Oliveira, J. M. P.; Brown, D.; Jonhston, H.; Malheiro, E.; Daniel-da-Silva, A. L.; Duarte, I. F.; Santos, C.; Oliveira, H. Toxicol. Lett.2016,249, 29–41. doi:10.1016/j.toxlet.2016.03.005
Li, R.; Ji, Z.; Dong, J.; Chang, C. H.; Wang, X.; Sun, B.; Wang, M.; Liao, Y.-P.; Zink, J. I.; Nel, A. E.; Xia, T. ACS Nano2015,9, 3293–3306. doi:10.1021/acsnano.5b00439
Plohl, O.; Kralj, S.; Majaron, B.; Fröhlich, E.; Ponikvar-Svet, M.; Makovec, D.; Lisjak, D. Dalton Trans.2017,46, 6975–6984. doi:10.1039/c7dt00529f
30.
Li, R.; Ji, Z.; Dong, J.; Chang, C. H.; Wang, X.; Sun, B.; Wang, M.; Liao, Y.-P.; Zink, J. I.; Nel, A. E.; Xia, T. ACS Nano2015,9, 3293–3306. doi:10.1021/acsnano.5b00439
Iler, R. K. The Chemistry of Silica: Solubility, Polymerization, Colloid and Surface Properties and Biochemistry of Silica; John Wiley & Sons: New York, NY, USA, 1979.
Park, J.; An, K.; Hwang, Y.; Park, J.-G.; Noh, H.-J.; Kim, J.-Y.; Park, J.-H.; Hwang, N.-M.; Hyeon, T. Nat. Mater.2004,3, 891–895. doi:10.1038/nmat1251
Li, R.; Ji, Z.; Dong, J.; Chang, C. H.; Wang, X.; Sun, B.; Wang, M.; Liao, Y.-P.; Zink, J. I.; Nel, A. E.; Xia, T. ACS Nano2015,9, 3293–3306. doi:10.1021/acsnano.5b00439


![[2190-4286-12-3-1]](/bjnano/content/figures/2190-4286-12-3-1.png?scale=2.0&max-width=1024&background=FFFFFF)
![[2190-4286-12-3-2]](/bjnano/content/figures/2190-4286-12-3-2.png?scale=2.0&max-width=1024&background=FFFFFF)
![[2190-4286-12-3-3]](/bjnano/content/figures/2190-4286-12-3-3.png?scale=2.0&max-width=1024&background=FFFFFF)
![[2190-4286-12-3-i1]](/bjnano/content/inline/2190-4286-12-3-i1.svg?max-width=590&scale=1.18182)
![[2190-4286-12-3-4]](/bjnano/content/figures/2190-4286-12-3-4.png?scale=2.0&max-width=1024&background=FFFFFF)
![[2190-4286-12-3-i2]](/bjnano/content/inline/2190-4286-12-3-i2.svg?max-width=590&scale=1.18182)