Supporting Information
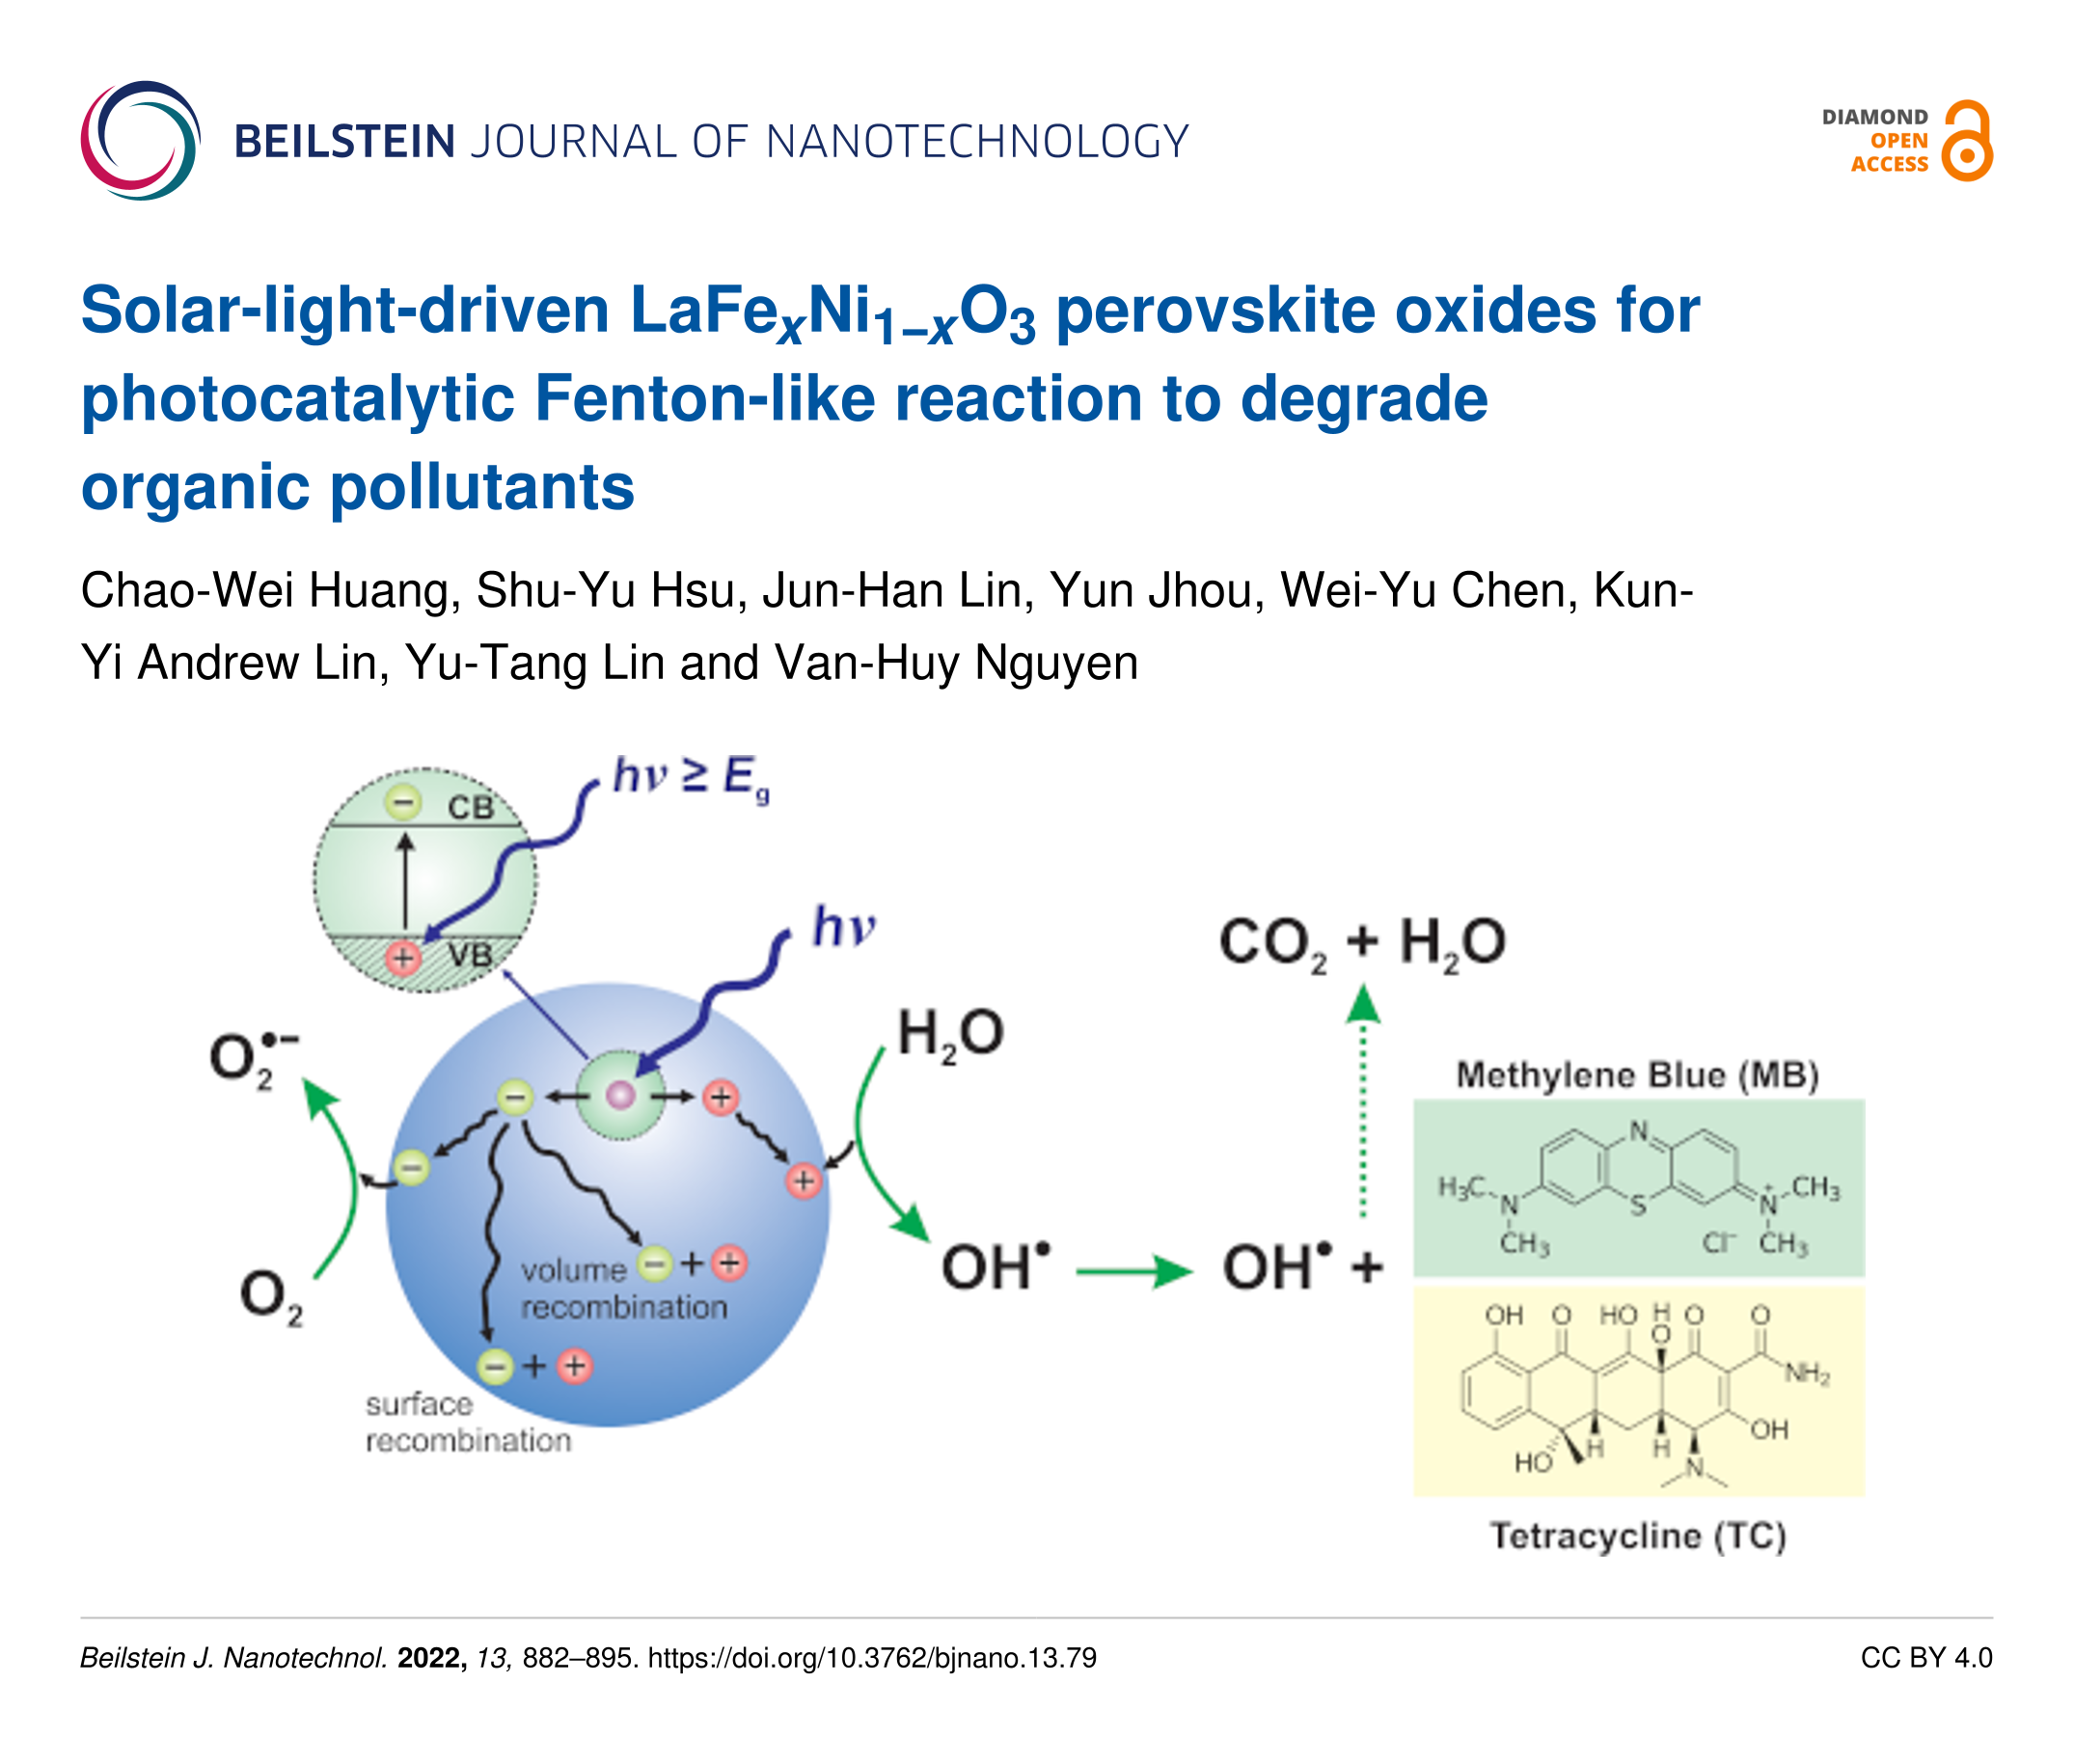
Figure S1: The nitrogen adsorption and desorption curves of the samples with different Fe/Ni synthesis ratios at pH 0. Figure S2: Pore size distribution of the samples with different Fe/Ni synthesis ratios. Figure S3: The FESEM images of LaFexNi1−xO3 prepared at pH 7 (at the magnification of 100,000×). Figure S4: (a) The C/C0 and (b) the 1st order kinetic analysis of the photodegradation using LaFe0.7Ni0.3O3 operating at different controlling conditions. Figure S5: (a) The C/C0 and (b) 1st order kinetic analysis of the MB and TC photodegradation using LaFe0.7Ni0.3O3 operating at the optimal condition. Table S1: The specific surface area, pore size, and pore volume for the samples with different Fe/Ni ratios. Table S2: The unit cell parameters and cell volume for the samples with different Fe/Ni ratios. Table S3: The detailed EDS information of various samples with different Fe/Ni ratios. Table S4: The comparison of photodegradation performance over various LaFeO3-related samples.
| Supporting Information File 1: Additional figures and tables. | ||
| Format: PDF | Size: 626.4 KB | Download |
Cite the Following Article
How to Cite
Download Citation
Citation data can be downloaded as file using the "Download" button or used for copy/paste from the text window
below.
Citation data in RIS format can be imported by all major citation management software, including EndNote,
ProCite, RefWorks, and Zotero.
Presentation Graphic
| Picture with graphical abstract, title and authors for social media postings and presentations. | ||
| Format: PNG | Size: 11.3 MB | Download |
Citations to This Article
Scholarly Works
- Arman, M.; Mansor, E. S. Studying the physical properties of LaFeO3, La0.5Sm0.5FeO3, and La0.5Nd0.5FeO3 perovskite nanoparticles with a comparative photocatalytic degradation of Congo Red dye. Nano-Structures & Nano-Objects 2026, 45, 101602. doi:10.1016/j.nanoso.2025.101602
- Hamarawf, R. F.; Tofiq, D. I.; Aziz, K. H. H.; Hassan, H. Q.; Abdalkarim, K. A.; Mohammed, S. J. Antibacterial activity and photo-Fenton catalytic degradation of a novel FeII/FeIII mixed-valency porous coordination polymer. Journal of Environmental Chemical Engineering 2025, 13, 116765. doi:10.1016/j.jece.2025.116765
- Huang, C.; Chen, P.; Lin, Y.; Wang, T.; Lin, D.; Cheng, Y.; Wu, D.; Manatura, K.; Chen, W.; Lin, K. A.; Chien, A. C. Enhancing Dry Reforming of Methane with Calcium‐Substituted LaNiO₃ Perovskite Catalysts for Syngas Production and Carbon Resistance. ChemistrySelect 2025, 10. doi:10.1002/slct.202403401
- Essawy, A. A.; Hasanin, T. H. A.; Hussein, M. F.; El Agammy, E. F.; Essawy, A. E.-N. I. One-Pot Phyto-Mediated Synthesis of Fe2O3/Fe3O4 Binary Mixed Nanocomposite Efficiently Applied in Wastewater Remediation by Photo-Fenton Reaction. Catalysts 2024, 14, 466. doi:10.3390/catal14070466
- Huang, C.-W.; Zhou, S.-R.; Hsiao, W.-C. Multifunctional TiO2/MIL-100(Fe) to conduct adsorption, photocatalytic, and heterogeneous photo-Fenton reactions for removing organic dyes. Journal of the Taiwan Institute of Chemical Engineers 2024, 158, 104850. doi:10.1016/j.jtice.2023.104850
- Hsiao, W.-C.; Tseng, C.-H.; Huang, C.-W. A facile reflux method to produce ternary CQDs/P25/NH2−MIL-125 for photocatalytic degradation of methylene blue under simulated solar light. Journal of the Taiwan Institute of Chemical Engineers 2024, 154, 105286. doi:10.1016/j.jtice.2023.105286
- Mulani, S. R.; Bimli, S.; Choudhary, E.; Bunkar, R.; Kshirsagar, U. A.; Devan, R. S. Cationic and anionic cross-assisted synergistic photocatalytic removal of binary organic dye mixture using Ni-doped perovskite oxide. Chemosphere 2023, 340, 139890. doi:10.1016/j.chemosphere.2023.139890
- Pham, V. V.; Tran, H. H.; Cao, T. M. V2O5 Nanorod-Loaded g-C3N4 Sheets for Efficient Photocatalytic Removal of NO and Minimal NO2 Yield under Visible Light. Energy & Fuels 2023, 37, 13241–13249. doi:10.1021/acs.energyfuels.3c01422
- Quang, H. H. P.; Dinh, D. A.; Dutta, V.; Chauhan, A.; Lahiri, S. K.; Gopalakrishnan, C.; Radhakrishnan, A.; Batoo, K. M.; Thi, L.-A. P. Current approaches, and challenges on identification, remediation and potential risks of emerging plastic contaminants: A review. Environmental toxicology and pharmacology 2023, 101, 104193. doi:10.1016/j.etap.2023.104193
- Humayun, M.; Bahadur, A.; Khan, A.; Bououdina, M. Exceptional Photocatalytic Performance of the LaFeO3/g-C3N4 Z-Scheme Heterojunction for Water Splitting and Organic Dyes Degradation. Catalysts 2023, 13, 907. doi:10.3390/catal13050907