Abstract
Indium nitrate/polyvinyl pyrrolidone (In(NO3)3/PVP) composite nanofibers were synthesized via electrospinning, and then hollow structure indium oxide (In2O3) nanofibers were obtained through calcination with PVP as template material. In situ polymerization was used to prepare indium oxide/polyaniline (In2O3/PANI) composite nanofibers with different mass ratios of In2O3 to aniline. The structure and morphology of In(NO3)3/PVP, In2O3/PANI composite nanofibers and pure PANI were investigated by scanning electron microscopy (SEM), Fourier transform infrared spectroscopy (FTIR), X-ray diffraction (XRD), transmission electron microscopy (TEM) and current–voltage (I–V) measurements. The gas sensing properties of these materials towards NH3 vapor (100 to 1000 ppm) were measured at room temperature. The results revealed that the gas sensing abilities of In2O3/PANI composite nanofibers were better than pure PANI. In addition, the mass ratio of In2O3 to aniline and the p–n heterostructure between In2O3 and PANI influences the sensing performance of the In2O3/PANI composite nanofibers. In this paper, In2O3/PANI composite nanofibers with a mass ratio of 1:2 exhibited the highest response values, excellent selectivity, good repeatability and reversibility.
Introduction
With the development of modern industry, environmental pollution in the form of air pollution, water pollution and soil pollution has become ever more serious [1]. With regard to this, considerable attention has been paid to air pollution. Ammonia (NH3), as a highly toxic gas, can be emitted by natural and industrial sources and threaten human health [2-4]. NH3 at concentrations of 50 ppm may irritate the human respiratory system, skin and eyes [4]. Higher concentrations of NH3 will cause blindness, seizures, lung disease and even death [5-7]. So, there is an urgent need to develop a kind of gas sensor with high sensitivity and selectivity to detect NH3 at room temperature.
Metal oxide semiconductors can be applied as sensing materials for monitoring NH3. Ammonia sensors based on In2O3 [8], TiO2 [9], SnO2 [10], ZnO [11] and WO3 [12] have been reported. Indium oxide (In2O3) is an n-type semiconductor with a band gap of approximately 3.55–3.75 eV, which has been widely used due to its excellent electrical and optical properties. In2O3 also exhibits sensitivity to various vapors and gases, such as NO2 [13], CO [14], H2 [15], acetone [16] and formaldehyde [17]. However, for most metal oxides, there is the drawback of a required high operation temperature, about 300 °C, which will increase the energy consumption [18]. Compared with metal oxides, sensors based on conducting polymers show low power consumption and can be operated at room temperature. In addition, they exhibit a large specific area, small size and low weight, and they are easy to integrate with existing electronics [19,20]. Because of the environmental stability, easy synthesis and reversible doping behavior, polyaniline (PANI), as one of the most commonly used conducting polymers has received considerable attention. However, the sensitivity of PANI remains to be improved [21,22]. To conquer the limitations mentioned above, the combination of metal oxide and conducting polymers have been developed as an effective way to achieve enhanced performance [21,23-27].
In this paper, In2O3/PANI composite nanofibers were prepared by the combination of electrospinning technique, calcination method and in situ polymerization. This study presents the improved response capabilities of gas sensors based on In2O3/PANI composite nanofibers, which were synthesized with different ratios between In2O3 and aniline during the in situ polymerization. All sensors were tested at room temperature in a concentration range of NH3 from 100 to 1000 ppm.
Experimental
Materials
Polyvinylpyrrolidone-K90 (PVP-K90, Mw = 1.3 × 10⁶ g/mol) was purchased from Bo Di Industrial Co. Ltd of Tianjin. Indium nitrate hydrate, N,N-dimethylformamide (DMF), ethyl alcohol, aniline monomer (An), ammonium persulfate (APS), hydrochloric acid (HCl, 37%), ammonium hydroxide (NH4OH) and m-cresol were obtained from Sinopharm Chemical Reagent Co., Ltd. (Shanghai, China). All chemicals and reagents were used as received, expect for aniline monomer. Distilled aniline monomer and deionized water were used in this study.
Preparation of hollow In2O3 nanofibers
The In(NO3)3/PVP composite nanofibers were fabricated via single-nozzle electrospinning. In(NO3)3·4.5H2O (1.059 g) and PVP (3.529 g) were added into 10 mL ethyl alcohol and 10 mL DMF. The mixture was stirred at 65 °C until all the solutes were fully dissolved. The precursor solution was poured into the syringe for electrospinning. The parameters of the electrospinning were: a needle-to-collector distance of 16 cm, a voltage of 16 kV, and a feed rate of 0.5 mL/h. Then the In2O3 nanofibers were synthesized by annealing the precursor composite nanofibers at 800 °C for 3 h after heating from room temperature at a rate of 0.5 °C/min.
Preparation of In2O3/PANI composite nanofibers
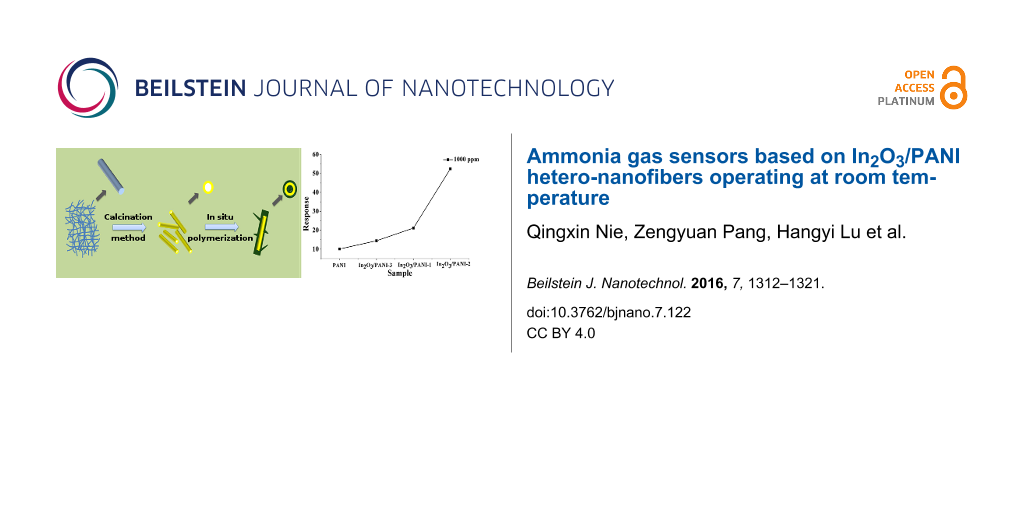
Firstly, 0.1 g In2O3 nanofibers, which had been ground in an agate mortar, were added into 200 mL 1.2 mol/L HCl solution with ultrasonication treatment. Then a certain amount of aniline in HCl solution was added to the above suspension. After that, 30 mL 1.2 mol/L HCl solution containing APS was slowly dripped into the suspension to initiate the polymerization. The mass ratios of In2O3 nanofibers to aniline were 1:1, 1:2 and 1:4. The molar ratio of aniline to APS was 1:1. The in situ polymerization of aniline was carried out in an ice bath at 0–5 °C. The reaction lasted for 5 h. The suspension was taken out and left for 30 min, and then washed with deionized water and centrifuged for 5 min. At last, the composite nanofibers were filtered and dried in vacuum at 50 °C for 48 h. The schematic of the preparation of In2O3/PANI composite nanofibers is illustrated in Figure 1.
![[2190-4286-7-122-1]](/bjnano/content/figures/2190-4286-7-122-1.png?scale=2.0&max-width=1024&background=FFFFFF)
Figure 1: Schematic of the preparation of In2O3/PANI composite nanofibers.
Figure 1: Schematic of the preparation of In2O3/PANI composite nanofibers.
Fabrication of In2O3/PANI gas sensors
The ground In2O3/PANI nanofibers and pure PANI were mixed with m-cresol to form pastes, in which the weight ratio of In2O3/PANI or PANI to m-cresol was 1:10. Each paste was coated onto interdigital electrodes to construct a sensing film and dried at 55 °C for 2 h in air. Four thin film sensors with different mass ratios of In2O3 to aniline (0, 1:1, 1:2 and 1:4) were prepared. Correspondingly, the four sensors were denoted as PANI sensor, In2O3/PANI-1 nanofibers sensor, In2O3/PANI-2 nanofibers sensor and In2O3/PANI-3 nanofibers sensor.
Structural characterization and gas sensing test
The crystal structure of In2O3 nanofibers was characterized by X-ray diffraction (XRD; D8, Bruker AXS, Germany) in a 2θ region of 3–90° with Cu Kα radiation. The morphologies and structures of the In2O3 nanofibers, PANI and PANI/In2O3 composite nanofibers were examined by field emission scanning electron microscopy (FESEM, S-4800 and SU-1510, Hitachi, Tokyo, Japan), transmission electron microscopy (TEM; JEM-2100HR, JEOL), and Fourier transform infrared (FTIR) spectroscopy in the range of 4000–400 cm−1 with a 4 cm−1 spectral resolution (NEXUS 470 spectrometer, Nicolet, Madison, WI, USA). I–V measurements were carried out on a CHI 660E electrochemical workstation (CH Instruments, Shanghai, China) with a three-electrode system.
The gas sensing performance of the prepared In2O3/PANI nanofibers was measured using a custom-built static state gas sensing test system at room temperature (25 ± 1 °C) with a relative humidity of 60 ± 1%. During the gas measurement, the aqueous ammonia was injected into the test chamber using a syringe through a rubber plug. The volume of ammonia injected into chamber were 1.3468 μL, 4.0404 μL, 6.734 μL, 10.7744 μL and 13.468 μL resulting in ammonia vapor with concentrations of 100, 300, 500, 800 and 1000 ppm, respectively. The gas response value (S) is defined as a ratio of (Ri − R0)/R0, in which Ri and R0 are the resistance of the sensor in testing gas and air, respectively. Each result was the average value of five tests.
Results and Discussion
Materials characterization
The XRD patterns of the nanofibers obtained by annealing In(NO3)3/PVP composite nanofibers at 800 °C are shown in Figure 2a. It can be seen that the crystal phase of the material was In2O3, and the diffraction peak of 30.56° was indexed to the (222) crystal plane of the cubic structure of In2O3. This result confirmed that the final product of calcination was In2O3.
![[2190-4286-7-122-2]](/bjnano/content/figures/2190-4286-7-122-2.png?scale=2.0&max-width=1024&background=FFFFFF)
Figure 2: a) XRD pattern of In2O3 nanofibers. FTIR spectra of b) In(NO3)3/PVP composite nanofibers and In2O3 nanofibers, c) In2O3 nanofibers, and d) In2O3 nanofibers and In2O3/PANI composite nanofibers.
Figure 2: a) XRD pattern of In2O3 nanofibers. FTIR spectra of b) In(NO3)3/PVP composite nanofibers and In2O3 ...
The chemical structure of the precursor nanofibers, In2O3 nanofibers and In2O3/PANI nanofibers were analyzed by FTIR. As shown in Figure 2b, the FTIR spectrum of In(NO3)3/PVP composite nanofibers exhibits a broad characteristic band around 3382 cm−1, which is related to the O–H stretching vibration. It could be the result of absorbing moisture from air. The –CH2 stretching vibration and bending vibration of PVP are attributed to the peaks of around 2951 cm−1 and 1423 cm−1. The peaks at 1647 cm−1 and 1292 cm−1 were assigned to the C=O stretching vibration and C≡N antisymmetrical stretching vibration, respectively, in the ring skeleton of PVP. But the characteristic peaks of In(NO3)3 could not be found in the FTIR spectra. In the spectrum of In2O3 nanofibers (Figure 2c), the characteristic peaks of PVP have almost vanished. Instead, peaks around 600 cm−1, 567 cm−1 and 538 cm−1 appeared, which are associated with the cubic bixbyite-type structure of In2O3. The results indicates that PVP was resolved and In(NO3)3 was converted into In2O3 during annealing.
Figure 2d presents the FTIR spectra of In2O3, PANI and In2O3/PANI nanofibers. The characteristic peaks around 1558 cm−1 originating from C=C stretching vibration in the quinoid ring of PANI can be seen. The characteristic bands of 1300 cm−1 and 1116 cm−1 were attributed to the C–N stretching vibration in the benzenoid ring and the bending vibration plane of C–H bonds in the quinoid ring, respectively. By comparison, the characteristic peaks of In2O3 also exist in the spectrum of In2O3/PANI nanofibers. This demonstrated that PANI was coated on the surface of the In2O3 nanofibers by in situ polymerization. But for In2O3/PANI-3 nanofibers, the peaks of In2O3 and PANI showed a significantly decrease which may be caused by the excess of PANI covering.
Figure 3a,b shows SEM images of In(NO3)3/PVP composite nanofibers and In2O3 nanofibers, respectively. From Figure 3a, it can be seen that the surface of In(NO3)3/PVP composite nanofibers was relatively smooth and no beads and droplets appeared. The diameter distribution of In(NO3)3/PVP nanofibers were mostly in the range of 700–1000 nm. The In2O3 nanofibers were relatively uniform with diameters of 150–220 nm. These results show that the In2O3 nanofibers were much rougher and smaller than the precursor nanofibers. In addition, it shows that some nanofibers adhered together in Figure 3b, which is not the case in Figure 3a. It is possible that the solvent was not completely volatilized from the precursor nanofibers membrane. The residual solvent may have re-dissolved the precursor nanofibers and then the dissolved nanofibers were connected along each other during the calcinations. As the calcination temperature increased, the residual solvent started to volatilize and the In2O3 nanofibers were gradually formed, but the bonded nanofibers would not segregate during this process, leading to some nanofibers connected along each other.
![[2190-4286-7-122-3]](/bjnano/content/figures/2190-4286-7-122-3.png?scale=2.0&max-width=1024&background=FFFFFF)
Figure 3: SEM images of (a) In(NO3)3/PVP composite nanofibers (with diameter distributions), (b) In2O3 nanofibers (with diameter distributions), (c) cross-section of In2O3 nanofibers. (d) TEM image of In2O3 nanofibers.
Figure 3: SEM images of (a) In(NO3)3/PVP composite nanofibers (with diameter distributions), (b) In2O3 nanofi...
The cross-sectional image and the TEM image show the detailed structure of In2O3 nanofibers. In Figure 3c and 3d, it is confirmed that the In2O3 nanofibers consited of small grains and the hollow structure can be clearly observed. The hollow structure of In2O3 nanofibers was synthesized by a template-assisted method. PVP as the supporting material of precursor nanofibers was decomposed during the annealing process, and the In(NO3)3 was transformed into crystalline In2O3. During calcination, PVP decomposed and gases diffused from the interior to the exterior of the composite nanofibers, leading to crystalline In2O3 grains constantly moving and tending to be regularly arrayed [16]. As a result, hollow structure of In2O3 nanofibers was formed during the annealing process.
Current–voltage (I–V) measurements of PANI, In2O3/PANI-1, In2O3/PANI-2 and In2O3/PANI-3 nanofibers were carried out at room temperature. As shown in Figure 4, the I–V characteristics of all In2O3/PANI nanofibers clearly exhibit a nonlinear behavior and it can be observed the rectifying behavior in Figure 4, which might result from the p–n junction between the p-type PANI and n-type In2O3 [28,29]. It can be observed that the current of In2O3/PANI showed exponential rise at low voltage and then almost linear rise at high voltages. But for pure PANI, the current showed nearly linear behavior in the forward region, which is attributed to raidply forming polarons and bipolarons in PANI. As some researches mentioned [28-30], the ohmic behavior in this case was related to the formation of an ohmic contact between PANI and In2O3. Compared with pure PANI, the In2O3/PANI nanofibers reach a higher current due to the smaller width of the depletion layer between PANI and In2O3. Moreover, the addition of PANI reduced the width of the depletion layer at the interface and was helpful to form a typical ohmic system [31]. Thus, it can be confirmed that a p–n junction between PANI and In2O3 had been formed.
![[2190-4286-7-122-4]](/bjnano/content/figures/2190-4286-7-122-4.png?scale=2.0&max-width=1024&background=FFFFFF)
Figure 4: Current–Voltage (I–V) characteristics of pure PANI and In2O3/PANI nanofibers.
Figure 4: Current–Voltage (I–V) characteristics of pure PANI and In2O3/PANI nanofibers.
Gas sensing properties
To study the ammonia sensing behavior of the sensors with different ratios of In2O3 to aniline, the dynamic response of the sensors based on pure PANI and In2O3/PANI nanofibers towards different NH3 concentrations ranging from 100 to 1000 ppm at room temperature were investigated. As exhibited in Figure 5, it can be seen that the trends of the response and recovery were consistent among the pure PANI and the three In2O3/PANI nanofibers sensors. The In2O3/PANI-1 and In2O3/PANI-2 nanofibers always show a higher response value than pure PANI at the same concentration of NH3.
![[2190-4286-7-122-5]](/bjnano/content/figures/2190-4286-7-122-5.png?scale=2.0&max-width=1024&background=FFFFFF)
Figure 5: Dynamic response of sensors based on (a) pure PANI, (b) In2O3/PANI nanofibers-1, (c) In2O3/PANI nanofibers-2 and (d) In2O3/PANI nanofibers-3 towards 100–1000 ppm NH3 at room temperature.
Figure 5: Dynamic response of sensors based on (a) pure PANI, (b) In2O3/PANI nanofibers-1, (c) In2O3/PANI nan...
The response values of pure PANI and these three In2O3/PANI nanofibers sensors to different concentrations of NH3 are displayed in Figure 6. It can be found that the response values increased with the growth of gas concentration. The responses of pure PANI to 100 ppm, 300 ppm, 500 ppm, 800 ppm, 1000 ppm NH3 were 1.26, 3.11, 5.91, 7.71, 10.09, respectively. The responses of In2O3/PANI-1 nanofibers sensor were 1.48, 5.32, 14.11, 16.00 and 21.12. For In2O3/PANI-2 nanofibers sensor, the responses were 1.48, 5.48, 17.67, 36.57 and 53.20, respectively. While for the In2O3/PANI-3 sensor, the values were only 0.76, 3.32, 4.64, 11.15 and 14.43. It was observed that at low concentrations of NH3, the responses of these sensors were similar. But with increasing NH3 concentrations, it was very clear that the responses of In2O3/PANI gas sensors were much higher than pure PANI. The response of In2O3/PANI-2 exhibited the highest value. The response of In2O3/PANI-2 to 1000 ppm was about twice as large as that of In2O3/PANI-1. When the weight ratio of In2O3 to aniline was raised to 1:4 (In2O3/PANI-3), the responses to NH3 decreased.
![[2190-4286-7-122-6]](/bjnano/content/figures/2190-4286-7-122-6.png?scale=2.0&max-width=1024&background=FFFFFF)
Figure 6: The response values of pure PANI and three In2O3/ PANI nanofibers sensors to different concentration of NH3 at room temperature.
Figure 6: The response values of pure PANI and three In2O3/ PANI nanofibers sensors to different concentratio...
These results revealed that the mass ratio of In2O3 to aniline had an obvious influence on the NH3 sensing performance of the composite nanofibers. Comparing the sensitivity of three In2O3/PANI nanofibers sensors, it can be found that the In2O3/PANI-2 nanofibers sensor delivers the best performance. Therefore, In2O3/PANI-2 was selected to further investigate the sensing properties.
As mentioned in the Introduction section, 50 ppm NH3 will cause harm to human health. Accordingly, the response of the In2O3/PANI-2 sensor to 50 ppm, 30 ppm and 10 ppm were investigated. As shown in Figure 7, the response of the In2O3/PANI-2 sensor to low concentration (10–50 ppm) NH3 was 0.12, 0.48 and 0.94, respectively. Thus it can be seen the In2O3/PANI-2 sensor had good response performance towards low concentrations of NH3.
![[2190-4286-7-122-7]](/bjnano/content/figures/2190-4286-7-122-7.png?scale=2.0&max-width=1024&background=FFFFFF)
Figure 7: Dynamic response of In2O3/ PANI-2 sensor towards 50 ppm, 30 ppm and 10 ppm NH3 at room temperature.
Figure 7: Dynamic response of In2O3/ PANI-2 sensor towards 50 ppm, 30 ppm and 10 ppm NH3 at room temperature.
The cross-response test was used to evaluate the selectivity of In2O3/PANI-2 nanofibers sensor. Figure 8 shows the dynamic response of In2O3/PANI-2 nanofibers sensor to methanol, ethanol, acetone and ammonia at a concentration of 1000 ppm. It is obvious that the In2O3/PANI-2 nanofibers sensor was almost insensitive to methanol, ethanol and acetone vapors. According to the test results, it can be concluded that In2O3/PANI-2 nanofibers sensor exhibited unique selectivity to ammonia. A possible mechanism for the selectivity to NH3 is the chemisorption of NH3 on PANI in In2O3/PANI-2 forming ammonium [32]. Besides, the different gases show different electron affinity values [33], and the varying sensitivity of In2O3/PANI-2 nanofibers to different gases may be explained by this.
![[2190-4286-7-122-8]](/bjnano/content/figures/2190-4286-7-122-8.png?scale=2.0&max-width=1024&background=FFFFFF)
Figure 8: Cross-response curves of In2O3/PANI-2 nanofibers sensor to 1000 ppm methanol, ethanol, acetone and ammonia.
Figure 8: Cross-response curves of In2O3/PANI-2 nanofibers sensor to 1000 ppm methanol, ethanol, acetone and ...
In2O3/PANI-2 nanofibers sensor was exposed to 1000 ppm ammonia for five times to investigate the repeatability and reversibility. As shown in Figure 9, the recovery of the In2O3/PANI-2 nanofibers sensor could not fully return to the initial state, and there was a baseline drift of 4% after the first exposure to NH3. This bias was smaller than the results in other reports [34-36]. On the other hand, the response of this sensor slightly decreased with the increasing number of tests. The final response reached 47.42, which was about 89% of the first test. Hence, the In2O3/PANI-2 nanofibers sensor showed good repeatability and reversibility.
![[2190-4286-7-122-9]](/bjnano/content/figures/2190-4286-7-122-9.png?scale=2.0&max-width=1024&background=FFFFFF)
Figure 9: Sensing repeatability and reversibility of In2O3/PANI-2 nanofibers sensor to 1000 ppm NH3 vapor.
Figure 9: Sensing repeatability and reversibility of In2O3/PANI-2 nanofibers sensor to 1000 ppm NH3 vapor.
Gas sensing mechanism
It is well known that the chemical sensors are composed of two parts, an active part and a transduction part, whose function is sensitive to gas analytes and produces a signal that is related to the concentration [19]. In this study, PANI acted as an active element which can react with NH3 resulting in the transformation of PANI from emeraldine salt to emeraldine base by dedoping. The reaction between PANI and NH3 can be described as follows:
![[Graphic 1]](/bjnano/content/inline/2190-4286-7-122-i1.svg?max-width=637&scale=1.18182)
The absorption of NH3 caused the deprotonation of the N–H+ site of the emeraldine salt, leading to a significantly increased resistance [37,38]. When this reaction reached equilibrium in NH3 atmosphere, the resistance of the PANI-based sensor maintained a constant value. When the sensor was exposed to air, NH3 is volatilized and the resistance of the PANI composite nanofibers is reduced. Therefore, due to the unique mechanism, PANI (emeraldine salt) based sensors exhibited a great selectivity to NH3.
As the I–V characteristics show, it is confirmed that p–n heterojunctions had been formed between PANI and In2O3 nanofibers, in which PANI is a p-type semiconductor and In2O3 nanofibers presents as an n-type semiconductor [21,27,34]. The changes of the depletion layer of the p–n heterojuction are shown in Figure 10. The width of the depletion section is related to the doping concentration [39]. With low concentration doping, it needs a sufficiently thick depletion layer to provide impurity atoms to build an internal field. Accordingly, on exposure to NH3, the protons from PANI are transferred to the NH3 molecules, which results in a widening of the depletion layer in the PANI section [40]. Simultaneously, the variation of the PANI region width would have effects on the width of the In2O3 region and on the p–n junction. The electrons of In2O3 and holes of PANI move in opposite directions until the new Fermi level (EF-NH3) reaches equilibrium. In this process, the electron transfer between the n-type In2O3 and p-type PANI is obstructed due to the potential barrier. Thus the depletion layer between PANI and In2O3 becomes wider and the resistance of the material increases [27,41,42]. According to the response definition (S = (Ri − R0)/R0), the increase in resistance attributed to the p–n junction increases the sensitivity of composite nanofibers sensors. In addition, the sensitivity of the composite gas sensor materials is also connected to the mass ratio of In2O3 and aniline.
![[2190-4286-7-122-10]](/bjnano/content/figures/2190-4286-7-122-10.png?scale=2.0&max-width=1024&background=FFFFFF)
Figure 10: Schematic of p–n junction of In2O3/PANI nanofibers and its potential energy barrier change when exposed to NH3.
Figure 10: Schematic of p–n junction of In2O3/PANI nanofibers and its potential energy barrier change when exp...
Because of the smaller amount of polyaniline, which acts as active material in this composite system, the In2O3/PANI-1 gas sensor showed a lower sensitivity. However, for the In2O3/PANI-3 gas sensor, the external surface of In2O3 nanofibers was coated with excess polyaniline, yielding a gas sensing perfomance similar to that of pure PANI. Even the response of In2O3/PANI-3 to 100 ppm and 500 ppm NH3 was less than that of pure PANI. The p–n junction of In2O3 and PANI in In2O3/PANI-3 does not work efficiently. In general, the characteristic of the gas sensitive material response was discrete instead of ideally linear [34,36,43]. For In2O3/PANI-3 and pure PANI, the characteristic responses were similar. Therefore, it was possible that the response of In2O3/PANI-3 were less than that of pure PANI, especially towards lower concentrations of NH3. In this study, when the mass ratio of In2O3 to aniline was 1:2, the gas sensor material exhibited optimum performance in detecting NH3.
Conclusion
In2O3/PANI nanofibers with reliable sensing properties towards NH3 were synthesized by electrospinning, calcination and in situ polymerization. The gas sensors based on In2O3/PANI nanofibers exhibited a higher sensitivity than pure PANI. The In2O3/PANI-2 nanofiber sensor exhibited the best sensitivity to NH3 vapor at room temperature, and this sensor was further investigated for its selectivity by interfering with methanol, ethanol and acetone vapors. The results indicated that the In2O3/PANI-2 nanofiber sensor had excellent selectivity, good repeatability and reversibility. The enhancement of gas sensing performance of In2O3/PANI nanofiber sensor may be attributed to formation of a p–n junction between In2O3 and PANI, which existence is confirmed by the I–V characteristics.
References
-
Tang, Y.-L.; Li, Z.-J.; Ma, J.-Y.; Su, H.-Q.; Guo, Y.-J.; Wang, L.; Du, B.; Chen, J.-J.; Zhou, W.; Yu, Q.-K.; Zu, X.-T. J. Hazard. Mater. 2014, 280, 127–133. doi:10.1016/j.jhazmat.2014.08.001
Return to citation in text: [1] -
Wu, Z.; Chen, X.; Zhu, S.; Zhou, Z.; Yao, Y.; Quan, W.; Liu, B. Sens. Actuators, B 2013, 178, 485–493. doi:10.1016/j.snb.2013.01.014
Return to citation in text: [1] -
Na, K.; Song, C.; Switzer, C.; Cocker, D. R., III. Environ. Sci. Technol. 2007, 41, 6096–6102. doi:10.1021/es061956y
Return to citation in text: [1] -
Jabłońska, M.; Palkovits, R. Appl. Catal., B 2016, 181, 332–351. doi:10.1016/j.apcatb.2015.07.017
Return to citation in text: [1] [2] -
Swotinsky, R. B.; Chase, K. H. Am. J. Ind. Med. 1990, 17, 515–521. doi:10.1002/ajim.4700170409
Return to citation in text: [1] -
Park, S.-J.; Jin, S.-Y. J. Colloid Interface Sci. 2005, 286, 417–419. doi:10.1016/j.jcis.2005.01.043
Return to citation in text: [1] -
Yoo, K.-P.; Kwon, K.-H.; Mi, N.-K.; Lee, M. J.; Lee, C. J. Sens. Actuators, B 2009, 143, 333–340. doi:10.1016/j.snb.2009.09.029
Return to citation in text: [1] -
Li, C.; Zhang, D.; Lei, B.; Han, S.; Liu, X.; Zhou, C. J. Phys. Chem. B 2003, 107, 12451–12455. doi:10.1021/jp0361531
Return to citation in text: [1] -
Biskupski, D.; Herbig, B.; Schottner, G.; Moos, R. Sens. Actuators, B 2011, 153, 329–334. doi:10.1016/j.snb.2010.10.029
Return to citation in text: [1] -
Shahabuddin, M.; Sharma, A.; Kumar, J.; Tomar, M.; Umar, A.; Gupta, V. Sens. Actuators, B 2014, 194, 410–418. doi:10.1016/j.snb.2013.12.097
Return to citation in text: [1] -
Renganathan, B.; Sastikumar, D.; Gobi, G.; Yogamalar, N. R.; Bose, A. C. Opt. Laser Technol. 2011, 43, 1398–1404. doi:10.1016/j.optlastec.2011.04.008
Return to citation in text: [1] -
Nguyen, D. D.; Dang, D. V.; Nguyen, D. C. Adv. Nat. Sci.: Nanosci. Nanotechnol. 2015, 6, 035006. doi:10.1088/2043-6262/6/3/035006
Return to citation in text: [1] -
Zhang, D.; Liu, Z.; Li, C.; Tang, T.; Liu, X.; Han, S.; Lei, B.; Zhou, C. Nano Lett. 2004, 4, 1919–1924. doi:10.1021/nl0489283
Return to citation in text: [1] -
Miller, D. R.; Akbar, S. A.; Morris, P. A. Sens. Actuators, B 2014, 204, 250–272. doi:10.1016/j.snb.2014.07.074
Return to citation in text: [1] -
Zhan, Z.; Jiang, D.; Xu, J. Mater. Chem. Phys. 2005, 90, 250–254. doi:10.1016/j.matchemphys.2004.01.043
Return to citation in text: [1] -
Liang, X.; Jin, G.; Liu, F.; Zhang, X.; An, S.; Ma, J.; Lu, G. Ceram. Int. 2015, 41, 13780–13787. doi:10.1016/j.ceramint.2015.08.060
Return to citation in text: [1] [2] -
Li, Z.; Fan, Y.; Zhan, J. Eur. J. Inorg. Chem. 2010, 2010, 3348–3353. doi:10.1002/ejic.201000313
Return to citation in text: [1] -
Li, H.; Liu, Y.; Luo, L.; Tan, Y.; Zhang, Q.; Li, K. Mater. Sci. Eng., C 2016, 59, 438–444. doi:10.1016/j.msec.2015.10.036
Return to citation in text: [1] -
Fratoddi, I.; Venditti, I.; Cametti, C.; Russo, M. V. Sens. Actuators, B 2015, 220, 534–548. doi:10.1016/j.snb.2015.05.107
Return to citation in text: [1] [2] -
Lakard, B.; Carquigny, S.; Segut, O.; Patios, T.; Lakard, S. Metals (Basel, Switz.) 2015, 5, 1371–1386. doi:10.3390/met5031371
Return to citation in text: [1] -
Gong, J.; Li, Y.; Hu, Z.; Zhou, Z.; Deng, Y. J. Phys. Chem. C 2010, 114, 9970–9974. doi:10.1021/jp100685r
Return to citation in text: [1] [2] [3] -
Timmer, B.; Olthuis, W.; van den Berg, A. Sens. Actuators, B 2005, 107, 666–677. doi:10.1016/j.snb.2004.11.054
Return to citation in text: [1] -
Pawar, S. G.; Chougule, M. A.; Patil, S. L.; Raut, B. T.; Godse, P. R.; Sen, S.; Patil, V. B. IEEE Sens. J. 2011, 11, 3417–3423. doi:10.1109/JSEN.2011.2160392
Return to citation in text: [1] -
Nasirian, S.; Milani, M. H. Appl. Surf. Sci. 2015, 328, 395–404. doi:10.1016/j.apsusc.2014.12.051
Return to citation in text: [1] -
Sadek, A. Z.; Wlodarski, W.; Shin, K.; Kaner, R. B.; Kalantar-zadeh, K. Synth. Met. 2008, 158, 29–32. doi:10.1016/j.synthmet.2007.11.008
Return to citation in text: [1] -
Betty, C. A.; Choudhury, S.; Arora, S. Sens. Actuators, B 2015, 220, 288–294. doi:10.1016/j.snb.2015.05.074
Return to citation in text: [1] -
Pang, Z.; Fu, J.; Luo, L.; Huang, F.; Wei, Q. Colloids Surf., A 2014, 461, 113–118. doi:10.1016/j.colsurfa.2014.07.038
Return to citation in text: [1] [2] [3] -
Abaci, S.; Nessark, B.; Riahi, F. Ionics 2014, 20, 1693–1702. doi:10.1007/s11581-014-1129-9
Return to citation in text: [1] [2] -
Ameen, S.; Shaheer, A. M.; Ansari, S. G.; Yang, O.-B.; Shin, H.-S. Superlattices Microstruct. 2009, 46, 872–880. doi:10.1016/j.spmi.2009.09.007
Return to citation in text: [1] [2] -
Li, Y.; Gong, J.; McCune, M.; He, G.; Deng, Y. Synth. Met. 2010, 160, 499–503. doi:10.1016/j.synthmet.2009.11.037
Return to citation in text: [1] -
Pandey, S. S.; Rikitake, K.; Takashima, W.; Kaneto, K. Curr. Appl. Phys. 2003, 3, 107–113. doi:10.1016/S1567-1739(02)00179-7
Return to citation in text: [1] -
Tai, H.; Xu, X.; Ye, Z.; Liu, C.; Xie, G.; Jiang, Y. Chem. Phys. Lett. 2015, 621, 58–64. doi:10.1016/j.cplett.2014.12.052
Return to citation in text: [1] -
Pawar, S. G.; Chougule, M. A.; Shashwati, S.; Patil, V. B. J. Appl. Polym. Sci. 2012, 125, 1418–1424. doi:10.1002/app.35468
Return to citation in text: [1] -
Wang, L.; Huang, H.; Xiao, S.; Cai, D.; Liu, Y.; Liu, B.; Wang, D.; Wang, C.; Li, H.; Wang, Y.; Li, Q.; Wang, T. ACS Appl. Mater. Interfaces 2014, 6, 14131–14140. doi:10.1021/am503286h
Return to citation in text: [1] [2] [3] -
Matsuguchi, M.; Asahi, T. Sens. Actuators, B 2011, 160, 999–1004. doi:10.1016/j.snb.2011.09.017
Return to citation in text: [1] -
Joulazadeh, M.; Navarchian, A. H. Synth. Met. 2015, 210, 404–411. doi:10.1016/j.synthmet.2015.10.026
Return to citation in text: [1] [2] -
Zhang, Y.; Kim, J. J.; Chen, D.; Tuller, L. H.; Rutledge, C. C. Adv. Funct. Mater. 2014, 24, 4005–4014. doi:10.1002/adfm.201400185
Return to citation in text: [1] -
Srinives, S.; Sarkar, T.; Mulchandani, A. Electroanalysis 2013, 25, 1439–1445. doi:10.1002/elan.201300015
Return to citation in text: [1] -
Mane, A. T.; Navale, S. T.; Patil, V. B. Org. Electron. 2015, 19, 15–25. doi:10.1016/j.orgel.2015.01.018
Return to citation in text: [1] -
Bai, S.; Tian, Y.; Cui, M.; Sun, J.; Tian, Y.; Luo, R.; Chen, A.; Li, D. Sens. Actuators, B 2016, 226, 540–547. doi:10.1016/j.snb.2015.12.007
Return to citation in text: [1] -
Xu, H.; Ju, D.; Li, W.; Gong, H.; Zhang, J.; Wang, J.; Cao, B. Sens. Actuators, B 2016, 224, 654–660. doi:10.1016/j.snb.2015.10.076
Return to citation in text: [1] -
Bai, S.; Ma, Y.; Luo, R.; Chen, A.; Li, D. RSC Adv. 2016, 6, 2687–2694. doi:10.1039/C5RA20843B
Return to citation in text: [1] -
Li, Y.; Ban, H.; Yang, M. Sens. Actuators, B 2016, 224, 449–457. doi:10.1016/j.snb.2015.10.078
Return to citation in text: [1]
| 21. | Gong, J.; Li, Y.; Hu, Z.; Zhou, Z.; Deng, Y. J. Phys. Chem. C 2010, 114, 9970–9974. doi:10.1021/jp100685r |
| 27. | Pang, Z.; Fu, J.; Luo, L.; Huang, F.; Wei, Q. Colloids Surf., A 2014, 461, 113–118. doi:10.1016/j.colsurfa.2014.07.038 |
| 34. | Wang, L.; Huang, H.; Xiao, S.; Cai, D.; Liu, Y.; Liu, B.; Wang, D.; Wang, C.; Li, H.; Wang, Y.; Li, Q.; Wang, T. ACS Appl. Mater. Interfaces 2014, 6, 14131–14140. doi:10.1021/am503286h |
| 39. | Mane, A. T.; Navale, S. T.; Patil, V. B. Org. Electron. 2015, 19, 15–25. doi:10.1016/j.orgel.2015.01.018 |
| 40. | Bai, S.; Tian, Y.; Cui, M.; Sun, J.; Tian, Y.; Luo, R.; Chen, A.; Li, D. Sens. Actuators, B 2016, 226, 540–547. doi:10.1016/j.snb.2015.12.007 |
| 1. | Tang, Y.-L.; Li, Z.-J.; Ma, J.-Y.; Su, H.-Q.; Guo, Y.-J.; Wang, L.; Du, B.; Chen, J.-J.; Zhou, W.; Yu, Q.-K.; Zu, X.-T. J. Hazard. Mater. 2014, 280, 127–133. doi:10.1016/j.jhazmat.2014.08.001 |
| 8. | Li, C.; Zhang, D.; Lei, B.; Han, S.; Liu, X.; Zhou, C. J. Phys. Chem. B 2003, 107, 12451–12455. doi:10.1021/jp0361531 |
| 18. | Li, H.; Liu, Y.; Luo, L.; Tan, Y.; Zhang, Q.; Li, K. Mater. Sci. Eng., C 2016, 59, 438–444. doi:10.1016/j.msec.2015.10.036 |
| 5. | Swotinsky, R. B.; Chase, K. H. Am. J. Ind. Med. 1990, 17, 515–521. doi:10.1002/ajim.4700170409 |
| 6. | Park, S.-J.; Jin, S.-Y. J. Colloid Interface Sci. 2005, 286, 417–419. doi:10.1016/j.jcis.2005.01.043 |
| 7. | Yoo, K.-P.; Kwon, K.-H.; Mi, N.-K.; Lee, M. J.; Lee, C. J. Sens. Actuators, B 2009, 143, 333–340. doi:10.1016/j.snb.2009.09.029 |
| 19. | Fratoddi, I.; Venditti, I.; Cametti, C.; Russo, M. V. Sens. Actuators, B 2015, 220, 534–548. doi:10.1016/j.snb.2015.05.107 |
| 20. | Lakard, B.; Carquigny, S.; Segut, O.; Patios, T.; Lakard, S. Metals (Basel, Switz.) 2015, 5, 1371–1386. doi:10.3390/met5031371 |
| 4. | Jabłońska, M.; Palkovits, R. Appl. Catal., B 2016, 181, 332–351. doi:10.1016/j.apcatb.2015.07.017 |
| 16. | Liang, X.; Jin, G.; Liu, F.; Zhang, X.; An, S.; Ma, J.; Lu, G. Ceram. Int. 2015, 41, 13780–13787. doi:10.1016/j.ceramint.2015.08.060 |
| 2. | Wu, Z.; Chen, X.; Zhu, S.; Zhou, Z.; Yao, Y.; Quan, W.; Liu, B. Sens. Actuators, B 2013, 178, 485–493. doi:10.1016/j.snb.2013.01.014 |
| 3. | Na, K.; Song, C.; Switzer, C.; Cocker, D. R., III. Environ. Sci. Technol. 2007, 41, 6096–6102. doi:10.1021/es061956y |
| 4. | Jabłońska, M.; Palkovits, R. Appl. Catal., B 2016, 181, 332–351. doi:10.1016/j.apcatb.2015.07.017 |
| 17. | Li, Z.; Fan, Y.; Zhan, J. Eur. J. Inorg. Chem. 2010, 2010, 3348–3353. doi:10.1002/ejic.201000313 |
| 12. | Nguyen, D. D.; Dang, D. V.; Nguyen, D. C. Adv. Nat. Sci.: Nanosci. Nanotechnol. 2015, 6, 035006. doi:10.1088/2043-6262/6/3/035006 |
| 14. | Miller, D. R.; Akbar, S. A.; Morris, P. A. Sens. Actuators, B 2014, 204, 250–272. doi:10.1016/j.snb.2014.07.074 |
| 11. | Renganathan, B.; Sastikumar, D.; Gobi, G.; Yogamalar, N. R.; Bose, A. C. Opt. Laser Technol. 2011, 43, 1398–1404. doi:10.1016/j.optlastec.2011.04.008 |
| 15. | Zhan, Z.; Jiang, D.; Xu, J. Mater. Chem. Phys. 2005, 90, 250–254. doi:10.1016/j.matchemphys.2004.01.043 |
| 10. | Shahabuddin, M.; Sharma, A.; Kumar, J.; Tomar, M.; Umar, A.; Gupta, V. Sens. Actuators, B 2014, 194, 410–418. doi:10.1016/j.snb.2013.12.097 |
| 27. | Pang, Z.; Fu, J.; Luo, L.; Huang, F.; Wei, Q. Colloids Surf., A 2014, 461, 113–118. doi:10.1016/j.colsurfa.2014.07.038 |
| 41. | Xu, H.; Ju, D.; Li, W.; Gong, H.; Zhang, J.; Wang, J.; Cao, B. Sens. Actuators, B 2016, 224, 654–660. doi:10.1016/j.snb.2015.10.076 |
| 42. | Bai, S.; Ma, Y.; Luo, R.; Chen, A.; Li, D. RSC Adv. 2016, 6, 2687–2694. doi:10.1039/C5RA20843B |
| 9. | Biskupski, D.; Herbig, B.; Schottner, G.; Moos, R. Sens. Actuators, B 2011, 153, 329–334. doi:10.1016/j.snb.2010.10.029 |
| 13. | Zhang, D.; Liu, Z.; Li, C.; Tang, T.; Liu, X.; Han, S.; Lei, B.; Zhou, C. Nano Lett. 2004, 4, 1919–1924. doi:10.1021/nl0489283 |
| 34. | Wang, L.; Huang, H.; Xiao, S.; Cai, D.; Liu, Y.; Liu, B.; Wang, D.; Wang, C.; Li, H.; Wang, Y.; Li, Q.; Wang, T. ACS Appl. Mater. Interfaces 2014, 6, 14131–14140. doi:10.1021/am503286h |
| 36. | Joulazadeh, M.; Navarchian, A. H. Synth. Met. 2015, 210, 404–411. doi:10.1016/j.synthmet.2015.10.026 |
| 43. | Li, Y.; Ban, H.; Yang, M. Sens. Actuators, B 2016, 224, 449–457. doi:10.1016/j.snb.2015.10.078 |
| 16. | Liang, X.; Jin, G.; Liu, F.; Zhang, X.; An, S.; Ma, J.; Lu, G. Ceram. Int. 2015, 41, 13780–13787. doi:10.1016/j.ceramint.2015.08.060 |
| 21. | Gong, J.; Li, Y.; Hu, Z.; Zhou, Z.; Deng, Y. J. Phys. Chem. C 2010, 114, 9970–9974. doi:10.1021/jp100685r |
| 22. | Timmer, B.; Olthuis, W.; van den Berg, A. Sens. Actuators, B 2005, 107, 666–677. doi:10.1016/j.snb.2004.11.054 |
| 21. | Gong, J.; Li, Y.; Hu, Z.; Zhou, Z.; Deng, Y. J. Phys. Chem. C 2010, 114, 9970–9974. doi:10.1021/jp100685r |
| 23. | Pawar, S. G.; Chougule, M. A.; Patil, S. L.; Raut, B. T.; Godse, P. R.; Sen, S.; Patil, V. B. IEEE Sens. J. 2011, 11, 3417–3423. doi:10.1109/JSEN.2011.2160392 |
| 24. | Nasirian, S.; Milani, M. H. Appl. Surf. Sci. 2015, 328, 395–404. doi:10.1016/j.apsusc.2014.12.051 |
| 25. | Sadek, A. Z.; Wlodarski, W.; Shin, K.; Kaner, R. B.; Kalantar-zadeh, K. Synth. Met. 2008, 158, 29–32. doi:10.1016/j.synthmet.2007.11.008 |
| 26. | Betty, C. A.; Choudhury, S.; Arora, S. Sens. Actuators, B 2015, 220, 288–294. doi:10.1016/j.snb.2015.05.074 |
| 27. | Pang, Z.; Fu, J.; Luo, L.; Huang, F.; Wei, Q. Colloids Surf., A 2014, 461, 113–118. doi:10.1016/j.colsurfa.2014.07.038 |
| 19. | Fratoddi, I.; Venditti, I.; Cametti, C.; Russo, M. V. Sens. Actuators, B 2015, 220, 534–548. doi:10.1016/j.snb.2015.05.107 |
| 37. | Zhang, Y.; Kim, J. J.; Chen, D.; Tuller, L. H.; Rutledge, C. C. Adv. Funct. Mater. 2014, 24, 4005–4014. doi:10.1002/adfm.201400185 |
| 38. | Srinives, S.; Sarkar, T.; Mulchandani, A. Electroanalysis 2013, 25, 1439–1445. doi:10.1002/elan.201300015 |
| 33. | Pawar, S. G.; Chougule, M. A.; Shashwati, S.; Patil, V. B. J. Appl. Polym. Sci. 2012, 125, 1418–1424. doi:10.1002/app.35468 |
| 34. | Wang, L.; Huang, H.; Xiao, S.; Cai, D.; Liu, Y.; Liu, B.; Wang, D.; Wang, C.; Li, H.; Wang, Y.; Li, Q.; Wang, T. ACS Appl. Mater. Interfaces 2014, 6, 14131–14140. doi:10.1021/am503286h |
| 35. | Matsuguchi, M.; Asahi, T. Sens. Actuators, B 2011, 160, 999–1004. doi:10.1016/j.snb.2011.09.017 |
| 36. | Joulazadeh, M.; Navarchian, A. H. Synth. Met. 2015, 210, 404–411. doi:10.1016/j.synthmet.2015.10.026 |
| 31. | Pandey, S. S.; Rikitake, K.; Takashima, W.; Kaneto, K. Curr. Appl. Phys. 2003, 3, 107–113. doi:10.1016/S1567-1739(02)00179-7 |
| 32. | Tai, H.; Xu, X.; Ye, Z.; Liu, C.; Xie, G.; Jiang, Y. Chem. Phys. Lett. 2015, 621, 58–64. doi:10.1016/j.cplett.2014.12.052 |
| 28. | Abaci, S.; Nessark, B.; Riahi, F. Ionics 2014, 20, 1693–1702. doi:10.1007/s11581-014-1129-9 |
| 29. | Ameen, S.; Shaheer, A. M.; Ansari, S. G.; Yang, O.-B.; Shin, H.-S. Superlattices Microstruct. 2009, 46, 872–880. doi:10.1016/j.spmi.2009.09.007 |
| 28. | Abaci, S.; Nessark, B.; Riahi, F. Ionics 2014, 20, 1693–1702. doi:10.1007/s11581-014-1129-9 |
| 29. | Ameen, S.; Shaheer, A. M.; Ansari, S. G.; Yang, O.-B.; Shin, H.-S. Superlattices Microstruct. 2009, 46, 872–880. doi:10.1016/j.spmi.2009.09.007 |
| 30. | Li, Y.; Gong, J.; McCune, M.; He, G.; Deng, Y. Synth. Met. 2010, 160, 499–503. doi:10.1016/j.synthmet.2009.11.037 |
© 2016 Nie et al.; licensee Beilstein-Institut.
This is an Open Access article under the terms of the Creative Commons Attribution License (http://creativecommons.org/licenses/by/4.0), which permits unrestricted use, distribution, and reproduction in any medium, provided the original work is properly cited.
The license is subject to the Beilstein Journal of Nanotechnology terms and conditions: (http://www.beilstein-journals.org/bjnano)