Supporting Information
|
Supporting Information File 1:
Additional experimental data.
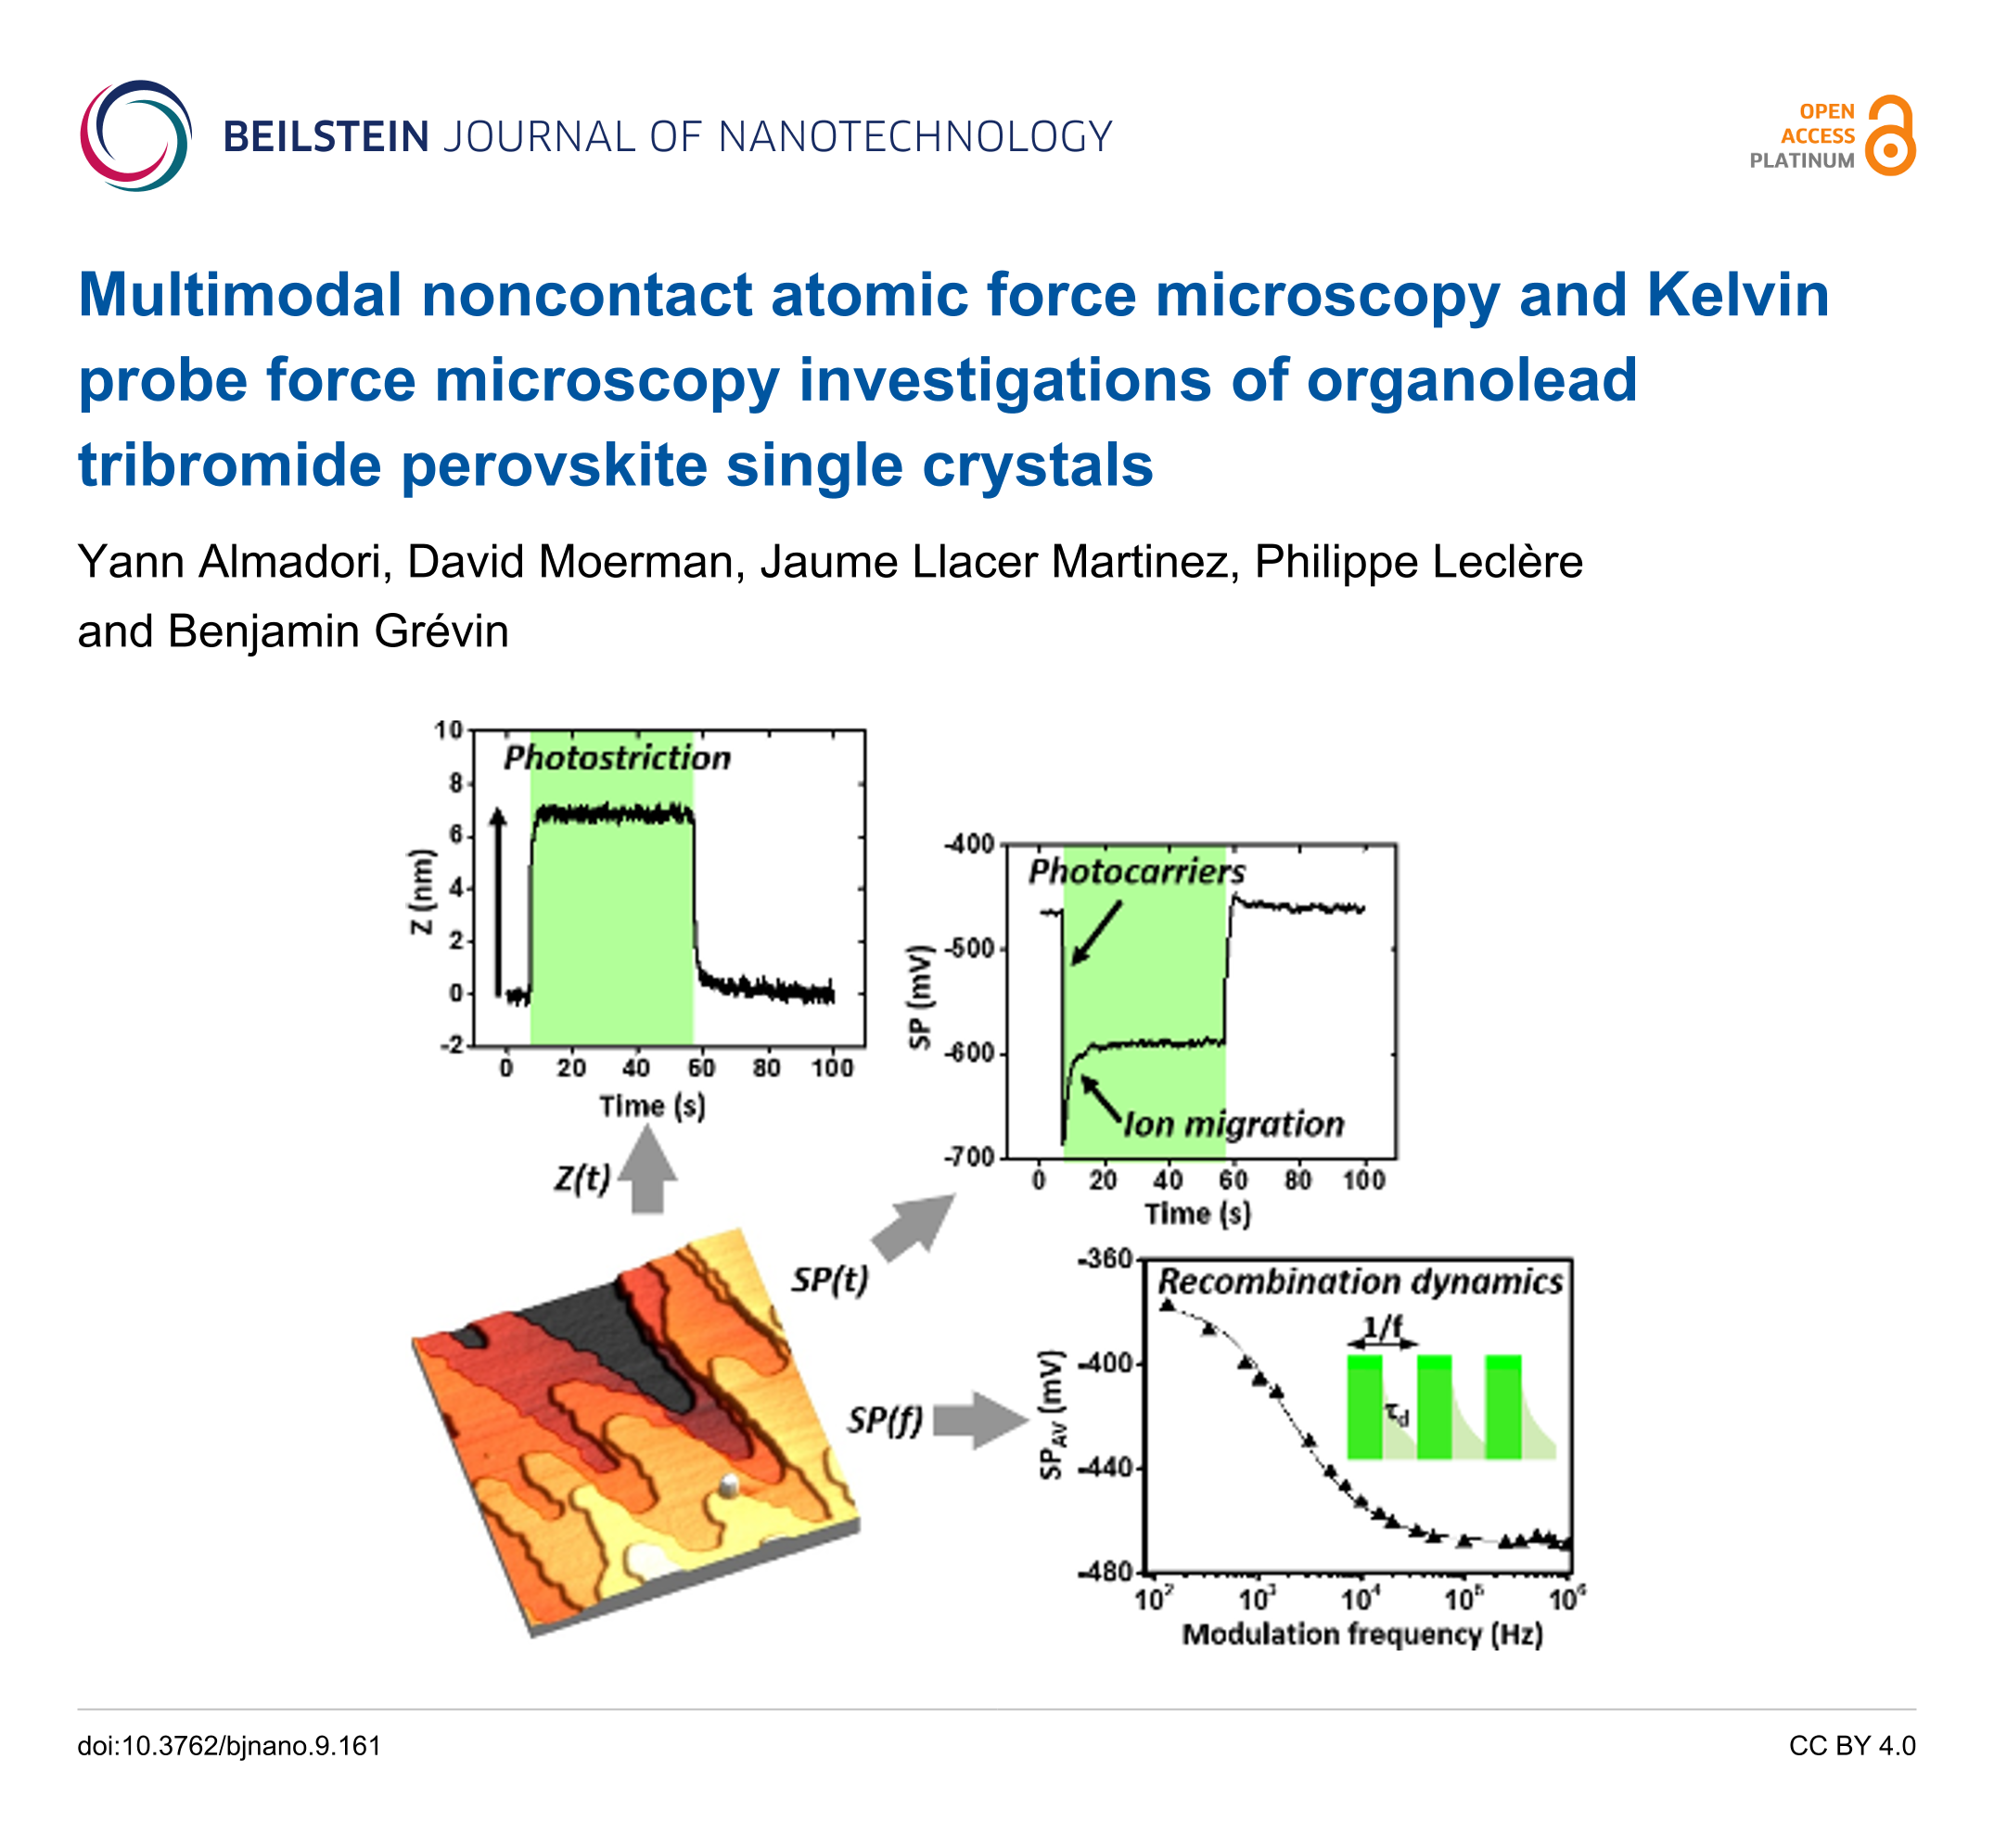
Surface potential time evolution recorded during several successive illumination sequences. Measurements of the cantilever frequency shift as a function of the optical power and of the z variation as a function of the frequency shift set point. Curves of the relative height and surface potential recorded during illumination sequences on a highly oriented pyrolytic graphite substrate and on the MAPbBr3 single crystal for various optical powers. Photostrictive response and fast component of the surface photovoltage as a function of the optical power for 685 nm, 515 nm and 405 nm illumination. Curves of the SPV time decay and photostriction as a function of the optical power. |
||
| Format: PDF | Size: 220.2 KB | Download |
Cite the Following Article
Multimodal noncontact atomic force microscopy and Kelvin probe force microscopy investigations of organolead tribromide perovskite single crystals
Yann Almadori, David Moerman, Jaume Llacer Martinez, Philippe Leclère and Benjamin Grévin
Beilstein J. Nanotechnol. 2018, 9, 1695–1704.
https://doi.org/10.3762/bjnano.9.161
How to Cite
Almadori, Y.; Moerman, D.; Martinez, J. L.; Leclère, P.; Grévin, B. Beilstein J. Nanotechnol. 2018, 9, 1695–1704. doi:10.3762/bjnano.9.161
Download Citation
Citation data can be downloaded as file using the "Download" button or used for copy/paste from the text window
below.
Citation data in RIS format can be imported by all major citation management software, including EndNote,
ProCite, RefWorks, and Zotero.
Presentation Graphic
| Picture with graphical abstract, title and authors for social media postings and presentations. | ||
| Format: PNG | Size: 767.1 KB | Download |
Citations to This Article
Up to 20 of the most recent references are displayed here.
Scholarly Works
- Darr, H. R.; Deniz, E.; Leite, M. S. Nanoscale imaging of local electrical behavior in halide perovskites. Journal of Materials Research 2026, 41, 285–303. doi:10.1557/s43578-025-01764-8
- Qu, Z.; Chen, J.; Xue, B.; Xiao, S. Probing surfaces and interfaces of halide perovskites: from atomic mapping to optoelectronic properties. EES Solar 2026. doi:10.1039/d6el00030d
- Li, R.; Wang, Y. Y.; Weng, S.; Shahriar, R.; Cronin, S. B. Monitoring photovoltages produced at semiconductor/liquid interfaces using in situ surface-enhanced Raman scattering (SERS) spectroscopy. Journal of Materials Chemistry A 2025, 13, 26637–26646. doi:10.1039/d5ta02914g
- Bahnmüller, U. J.; Krysiak, Y.; Seewald, T.; Yalçinkaya, Y.; Pluta, D.; Schmidt‐Mende, L.; Weber, S. A. L.; Polarz, S. One‐Step Aerosol Synthesis of Thiocyanate Passivated Hybrid Perovskite Microcrystals: Impact of (Pseudo‐)Halide Additives on Crystallization and Access to a Novel Binary Model. Particle & Particle Systems Characterization 2024, 42. doi:10.1002/ppsc.202400132
- Mejaouri, S.; Cacovich, S.; Baranek, P.; Bérenguier, B.; Zimmermann, I.; Yaiche, A.; Loisnard, D.; Rousset, J.; Collin, S. Humidity-Induced Degradation Processes of Halide Perovskites Unveiled by Correlative Analytical Electron Microscopy. Small methods 2023, 8, e2300901. doi:10.1002/smtd.202300901
- Huang, Q.; Xu, Y.; Peng, G.; Cai, K.; Zhou, F.; Jin, Z.; Wang, Y. Enhanced On–Off Ratio for Ni(OH)2·0.75H2O-MAPbBr3-Based Photodetectors. ACS Applied Electronic Materials 2023, 5, 3093–3101. doi:10.1021/acsaelm.3c00167
- Alosaimi, G.; Huang, C.-Y.; Sharma, P.; Wu, T.; Seidel, J. Morphology-Dependent Charge Carrier Dynamics and Ion Migration Behavior of CsPbBr3 Halide Perovskite Quantum Dot Films. Small (Weinheim an der Bergstrasse, Germany) 2023, 19, e2207220. doi:10.1002/smll.202207220
- Sahare, S.; Ghoderao, P.; Yin, P.; Saleemi, A. S.; Lee, S.-L.; Chan, Y.; Zhang, H. An Assessment of MXenes through Scanning Probe Microscopy. Small methods 2022, 6, e2101599. doi:10.1002/smtd.202101599
- Tailor, N. K.; Mahapatra, A.; Kalam, A.; Pandey, M.; Yadav, P.; Satapathi, S. Influence of the A-site cation on hysteresis and ion migration in lead-free perovskite single crystals. Physical Review Materials 2022, 6. doi:10.1103/physrevmaterials.6.045401
- Kumar, V.; Nisika; Kumar, M. Temporal-spatial-energy resolved advance multidimensional techniques to probe photovoltaic materials from atomistic viewpoint for next-generation energy solutions. Energy & Environmental Science 2021, 14, 4760–4802. doi:10.1039/d1ee01165k
- He, D.; Xu, X.; Liang, Z.; Niu, Y.; Sun, Y.; Gavin, T.; Falaras, P.; Hu, L. Defect passivation and humidity protection for perovskite solar cells enabled by 1-dodecanethiol. Journal of Materials Chemistry C 2021, 9, 9584–9591. doi:10.1039/d1tc01720a
- Yao, W.; Fang, S.; Wang, Y.; Hu, Z.; Huang, L.; Liu, X.; Jiang, T.; Zhang, J.; Wang, J.; Zhu, Y. Suppression of hysteresis in all-inorganic perovskite solar cells by the incorporation of PCBM. Applied Physics Letters 2021, 118, 123502. doi:10.1063/5.0042663
- Kaja, K.; Mariolle, D.; Chevalier, N.; Naja, A.; Jouiad, M. Sub-10 nm spatial resolution for electrical properties measurements using bimodal excitation in electric force microscopy. The Review of scientific instruments 2021, 92, 023703. doi:10.1063/5.0038335
- Gallet, T.; Poeira, R. G.; Lanzoni, E. M.; Abzieher, T.; Paetzold, U. W.; Redinger, A. Co-evaporation of CH3NH3PbI3: How Growth Conditions Impact Phase Purity, Photostriction, and Intrinsic Stability. ACS applied materials & interfaces 2021, 13, 2642–2653. doi:10.1021/acsami.0c19038
- Toth, D.; Hailegnaw, B.; Richheimer, F.; Castro, F. A.; Kienberger, F.; Scharber, M. C.; Wood, S.; Gramse, G. Nanoscale Charge Accumulation and Its Effect on Carrier Dynamics in Tri-cation Perovskite Structures. ACS applied materials & interfaces 2020, 12, 48057–48066. doi:10.1021/acsami.0c10641
- Lansakara, T. I.; Tong, F.; Bardeen, C. J.; Tivanski, A. V. Mechanical Properties and Photomechanical Fatigue of Macro- and Nanodimensional Diarylethene Molecular Crystals. Nano letters 2020, 20, 6744–6749. doi:10.1021/acs.nanolett.0c02631
- Sahare, S.; Ghoderao, P.; Khan, S. B.; Chan, Y.; Lee, S.-L. Recent progress in hybrid perovskite solar cells through scanning tunneling microscopy and spectroscopy. Nanoscale 2020, 12, 15970–15992. doi:10.1039/d0nr03499a
- Yi, H.; Duan, L.; Haque, F.; Bing, J.; Zheng, J.; Yang, Y.; Mo, A. C.-h.; Zhang, Y.; Xu, C.; Conibeer, G.; Uddin, A. Thiocyanate assisted nucleation for high performance mix-cation perovskite solar cells with improved stability. Journal of Power Sources 2020, 466, 228320. doi:10.1016/j.jpowsour.2020.228320
- Yu, W.; Fu, H. J.; Mueller, T.; Brunschwig, B. S.; Lewis, N. S. Atomic force microscopy: Emerging illuminated and operando techniques for solar fuel research. The Journal of chemical physics 2020, 153, 020902. doi:10.1063/5.0009858
- Tennyson, E. M.; Abdi-Jalebi, M.; Ji, K.; Garrett, J. L.; Gong, C.; Pawlicki, A. A.; Ovchinnikova, O. S.; Munday, J. N.; Stranks, S. D.; Leite, M. S. Correlated Electrical and Chemical Nanoscale Properties in Potassium-Passivated, Triple-Cation Perovskite Solar Cells. Advanced Materials Interfaces 2020, 7, 2000515. doi:10.1002/admi.202000515