
This search combines search strings from the content search (i.e. "Full Text", "Author", "Title", "Abstract", or "Keywords") with "Article Type" and "Publication Date Range" using the AND operator.
Beilstein J. Nanotechnol. 2026, 17, 922–934, doi:10.3762/bjnano.17.65
Figure 1: Schematic of the cross-sectional view of the half-irradiated films.
Figure 2: GIXRD pattern of (a) as-deposited (WC_RT) and (b) 700 °C annealed (S1) films in air ambient.
Figure 3: GIXRD patterns of WC films (S2) deposited at 600 K substrate temperatures.
Figure 4: Typical RBS spectra of S2 films.
Figure 5: RBS spectra of the S1 films – pristine (black; S1_N) and irradiated (red; S1_I) at fluence 1 × 10¹⁷...
Figure 6: RBS spectra of the W peak of the S1 films – pristine (black) and irradiated with 100 keV Kr+ ions a...
Figure 7: Simulated spectra of W peak (S1 films) using SIMNRA of Pristine (black) and 100 keV Kr+ ion irradia...
Figure 8: RBS spectra of WC films (S2). The black curve is for the pristine (S2_N) and the red curve is for t...
Figure 9: Variation in differential areal concentration with ion fluence for S1. The sputter rate is obtained...
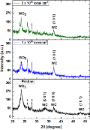
Figure 10: GIXRD patterns of pristine and irradiated WC–WO3 nanocomposite films (S1) at different fluences. Th...
Figure 11: SEM images of (a) pristine and irradiated WC–WO3 nanocomposite films (S1) at different fluences: (b...