

This search combines search strings from the content search (i.e. "Full Text", "Author", "Title", "Abstract", or "Keywords") with "Article Type" and "Publication Date Range" using the AND operator.
Beilstein J. Nanotechnol. 2026, 17, 1103–1116, doi:10.3762/bjnano.17.75
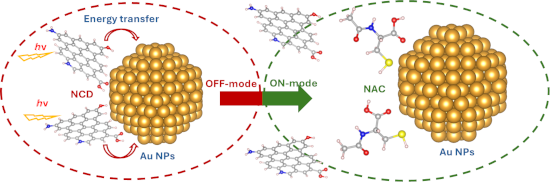
Figure 1: Optimized structures of (a) Au NPs, (b) NCD, (c) NAC. Color codes: light brown – Au, grey – C, blue...
Figure 2: FTIR spectra of NCDs (black line) and Au@NCDs (red line).
Figure 3: Raman spectra of NCDs and Au@NCDs.
Figure 4: TEM images of (a) NCDs and (b) Au@NCDs and (c) DLS size distribution analysis of Au@NCDs.
Figure 5: (a) EDX spectrum with elemental weight percentages, (b) SEM image, and elemental mapping of (c) Au ...
Figure 6: (a) EDX spectrum with elemental weight percentages, (b) SEM image, and elemental mapping of (c) Au,...
Figure 7: (a) Absorption and (b) photoluminescence spectra of NCDs and Au@NCDs (λex = 355 nm).
Figure 8: (a) Schematic illustration of the NAC detection mechanism of the Au@NCDs probe, (b, c) spatial dist...
Figure 9: Optimized structures of the binding modes between Au NPs and NCD, along with the corresponding inte...
Figure 10: Optimized structures of the binding modes between Au NPs and NAC, along with the corresponding inte...
Figure 11: Photoluminescence spectra of NCDs, Au@NCDs, and Au@NCDs after adding NAC.
Figure 12: (a) Effect of organic solvent and (b) amount of DMF solvent ratio.
Figure 13: (a) The fluorescence spectra of Au@NCDs + NAC (0–80 mg/L); (b) calibration curve.