
This search combines search strings from the content search (i.e. "Full Text", "Author", "Title", "Abstract", or "Keywords") with "Article Type" and "Publication Date Range" using the AND operator.
Beilstein J. Nanotechnol. 2026, 17, 1087–1102, doi:10.3762/bjnano.17.74
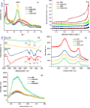
Figure 1: (a) XRD patterns, (b) nitrogen adsorption/desorption isotherms, (c) FTIR spectra, (d) Raman spectra...
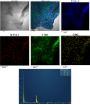
Figure 2: HRTEM observation of (S,N)-GO (a) and (S,N)-rGO (b).
Figure 3: EDX mapping of (S,N)-rGO.
Figure 4: (a) Cyclic voltammograms (CVs) recorded at different electrodes (GCE, GO/GCE, (S,N)-GO/GCE, rGO/GCE...
Figure 5: (a) CVs of (S,N)-rGO/GCE in 0.1 M Britton–Robinson buffer at different pH values (2.0–8.0) containi...
Figure 6: (a) CVs of (S,N)-rGO/GCE in 0.1 M Britton–Robinson buffer (pH 4.0) containing 20 µM SDN at differen...
Figure 7: (a) Molecular structures, (b) CVs, and (c) DPVs of SDN, ciprofloxacin, and ofloxacin with concentra...
Figure 8: (a) DPV curves of (S,N)-rGO/GCE in 0.1 M Britton–Robinson buffer (pH 4.0) for different concentrati...
Figure 9: (a) Variation of peak current (Ip) for SDN at four concentrations (1.0, 2.0, 13.8, and 19.6 µM) rec...