

This search combines search strings from the content search (i.e. "Full Text", "Author", "Title", "Abstract", or "Keywords") with "Article Type" and "Publication Date Range" using the AND operator.
Beilstein J. Nanotechnol. 2026, 17, 1047–1062, doi:10.3762/bjnano.17.72
Figure 1: Comparison between the energy landscapes of polycrystal and glass states. Note that a direct compar...
Figure 2: Schematic representation of the free enthalpy of a nanoglass (green curve) as well as its constitue...
Figure 3: (a) SEM overview of the top surface of a columnar Cu–Zr nanoglass, showing the individual columns (...
Figure 4: Property enhancements of nanoglasses and potential application areas of columnar thin-film nanoglas...
Beilstein J. Nanotechnol. 2016, 7, 1428–1433, doi:10.3762/bjnano.7.134
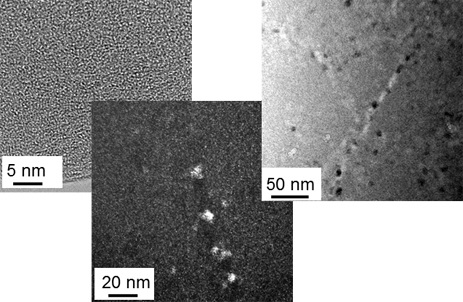
Figure 1: Isothermal microcalorimeter trace at 60 °C for as-spun and cold-rolled ribbons. The inset shows the...
Figure 2: Dark field TEM analysis of cold-rolled (left) and cold-rolled and annealed samples. The sample was ...
Figure 3: The cumulative size distribution for Al nanocrystals inside shear bands. Square markers represent m...
Figure 4: (a) DSC trace for an as-spun Al88Y7Fe5 ribbon sample. (b) DSC trace for the cold-rolled Al88Y7Fe5 r...
Figure 5: XRD results showing an increase in intensity of the Al peaks after annealing of a cold-rolled sampl...
Figure 6: DF TEM (left) and BF TEM (right) after 210 °C anneal of cold-rolled sample.