

Search results
Search for "measurement" in Full Text gives 1240 result(s) in Beilstein Journal of Nanotechnology. Showing first 200.
Electrochemical nanostructured CuBTC/FeBTC MOF composite sensor for enrofloxacin detection
Beilstein J. Nanotechnol. 2024, 15, 1522–1535, doi:10.3762/bjnano.15.120
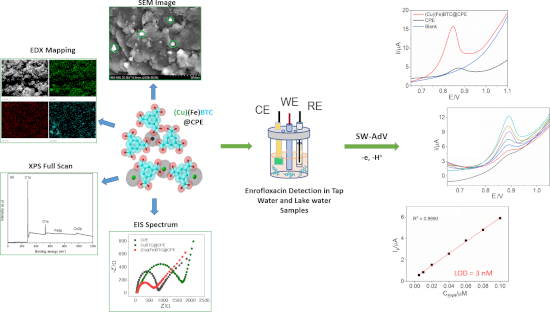
- the MOFs. A sensor for simultaneously detecting hydroquinone and catechol in water using a Cu-MOF–graphene composite was developed by Li and colleagues. Measurement ranges beginning at 1.0 × 10⁻⁶ and 1.0 × 10⁻³ M were achieved, with LODs of 5.9 × 10⁻⁷ M and 3.3 × 10⁻⁷ M for hydroquinone and catechol
- require shorter times to reach equilibrium. Repeatability and reproducibility of the (Cu)(Fe)BTC@CPE electrode Figure 11a depicts eight successive measurements conducted in 0.20 µM ENR solution using a single electrode without renewing the electrode surface. Clearly, in the second measurement, the ENR
- electrode reproducibility performance was evaluated by comparing SWV signals in 0.2 µM ENR solution obtained on an electrode whose surface was renewed before each measurement (Figure 11b). The data indicated slight fluctuations in peak currents among eight measurements, with a relative standard deviation





Lithium niobate on insulator: an emerging nanophotonic crystal for optimized light control
Beilstein J. Nanotechnol. 2024, 15, 1415–1426, doi:10.3762/bjnano.15.114
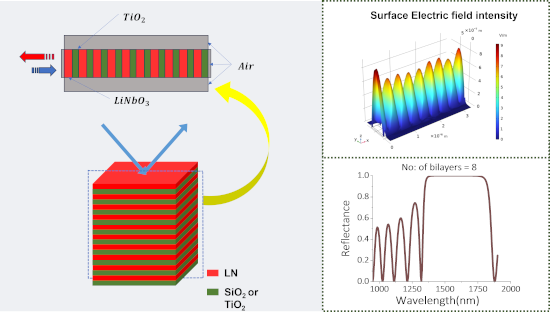
- and driving coherent interactions with the organic semiconductor molecules. Secondly, enabling the measurement of the evolution of stored energy and the differential reflectivity induced by the pump pulse, which is essential for monitoring the charging dynamics at a femtosecond resolution. The


Out-of-plane polarization induces a picosecond photoresponse in rhombohedral stacked bilayer WSe2
Beilstein J. Nanotechnol. 2024, 15, 1362–1368, doi:10.3762/bjnano.15.109
- photodetectors. Keywords: broken inversion symmetry; out-of-plane polarization; picosecond photoresponse; time-resolved photocurrent measurement (TRPC); WSe2; Introduction Two-dimensional (2D) van der Waals (vdW) ferroelectrics with dangling-bond-free surfaces exhibit ferroelectricity by effectively resisting
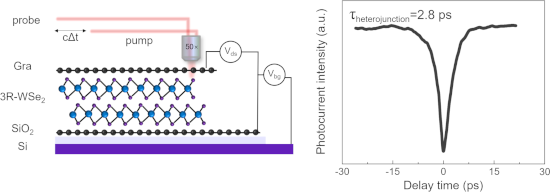
- ][41][42]. Figure 2b shows the power-law relationship between photocurrent (Iph) and excitation power (P), Iph = P0.6, indicating that the photocurrent exhibits sublinear growth, consistent with the saturation effect. In Figure 2c, the TRPC measurement curve shows a symmetric dip at zero time delay
- ) at room temperature. The electrical properties of the devices were characterized using an Agilent B1500 semiconductor analyzer in a Lake Shore vacuum chamber (10−4 Pa). SPCM and TRPC measurement The photocurrent maps were all obtained under zero bias using a custom-built scanning photocurrent


Investigation of Hf/Ti bilayers for the development of transition-edge sensor microcalorimeters
Beilstein J. Nanotechnol. 2024, 15, 1353–1361, doi:10.3762/bjnano.15.108

- . Otherwise, the critical temperature of the structures would vary significantly, which we do not observe, as shown below. Cryogenic Measurement Results Low-temperature measurements of the chips with structures were performed in a Triton 200 dilution cryostat. The chips were placed in a 16-pin sample holder
- critical temperature of sample A3 compared to the others is due to the lower measurement current. The resistance peak on the R(T) dependence for samples A1 and A2 (Figure 3a and Figure 3b) may appear due to non-equilibrium effects and the presence of NS borders in the setup [16][17]. But presently, we have


Nanoarchitectonics with cetrimonium bromide on metal nanoparticles for linker-free detection of toxic metal ions and catalytic degradation of 4-nitrophenol
Beilstein J. Nanotechnol. 2024, 15, 1312–1332, doi:10.3762/bjnano.15.106
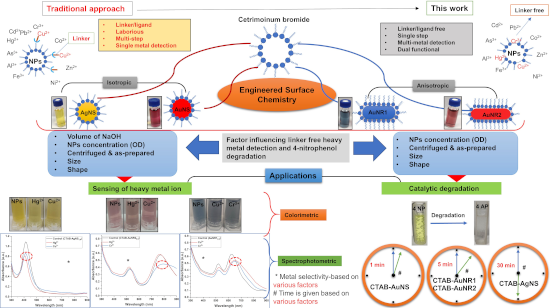
- used for measurement. The functionalization of AgNS, AuNS, AuNR1, and AuNR2 with CTAB was validated through Fourier-transform infrared spectroscopy (Thermo Scientific, Nicolet iS5, USA). 10 mg of the air-dried nanoparticles were placed over a diamond and measured in the range of 400–4000 cm−1
- . The DLS measurement indicated average hydrodynamic radii of 35.80 and 29.60 nm for isotropic silver and gold nanospheres, respectively. DLS measurements of anisotropic nanorods (AuNR1 and AuNR2) could not be carried out because of limitations of the instrument [39]. The nanospheres of silver and gold




Interaction of graphene oxide with tannic acid: computational modeling and toxicity mitigation in C. elegans
Beilstein J. Nanotechnol. 2024, 15, 1297–1311, doi:10.3762/bjnano.15.105

- added, and the suspension was sonicated in an ultrasonic bath. The sonication time was controlled by analyzing the material’s hydrodynamic diameters by dynamic light scattering (DLS). Dispersion aliquots for measurement were collected every 10 min, and the sonication was performed until there were no


New design of operational MEMS bridges for measurements of properties of FEBID-based nanostructures
Beilstein J. Nanotechnol. 2024, 15, 1273–1282, doi:10.3762/bjnano.15.103
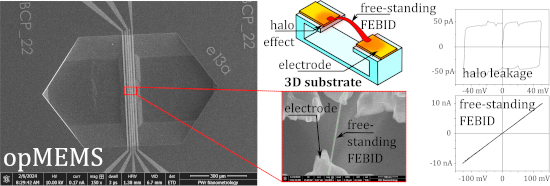
- , whose properties must be separated from the measurement system to avoid possible interference. In this paper, we propose novel devices, namely operational micro-electromechanical system (opMEMS) bridges. These are 3D substrates with nanometer-scale actuation capability and equipped with electrical
- possibilities to determine the leakage currents. Moreover, existing methods are detrimental to the proper operation of the device [26][27]. Such 3D substrates can be realised as micro-electromechanical system (MEMS) measurement platforms, which have the advantage of achieving controlled displacement through an
- for the desired MEMS measurement platforms are as follows: They should be dimensionally compatible with the nanostructure to be tested and allow for actuation with an embedded actuation mechanism. To operate, MEMS platforms require auxiliary equipment such as a scanning electron microscope (SEM) or


The role of a tantalum interlayer in enhancing the properties of Fe3O4 thin films
Beilstein J. Nanotechnol. 2024, 15, 1253–1259, doi:10.3762/bjnano.15.101

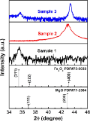
- Design magnetic property measurement system, MPMS-5XL), and X-ray diffractometry (Bruker Discover D8), respectively. AFM images (1 × 1 µm2) of Fe3O4 thin films on different substrates. (a) SiO2, (b) MgO(100), and (c) MgO/Ta/SiO2. XRD spectra of sample 1 (black), sample 2 (red), and sample 3 (blue) on


A low-kiloelectronvolt focused ion beam strategy for processing low-thermal-conductance materials with nanoampere currents
Beilstein J. Nanotechnol. 2024, 15, 1197–1207, doi:10.3762/bjnano.15.97

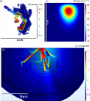
- 246 nm, exceeds the 200 nm blur and an additional measurement is therefore not meaningful here. The blur was achieved by overfocusing the beam. All cross-sections were prepared using 1 µs dwell time. SEM images of the prepared cross-sections were recorded with 5 kV acceleration voltage, 90 pA beam



Photocatalytic methane oxidation over a TiO2/SiNWs p–n junction catalyst at room temperature
Beilstein J. Nanotechnol. 2024, 15, 1132–1141, doi:10.3762/bjnano.15.92
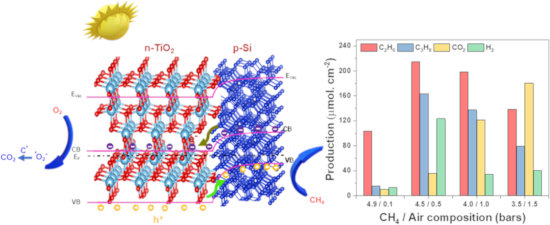
- and light conditions. Each measurement was scanned with 0.05 V intervals. The bias supply and current signals were provided and recorded by a Keithley system adapted with an amplifier. XRD patterns of p-Si, p-type SiNWs, and the TiO2/SiNWs sample. Cross-sectional view (a, b) and top view (c, d) SEM


Local work function on graphene nanoribbons
Beilstein J. Nanotechnol. 2024, 15, 1125–1131, doi:10.3762/bjnano.15.91
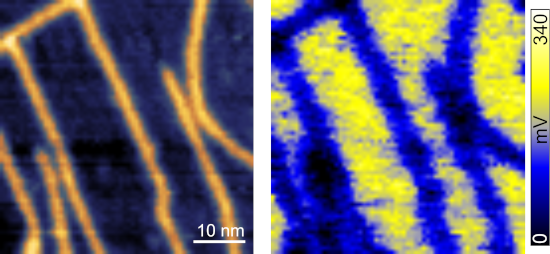
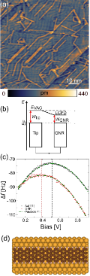
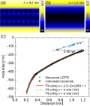
- . Variations in the measurement reveal local work function differences, which are ascribed to the Fermi level shift resulting from the charge transfer between the GNR and the Au substrate. Our results indicate that GNRs are positively charged compared to Au. This is confirmed by calculations and by distance
- (f0 = 292 kHz, cL = 41 N/m) were used for imaging in the frequency modulation (FM) mode operated by a Nanonis electronic system. The tips were cleaned by sputtering (Ar pressure 5 × 10⁻³ Pa, energy 1 keV, 15 min) and annealing up to 375 K for 1–5 h (pressure below 1 × 10⁻⁷ Pa) prior to measurement
- irregularities such as kinks or defects at the edge are observed in the topography measurement. For example for the GNR where the cross section has been taken, marked by a black line, there is a kink associated with a darker region in the local work function, and in the topography image there are some small

![[Graphic 1]](/bjnano/content/inline/2190-4286-15-91-i4.svg?max-width=637&scale=1.18182)
Unveiling the potential of alginate-based nanomaterials in sensing technology and smart delivery applications
Beilstein J. Nanotechnol. 2024, 15, 1077–1104, doi:10.3762/bjnano.15.88
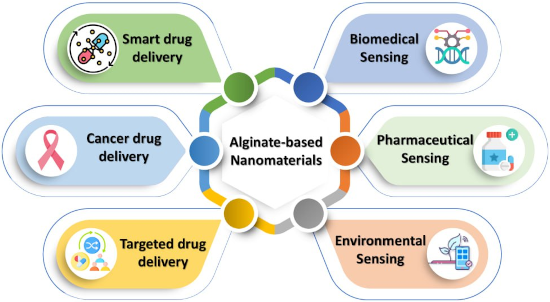
- environmental monitoring. Accurate detection and measurement of H2O2 levels is vital for understanding its role in biological processes, diagnosing diseases, and monitoring environmental pollutants [114]. Alginate-based nanoparticles have depicted great potential in hydrogen peroxide sensing. A silver/poly(3


Signal generation in dynamic interferometric displacement detection
Beilstein J. Nanotechnol. 2024, 15, 1070–1076, doi:10.3762/bjnano.15.87
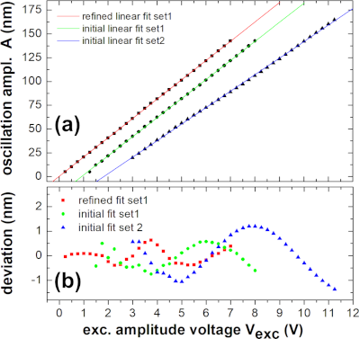
- . In a non-contact atomic force microscope (NC-AFM), it facilitates the force measurement by recording the periodic displacement of an oscillating microcantilever. To understand signal generation in a NC-AFM-based Michelson-type interferometer, we evaluate the non-linear response of the interferometer
- is essential for quantitative NC-AFM; therefore, various methods have been suggested to determine the calibration factor S [10][19][20][21][22]. There is a simple and rough, but commonly used, method of calibration of the cantilever displacement by an interferometer, which is based on the measurement
- amplitude error. The relative error in the wavelength measurement is δλ/λ = 0.00075 as detailed below. The error in the adjustment of the light spot on the cantilever with length lc is the positioning error δlc = 5 μm, which is the distance between the laser spot position and the tip position as illustrated


Bolometric IR photoresponse based on a 3D micro-nano integrated CNT architecture
Beilstein J. Nanotechnol. 2024, 15, 1030–1040, doi:10.3762/bjnano.15.84
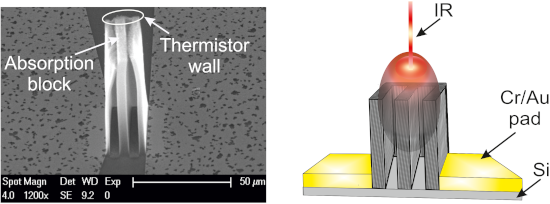
- 980 nm. A Thorlabs compact laser diode controller set the output power to 4 mW. The spot size of the laser beam of 100 μm was accurately determined using the knife edge method [17]. A mechanical chopper was used to modulate the laser beam intensity. The key component in the responsivity measurement
- . Optimized contacts between the Cr/Au pads and the M-shaped CNT block can be obtained, for example, with additional CNT blocks grown on the Cr/Au pads, as shown in [7]. DC measurements The first step involved the measurement of the bolometer resistance Rbolometer as a function of temperature T induced by a
- , respectively. The thermal conductances of sample 1 and sample 2 were calculated as Gth1 = 7.45 × 10⁻⁶ W/K and Gth2 = 3.3 × 10⁻⁷ W/K, respectively. Responsivity measurement The voltage responsivity (ℜV) is one of the main device parameters in the evaluation of microbolometer performance, serving as a


Recent progress on field-effect transistor-based biosensors: device perspective
Beilstein J. Nanotechnol. 2024, 15, 977–994, doi:10.3762/bjnano.15.80
- simulations (EDAS) [77][78]. Furthermore, an amplifier with common-source architecture has been incorporated into a simple analog circuit for the amplification of the threshold-voltage change, leading to the measurement of pH change at the level of the biosensor surface. Thus, two different circuits for




A review on the structural characterization of nanomaterials for nano-QSAR models
Beilstein J. Nanotechnol. 2024, 15, 854–866, doi:10.3762/bjnano.15.71

- measurement, which was applied both to the size itself but also to the electronegativity [74][75]. Indirect descriptors of the nanoform properties Experimental measurements (d): Because of the complex structures of NMs, it is challenging to understand how the nanostructure affects their chemical and
- involved in the activity modelled or that have a structural origin related to the activity mechanism. A very common property included in several models [23][44][60][68][76] is the zeta potential (a measurement of the charge at the surface of the NMs). The zeta potential value used as a descriptor can be
- uses the measurement in pure water (first layer) and another one that allows for estimating the value of the zeta potential in the ionized medium (second layer) using the output of the first layer [78]. Although the zeta potential is most often included as a numerical value, it can be also used to


Investigation on drag reduction on rotating blade surfaces with microtextures
Beilstein J. Nanotechnol. 2024, 15, 833–853, doi:10.3762/bjnano.15.70
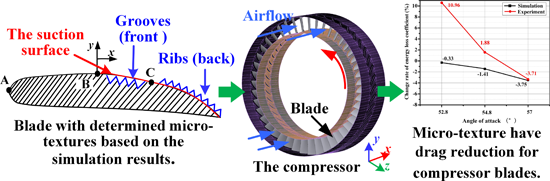
- Aeronautics and Astronautics. Pictures and a schematic diagram of the wind tunnel test platform are shown in Figure 8. Figure 8b shows that the wake measurement device consisting of a three-hole probe, a motor, and a guide rail. Ten probes were utilized to measure the wake, while the motor facilitates control
- °, respectively; (3) measurement of the TP and P at the inlet and outlet, respectively, and calculation of ξ and observation of the wake loss distribution; (4) change of velocity and angle of attack to 130.67 m/s and 54.8°, respectively, and continuation according to step 3; (5) change of velocity and angle of


Intermixing of MoS2 and WS2 photocatalysts toward methylene blue photodegradation
Beilstein J. Nanotechnol. 2024, 15, 817–829, doi:10.3762/bjnano.15.68
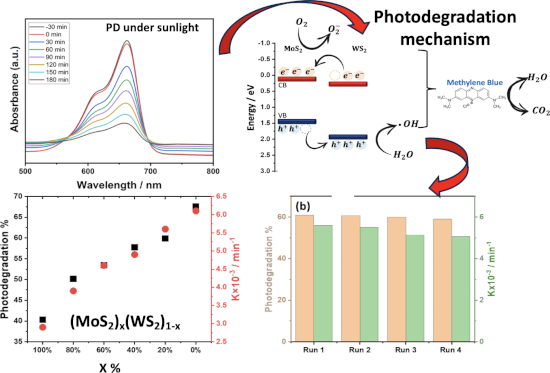
- distilled water required are variable and adjusted experimentally. The redilution process is controlled by the spectrophotometric absorption measurement. Between the first and fourth cycles, the PD rate constants were observed to decrease from 3.3 min−1 to 1.8 × 10⁻³ min−1 and 6.1 min−1 to 2 × 10⁻³ min−1 in


Electron-induced ligand loss from iron tetracarbonyl methyl acrylate
Beilstein J. Nanotechnol. 2024, 15, 797–807, doi:10.3762/bjnano.15.66
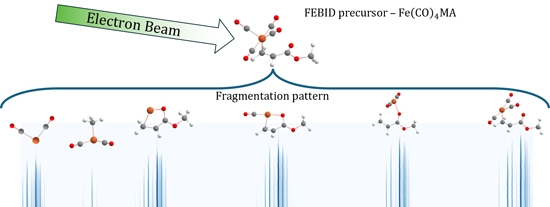
- 4.4 eV resonance peak of O− anions produced via DEA to CO2. The electron beam energy resolution was estimated by fitting and extracting the width of the 4.4 eV resonance peak of O−/CO2; during the present measurement it was around 100 meV. In the given mass range, the quadrupole mass resolution was



Electrospun polysuccinimide scaffolds containing different salts as potential wound dressing material
Beilstein J. Nanotechnol. 2024, 15, 781–796, doi:10.3762/bjnano.15.65
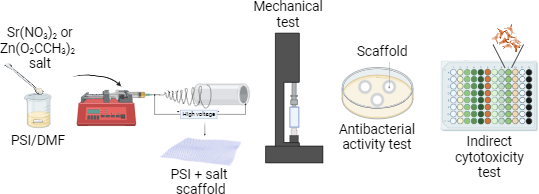
- . The suspensions were diluted until their McFarland values reached 0.5, corresponding to 108 colony-forming units (CFU)/mL; the measurement was determined by a DEN-1 densitometer (Biosan, Latvia). From the bacterial strains, bacterial lawns were made on the Muller–Hinton medium. The mass of previously



Exploring surface charge dynamics: implications for AFM height measurements in 2D materials
Beilstein J. Nanotechnol. 2024, 15, 767–780, doi:10.3762/bjnano.15.64
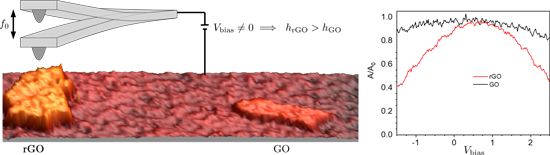
- behavior with the existence of an uncompensated electrostatic force that is nullified when KPFM is activated. However, it is crucial to remember that, under our measurement conditions, the tip always oscillates at resonance and amplitude variations are related to dissipative interactions. Since the
- stationary or periodic state for a static or oscillating tip, respectively. This relaxation time is crucial to the overall charge dynamics and depends on the material’s in-plane conductivity and on the measurement parameters. When this relaxation time is comparable to, or even significantly exceeds, the
- characteristic AFM measurement times, it may influence not only the topography, but also other interaction channels, particularly, those related to electrostatic properties. Finally, it is worth noting that the oscillating surface charge on the material’s surface may not only be induced by the scanning tip but


Green synthesis of biomass-derived carbon quantum dots for photocatalytic degradation of methylene blue
Beilstein J. Nanotechnol. 2024, 15, 755–766, doi:10.3762/bjnano.15.63
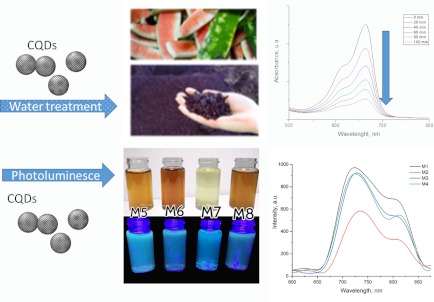
- length quartz cell was used for the measurements, and deionized water was used as the blank in the measurement to account for background signals. Fourier-transform infrared spectra were measured on a Spectrum Two FT-IR/Sp 10 S/W spectrometer (USA) with a LiTaO3 type detector, the wavelength used ranged
- from 450 to 4000 cm−1. The size distribution of the synthesized CQDs was determined via DLS, which relies on the measurement of the hydrodynamic radius of the particles. The CQDs were analyzed via a Malvern NanoSizer ZP instrument. The samples were diluted in deionized water to prevent signal
- a dark environment to ensure proper dispersion of the CQDs in aqueous media and the adsorption of the dye on the CQD surface. After the stirring period of 20 min, the solution absorbance was measured using a spectrophotometer in the wavelength range of 250–800 nm. This measurement marked the start


Effect of repeating hydrothermal growth processes and rapid thermal annealing on CuO thin film properties
Beilstein J. Nanotechnol. 2024, 15, 743–754, doi:10.3762/bjnano.15.62
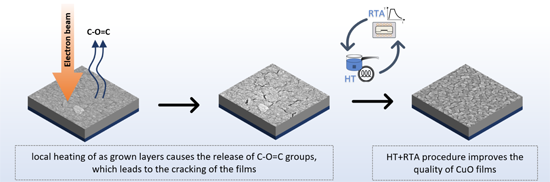
- procedure are denoted as “1×”, “2×”, and “3×”, depending on the number of HT+RTA cycles. It is worth highlighting that re-executing the hydrothermal processes does not necessitate any supplementary preparation of samples, for example, surface re-nucleation. Measurement equipment CuO thin films were
- , which allowed for the investigation of both topography and electrical properties of the films. Surface topography analysis was performed by utilizing an atomic force microscopy (AFM) operating in Peak Force Tapping mode. The surface was scanned at a resolution of 1024 × 1024 measurement points using a
- effect [49][50]. Despite the measurement conditions, it was still possible to qualitatively analyze changes in surface potential and work function based on the sample preparation method. The AFM, SCM, and KPFM data were analyzed using the Nanoscope Analysis 3.0 software (Bruker). The CuO films also




Simultaneous electrochemical determination of uric acid and hypoxanthine at a TiO2/graphene quantum dot-modified electrode
Beilstein J. Nanotechnol. 2024, 15, 719–732, doi:10.3762/bjnano.15.60
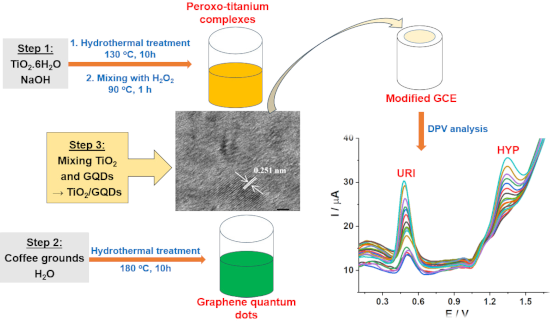
- temperature. The urine samples for electrochemical measurement were prepared by first diluting 1 mL urine to 20 mL with distilled water. 1.5 mL of this urine solution was added to 2 mL of 0.25 M pH 3 buffer and was diluted to 10 mL with distilled water in an electrolysis cell. The solution was spiked with 10
- of URI and HYP of 0.81% and 2.92%, respectively, was chosen to avoid any potential interference effect in real samples. The variation of the potential scan rate during DPV measurement reveals that the electrochemical reactions of URI and HYP are determined by adsorption. Therefore, even at tacc = 0
- , the IP values for URI and HYP are 3.787 ± 0.535 μA (n = 3) and 4.193 ± 0.318 μA (n = 3), respectively (Supporting Information File 1, Figure S1c,d). This phenomenon shows that URI and HYP quickly adsorb on the surface of the modified electrode at the beginning of the measurement. Therefore, when the


Elastic modulus of β-Ga2O3 nanowires measured by resonance and three-point bending techniques
Beilstein J. Nanotechnol. 2024, 15, 704–712, doi:10.3762/bjnano.15.58
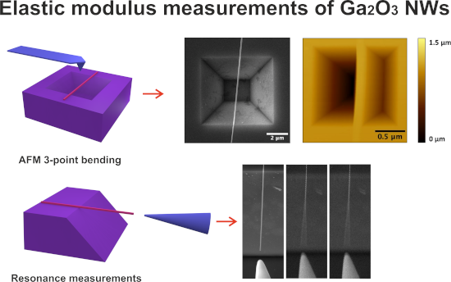
- investigated more deeply. This work addresses the challenges associated with determining the elastic modulus of individual monoclinic Ga2O3 NWs. Here, the selection and use of two distinct measurement techniques, resonance and three-point bending, was driven by the fact that the test method contributes to
- Figure 6a) resonance oscillations measurements, only the width of the NW is measured for the elastic modulus calculation. The lack of sufficiently precise height measurement at both ends of the NW in this setup does not allow accurate elastic modulus value estimation from resonance oscillation in the
- error to the calculations which should be minimised via a thorough study of each individual nanostructure geometry [29]. The magnitude of the geometrical measurement error typically increases significantly for smaller NWs, since the relative measurement error is becoming comparable to the absolute value