Abstract
The Re3As7−xInx solid solution was prepared for x ≤ 0.5 by heating the elements in stoichiometric ratios in evacuated silica tubes at 1073 K. It crystallizes with the Ir3Ge7 crystal structure, space group Im−3m, with a unit-cell parameter a ranging from 8.716 to 8.747 Å. The crystal structure and properties were investigated for a composition with x = 0.4. It is shown that indium substitutes arsenic exclusively at one crystallographic site, such that the As–As dumbbells with dAs–As = 2.54 Å remain intact. Re3As6.6In0.4 behaves as a bad metal or heavily doped semiconductor, with electrons being the dominant charge carriers. It possesses high values of Seebeck coefficient and low thermal conductivity, but relatively low electrical conductivity, which leads to rather low values of the thermoelectric figure of merit.
Introduction
Thermoelectric materials with good efficiency are highly awaited by modern power engineering. Utilizing either the Seebeck or Peltier effects, it is possible to produce electricity from waste heat (e.g., that stemming from combustion in car engines) or to cool an environment under an external power supply. However, the efficiency of these processes depends on the efficiency of the thermoelectric material in question, which is defined by the value of the figure of merit ![[Graphic 1]](/bjnano/content/inline/2190-4286-4-52-i1.svg?max-width=637&scale=1.18182) where T is the absolute temperature, S the Seebeck coefficient, σ the electrical conductivity, and κ the thermal conductivity. It is shown in the literature [1] that the best thermoelectric materials are to be sought among narrow-gap semiconductors composed of heavy elements, in which structural features favor low thermal conductivity [2]. Attempts to improve the ZT value have led to the investigation of various types of thermoelectrics beyond the long-known lead and bismuth tellurides [3,4]. Among new candidates are the filled skutterudites [5,6], semiconducting clathrates [7], disordered materials such as Zn4Sb3 [8], and various inorganic and intermetallic compounds with complex crystal structures [9,10]. Compounds with the Ir3Ge7 structure type, namely Mo3Sb5+δTe2−δ [11], Nb3Sb2Te5 [12] and Re3As7−xGex [13], belong to the latter type of potential thermoelectric materials and have recently shown promising ZT values.
where T is the absolute temperature, S the Seebeck coefficient, σ the electrical conductivity, and κ the thermal conductivity. It is shown in the literature [1] that the best thermoelectric materials are to be sought among narrow-gap semiconductors composed of heavy elements, in which structural features favor low thermal conductivity [2]. Attempts to improve the ZT value have led to the investigation of various types of thermoelectrics beyond the long-known lead and bismuth tellurides [3,4]. Among new candidates are the filled skutterudites [5,6], semiconducting clathrates [7], disordered materials such as Zn4Sb3 [8], and various inorganic and intermetallic compounds with complex crystal structures [9,10]. Compounds with the Ir3Ge7 structure type, namely Mo3Sb5+δTe2−δ [11], Nb3Sb2Te5 [12] and Re3As7−xGex [13], belong to the latter type of potential thermoelectric materials and have recently shown promising ZT values.
All members of the Ir3Ge7 family crystallize in the cubic space group Im−3m and feature the M–M dumbbells inside the Archimedean antiprism of the non-transition-element atoms. The strong hybridization of the transition-metal d-orbitals with the p-orbitals of a non-transition element may lead to the opening of a band gap near the Fermi level [14]. As a result, compounds with 55 valence electrons per formula unit (f.u.) exhibit semiconductor-like behavior. The number of valence electrons can be tuned through the solid-solution formation. For instance, Mo3Sb5Te2 and Re3As6Ge adopt 55 e− per f.u. and should be semiconductors according to the band structure calculations. Their doped analogues, Mo3Sb5.4Te1.6 and Re3As6.4Ge0.6, display minor deviation from 55 e− per formula. They behave as heavily doped semiconductors and possess the ZT values of 0.8 at 1050 K and 0.3 at 700 K, respectively [13]. To expand the Ir3Ge7 family and search for new promising thermoelectrics, we investigated different ways of obtaining new solid solutions based on Re3As7 or Mo3Sb7 compounds. In this paper, we report on the synthesis of the Re3As7−xInx solid solution (x ≤ 0.5), its crystal and electronic structures, and its thermoelectric properties.
Experimental
Synthesis and analysis
Rhenium (–325 mesh, 99.99%, Alfa Aesar) and arsenic (–70 mesh, 99.99%, Alfa Aesar) powders and indium ingots (99.95%, Sigma Aldrich) were used as received. Phase purity of the starting materials was checked by using the standard X-ray diffraction technique, and in all cases no impurity phases were found. To synthesize the title solid solution, stoichiometric quantities of the starting elements were heated in evacuated silica tubes at 1073 K for 7 days with further cooling to room temperature in a shut off furnace. Firstly, the samples were analyzed by means of X-ray powder diffraction using a Stoe STADI-IP diffractometer with Cu Kα1 radiation (Ge monochromator, λ = 1.540598 Å). To evaluate the lattice constants of the Re3As7−xInx solid solution, all X-ray diffraction patterns were recorded with Ge as an internal standard (a = 5.6576 Å). The data were treated with the program package Stoe WinXPOW. Secondly, the obtained samples were analyzed with a JSM JEOL scanning electron microscope operated at 20 kV and equipped with an EDX detection system INCA x-Sight. Both point-spectra acquisition and element mapping were used to investigate the elemental and phase composition of the samples.
Structure determination
The crystal structure was determined by the Rietveld method from the X-ray powder diffraction data. For the sample with the nominal composition Re3As6.6In0.4, hereafter sample S1, the data were recorded with the Bruker D8 Advance diffractometer, Cu Kα1 radiation (Ge monochromator, λ = 1.540598 Å). For the Rietveld refinements we used the TOPAS software (version 4.2, Bruker-AXS). The refinement enabled us to determine minor quantities of three impurity phases (Table 1) that were taken into account during the subsequent refinement. The atomic parameters taken from the crystal structure of Re3As7 [15] were used as the starting model. The refinement showed that the unique position of the rhenium atom was fully occupied. One of the two positions of the arsenic atoms, namely, the 12d site, showed a remarkably low atomic displacement parameter and was subsequently refined as jointly occupied by indium and arsenic. The refinement led to the composition Re3As6.70(3)In0.30(3) in reasonable agreement with the starting (synthetic) composition. Crystallographic details of the refinement are shown in Table 1, and the atomic parameters are shown in Table 2. Selected interatomic distances are listed in Table 3.
Table 1: Crystallographic data from the powder diffraction experiment for S1.
| refined composition | Re3As6.70(3)In0.30(3) |
|---|---|
| formula weight (g·mol−1) | 1095.041 |
| T (K) | 300 |
| wavelength (Å) | 1.540598 |
| space group | Im−3m (No. 229) |
| cell dimensions, a (Å) | 8.74231(6) |
| V (Å3) | 668.157(14) |
| no. of formula units per cell | 4 |
| calculated density (g·cm−3) | 10.88 |
| 2θ range (°) | 17.00–85.01 |
| Rp, Rwp, GOF | 0.056, 0.077, 1.4 |
| impurity phases (weight %) | Re 2.0%, InAs 2.3%, In2O3 1.0% |
Electronic-structure calculations
The FPLO (full potential local orbitals) code was utilized for the electronic-structure calculations [16]. FPLO performs density functional calculations with the local density approximation (LDA) for the exchange–correlation potential [17]. The crystallographic data presented in Table 4 were used for the calculations [15]. The integrations in the k space were performed by an improved tetrahedron method [18] on a grid of 16 × 16 × 16 k points evenly spread in the first Brillouin zone.
Table 4: Re3As7 crystallographic data used for electronic-structure calculations [15].
| Space group Im−3m (No. 229), a = 8.7162(7) Å | ||||
|---|---|---|---|---|
| site | Wyck. | x | y | z |
| Re | 12e | 0.3406(9) | 0 | 0 |
| As1 | 12d | 1/4 | 0 | 1/2 |
| As2 | 16f | 0.1687(20) | 0.1687(20) | 0.1687(20) |
Physical property measurements
For thermal transport measurements, the sample S1 was thoroughly ground and pressed at room temperature into a rectangular pellet of dimensions 8 × 3 × 2 mm3. The density of S1 was estimated from the linear sizes of the pellet to be about 70% of the theoretical density. This pellet was used to measure the electrical conductivity (σ), the Seebeck coefficient (S), and the thermal conductivity (κ) in the temperature range of 77–300 K in a home-built setup. Resistance was determined from the voltage drops by applying a four-probe method in accordance with Ohm’s law, i.e., R = ΔV/I. The current (I) was scanned in the range between 2.5 µA and 16 mA, and subsequently σ was calculated after measuring the length between the contacts (L) according to σ = L/(AR), with the area A = 3 × 2 mm2. The Seebeck coefficient and thermal conductivity were measured by using an internal standard to determine the temperature difference in a custom-designed sample puck that was plugged into the cold finger of a closed-cycle refrigerator. All measurements were performed under dynamic vacuum.
For the magnetization measurements, powder samples of Re3As7 and S1 were loaded into plastic capsules. Measurements were performed with the VSM setup of Quantum Design PPMS in external fields of 0.1, 0.5, 1, 2, and 5 T. To estimate the diamagnetic contribution from the sample holder, an empty capsule was measured under the same conditions.
Results and Discussion
Synthesis, sample characterization and crystal structure
The synthesis of the Re3As7−xInx series with x = 0, 0.2, 0.4, 0.6, 0.8, and 1 from pure elements resulted in black powders that were stable in air. The obtained samples were analyzed by X-ray powder diffraction. All samples showed reflections of the main phase of the Re3As7 type (space group Im−3m), together with minor reflections of Re, InAs, and In2O3 admixtures, the presence of which was also confirmed with EPMA (Figure 1). In order to obtain single-phase samples, we tried to improve the synthetic procedure, but neither increasing the annealing time nor pressing the reactants into pellets led to phase-pure samples. Some general trends should be noted. For the samples with 0 ≤ x ≤ 0.4, absolute intensities and, thus, quantities of admixtures remain constant, while for x > 0.5, quantities of Re and InAs start to increase. Additionally, we found by a linear interpolation that the unit cell parameter of the Re3As7−xInx solid solution increases up to x = 0.5, and then remains constant at higher x (Figure 2). All these facts suggest that the solid solution in question exists only for x ≤ 0.5. The outermost composition Re3As6.5In0.5 possesses exactly 55 valence electrons per formula unit. As mentioned above, this electron concentration should yield the semiconducting behavior for compounds with the Ir3Ge7 structure type. Thus, the indium substitution for arsenic in Re3As7 could be used as a chemical modification to control transport properties of this system.
![[2190-4286-4-52-1]](/bjnano/content/figures/2190-4286-4-52-1.png?scale=2.0&max-width=1024&background=FFFFFF)
Figure 1: The plot of Rietveld refinement for the S1 sample. Experimental and difference curves, and positions of Bragg peaks are shown on the plot. Marked with numbers: 1: Re3As6.70(3)In0.30(3); 2: Re; 3: InAs; 4: In2O3. Inset: SEM micrograph of S1 showing the distribution of secondary phases in the microstructure (the most contaminated portion was chosen for showing all three admixtures).
Figure 1: The plot of Rietveld refinement for the S1 sample. Experimental and difference curves, and position...
![[2190-4286-4-52-2]](/bjnano/content/figures/2190-4286-4-52-2.png?scale=2.0&max-width=1024&background=FFFFFF)
Figure 2: Dependence of the Re3As7−xInx cubic-unit-cell parameter on the nominal indium content. Esd’s are calculated from least-squares fits of the powder data.
Figure 2: Dependence of the Re3As7−xInx cubic-unit-cell parameter on the nominal indium content. Esd’s are ca...
The crystal structure of the solid solution was studied for the S1 sample by the Rietveld method from X-ray powder diffraction data (Figure 1, Table 1 and Table 2). The title compound crystallizes with the Ir3Ge7 crystal structure (Figure 3). This structure can be described as being composed of rhenium-centered square antiprisms of E atoms, ReE8 (E = As/In). Two square antiprisms are linked by sharing a square face. These pairs form the so-called Re2E12 barrels, the main building blocks of the crystal structure. The barrels, oriented along the main crystallographic directions, form two interpenetrating 3D networks in accordance with the body-centering and, thus, build up the entire crystal structure.
![[2190-4286-4-52-3]](/bjnano/content/figures/2190-4286-4-52-3.png?scale=2.4&max-width=1024&background=FFFFFF)
Figure 3: Polyhedral view of the Re3As7−xInx crystal structure. Re is shown as black spheres inside the polyhedra, E1: white spheres, and As2: gray spheres at the vertices.
Figure 3: Polyhedral view of the Re3As7−xInx crystal structure. Re is shown as black spheres inside the polyh...
The formation of the solid solution may be associated with a chemical substitution on different crystallographic sites. There are two sites forming the coordination polyhedra of E atoms in the Ir3Ge7 structure type (Figure 4), and the substitution is possible for both sites depending on the chemical nature of the E elements. It is known from the literature that in the case of the Ge for As substitution in the parent compound Re3As7, all Ge atoms enter the As2 (16f) site [13]. In contrast, we have found that when indium substitutes for arsenic in Re3As7, all indium atoms are on the E1 (12d) site. The preference for the certain As position depends on different aspects, including size, nuclear charge, and number of valence electrons of the heteroatom. In particular, there is an E–E single bond between atoms occupying the 16f site, with a bond distance of 2.538(5) Å. Clearly, indium does not favor such a short bond to arsenic and, therefore, avoids the occupation of this site.
![[2190-4286-4-52-4]](/bjnano/content/figures/2190-4286-4-52-4.png?scale=2.0&max-width=1024&background=FFFFFF)
Figure 4: Coordination polyhedra of E1 (left) and As2 (right) sites in the crystal structure of Re3As7−xInx.
Figure 4: Coordination polyhedra of E1 (left) and As2 (right) sites in the crystal structure of Re3As7−xInx.
Electronic structure, magnetic and thermoelectric properties
The computed density of states for Re3As7 is shown in Figure 5. The Fermi level lies slightly above the gap of 0.8 eV that separates the conduction band from the valence band. The nonzero DOS at EF implies metallic behavior for the undoped Re3As7. Additionally, the steep slope of the DOS curve near EF should lead to a high Seebeck coefficient according to S ~ 1/N∙∂N(EF)/∂E [19], provided that the system is made semiconducting by doping. Indeed, the absolute values of S for Re3As6.4Ge0.6 exceed 150 µV·K−1 at high temperatures, thus leading to high values of ZT [13].
![[2190-4286-4-52-5]](/bjnano/content/figures/2190-4286-4-52-5.png?scale=2.4&max-width=1024&background=FFFFFF)
Figure 5: Density-of-states curve for Re3As7. Re contribution: dashed line, As1 and As2: light and dark gray lines, respectively.
Figure 5: Density-of-states curve for Re3As7. Re contribution: dashed line, As1 and As2: light and dark gray ...
In Re3As7, the calculated density of states at E = EF is 8.3 states/(eV·f.u.). For the solid solution Re3As6.7In0.3 (the composition obtained from the Rietveld refinement of the X-ray powder diffraction data, see Table 1), the DOS is reduced to 5.15 states/(eV·f.u.), given the rigid-band shift with the assumption that Re3As7 possesses 56 valence electrons per f.u. and Re3As6.7In0.3 55.4 electrons. Therefore, both compounds should be metallic with a Pauli paramagnetic contribution to the total susceptibility χ = χdia + χP, where χdia is core diamagnetism, and χP = μB2·N(EF), with μB being the Bohr magneton [20]. The formula yields χP = 9 × 10⁻⁵ and 5.5 × 10⁻⁵ emu/mol for Re3As7 and S1, respectively.
Experimentally, both Re3As7 and S1 show substantial diamagnetism in the examined temperature range. However, the susceptibility curves, Figure 6, lie above the level of core diamagnetism χdia = −3.37 × 10⁻⁴ emu/mol, computed for a combination of Re7+ and As(V) [21]. Therefore, both pure and In-doped Re3As7 feature an additional paramagnetic contribution to the susceptibility. The experimental value of χP = χ − χdia = 1.20(7) × 10−4 emu/mol for Re3As7 is reasonably close to the one expected from the DOS at EF. However, the calculation of χP substantially depends on the estimation method of χdia, especially for a compound that cannot be considered as ionic. For this reason, the calculated value of χP may differ from the experimental one. The susceptibility of the S1 slightly decreases upon cooling but starts increasing below 80 K. While the low-temperature upturn could be due to a small number of paramagnetic impurities, the conspicuous increase in χ above 80 K does not conform to the Pauli paramagnetism and reflects deviations of S1 from a simple metal.
![[2190-4286-4-52-6]](/bjnano/content/figures/2190-4286-4-52-6.png?scale=2.4&max-width=1024&background=FFFFFF)
Figure 6: Magnetic susceptibility-versus-temperature plots for the Re3As7 and S1 samples. The contribution of core diamagnetism is shown as a dash-dotted line.
Figure 6: Magnetic susceptibility-versus-temperature plots for the Re3As7 and S1 samples. The contribution of...
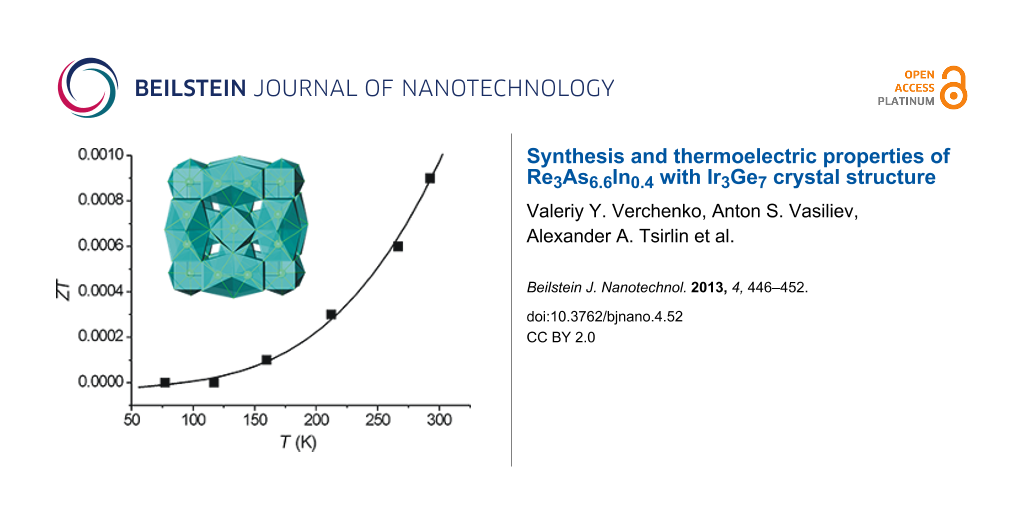
Figure 7 compiles the plots of the electric conductivity (σ), Seebeck coefficient (S), thermal conductivity (κ), and ZT in the temperature range of 77–300 K for S1. S is negative in this temperature range, evidencing that the S1 is an n-type conductor. However, the σ-versus-T behavior for the S1 sample is neither metallic nor classically semiconducting, because σ increases almost linearly with temperature. Thus, S1 can be regarded as a bad metal or degenerate semiconductor, considering the possible presence of defects, such as vacancies in its crystal structure, which was proposed earlier for Re3As7 [15]. In the Ir3Ge7 family, Re3As7−xGex exhibits n-type conductivity [13], while Mo3Sb5+δTe2−δ is a p-type conductor [11]. The obtained values of S for S1 are comparable with those for Re3As6.4Ge0.6 and Mo3Sb5.4Te1.6: −49, −72, and +55 µV·K−1 at 300 K, respectively [11,13]. Moreover, the extent of the substitution x in the Re3As7−xInx solid solution can be further optimized, and possibly lead to larger values of S. Unfortunately, the S1 displays considerably lower values of the electrical conductivity compared to both Re3As7−xGex and Re3As7−xSnx (0.1 ≤ x ≤ 0.6) [22]. For instance, the room-temperature value of 1090 Ω−1·cm−1 for Re3As6.4Ge0.6 [13] is about 3000 times larger than the observed value of 3.8 Ω−1·cm−1 for S1.
![[2190-4286-4-52-7]](/bjnano/content/figures/2190-4286-4-52-7.png?scale=2.0&max-width=1024&background=FFFFFF)
Figure 7: Thermoelectric properties of the S1 sample as a function of temperature. Solid lines are drawn to guide the eye.
Figure 7: Thermoelectric properties of the S1 sample as a function of temperature. Solid lines are drawn to g...
The thermal conductivity of the sample S1 is quite low. Its room-temperature value is 0.3 W·m−1·K−1, which is an order of magnitude lower than for the Ge- and Sn-substituted compounds. This may be caused by two factors: Firstly, it could be attributed to the preference of indium atoms for only one position within the crystal structure (increased structural complexity); secondly, relatively low density of the sample (about 70%) may diminish the thermal conductivity due to the sample porosity. The total thermal conductivity is a sum of the electronic (κe) and lattice (κL) parts. Taking into account the rather low electrical conductivity and applying the Wiedemann–Franz relation κe = σLT, where L is the ideal Lorentz number, we estimate that the electronic part of the total thermal conductivity is negligibly small, and the observed value is essentially the lattice contribution to the thermal conductivity.
Combining the electrical conductivity, Seebeck coefficient and thermal conductivity, we calculate the temperature dependence of ZT shown in Figure 7. ZT increases with temperature, and reaches ZT = 0.0008 at room temperature, which is 30 times lower than for Re3As7−xGex [13]. Given the compositional width of the Re3As7−xInx solid solution and the low thermal conductivity of the investigated sample, we note that the optimum combination of S and σ for Re3As7−xInx is still to be found.
Conclusion
Chemical modification of Re3As7 resulted in the formation of the new Re3As7-based solid solution Re3As7−xInx (x ≤ 0.5) with an Ir3Ge7 type of crystal structure. The indium for arsenic substitution occurs exclusively on the 12d site, thus keeping intact the As–As dumbbells with dAs–As = 2.538(5) Å. While Re3As7 shows a Pauli paramagnetic contribution to the magnetic susceptibility in line with the results of band-structure calculations, the S1 sample behaves as a bad metal or heavily doped semiconductor, with electrons being the dominant charge carriers. This compound combines low thermal conductivity with a relatively low electrical conductivity, and therefore, its thermoelectric figure of merit ZT reaches only 0.0008 at room temperature. Further optimization of the thermoelectric properties by varying the chemical composition of Re3As7−xInx is proposed.
References
-
Shevelkov, A. V. Russ. Chem. Rev. 2008, 77, 3–21. doi:10.1070/RC2008v077n01ABEH003746
Return to citation in text: [1] -
Rowe, D. M. CRC Handbook of Thermoelectrics; CRC Press: Boca Raton, FL, 1995. doi:10.1201/9781420049718
Return to citation in text: [1] -
Heremans, J. P.; Jovovic, V.; Toberer, E. S.; Saramat, A.; Kurosaki, K.; Charoenphakdee, A.; Yamanaka, S.; Snyder, G. J. Science 2008, 321, 554–557. doi:10.1126/science.1159725
Return to citation in text: [1] -
Venkatasubramanian, R.; Colpitts, T.; Watko, E.; Lamvik, M.; El-Masry, N. J. Cryst. Growth 1997, 170, 817–821. doi:10.1016/S0022-0248(96)00656-2
Return to citation in text: [1] -
Shi, X.; Yang, J.; Salvador, J.; Chi, M.; Cho, J.; Wang, H.; Bai, S.; Yang, J.; Zhang, W.; Chen, L. J. Am. Chem. Soc. 2011, 133, 7837–7846. doi:10.1021/ja111199y
Return to citation in text: [1] -
Rogl, G.; Grytsiv, A.; Rogl, P.; Bauer, E.; Zehetbauer, M. Intermetallics 2011, 19, 546–555. doi:10.1016/j.intermet.2010.12.001
Return to citation in text: [1] -
Shevelkov, A. V.; Kovnir, K. Zintl Clathrates. In Zintl Phases; Fässler, T. F., Ed.; Structure and Bonding, Vol. 139; Springer-Verlag: Berlin Heidelberg, 2011; pp 97–142. doi:10.1007/430_2010_25
Return to citation in text: [1] -
Iverson, B. B. J. Mater. Chem. 2010, 20, 10778–10787. doi:10.1039/c0jm02000a
Return to citation in text: [1] -
Zaikina, J. V.; Mori, T.; Kovnir, K. A.; Teschner, D.; Senyshin, A.; Schwarz, U.; Grin, Y.; Shevelkov, A. V. Chem.–Eur. J. 2010, 16, 12582–12589. doi:10.1002/chem.201001990
Return to citation in text: [1] -
Gougeon, P.; Gall, P.; Al Orabi, R. A. R.; Fontaine, B.; Gautier, R.; Potel, M.; Zhou, T.; Lenoir, B.; Colin, M.; Candolfi, C.; Dauscher, A. Chem. Mater. 2012, 24, 2899–2908. doi:10.1021/cm3009557
Return to citation in text: [1] -
Gascoin, F.; Rasmussen, J.; Snyder, G. J. J. Alloys Compd. 2007, 427, 324–329. doi:10.1016/j.jallcom.2006.03.030
Return to citation in text: [1] [2] [3] -
Soheilnia, N.; Giraldi, J.; Assoud, A.; Zhang, H.; Tritt, T. M.; Kleinke, H. J. Alloys Compd. 2008, 448, 148–152. doi:10.1016/j.jallcom.2006.10.056
Return to citation in text: [1] -
Soheilnia, N.; Xu, H.; Zhang, H.; Tritt, T. M.; Swainson, I.; Kleinke, H. Chem. Mater. 2007, 19, 4063–4068. doi:10.1021/cm0708517
Return to citation in text: [1] [2] [3] [4] [5] [6] [7] [8] -
Häussermann, U.; Elding-Pontén, M.; Svensson, C.; Lidin, S. Chem.–Eur. J. 1998, 4, 1007–1015. doi:10.1002/(SICI)1521-3765(19980615)4:6<1007::AID-CHEM1007>3.3.CO;2-Z
Return to citation in text: [1] -
Jensen, P.; Kjekshus, A.; Skansen, T. J. Less-Common Met. 1969, 17, 455–458. doi:10.1016/0022-5088(69)90073-3
Return to citation in text: [1] [2] [3] [4] -
Koepernik, K.; Eschrig, H. Phys. Rev. B 1999, 59, 1743–1757. doi:10.1103/PhysRevB.59.1743
Return to citation in text: [1] -
Perdew, J. P.; Wang, Y. Phys. Rev. B 1992, 45, 13244–13249. doi:10.1103/PhysRevB.45.13244
Return to citation in text: [1] -
Blöchl, P. E.; Jepsen, O.; Andersen, O. K. Phys. Rev. B 1994, 49, 16223–16233. doi:10.1103/PhysRevB.49.16223
Return to citation in text: [1] -
Kleinke, H. Chem. Mater. 2010, 22, 604–611. doi:10.1021/cm901591d
Return to citation in text: [1] -
Ashcroft, N. W.; Mermin, N. D. CRC Solid State Physics; Brooks/Cole: Belmont, CA, 1976.
Return to citation in text: [1] -
Bain, G. A.; Berry, J. F. J. Chem. Educ. 2008, 85, 532–536. doi:10.1021/ed085p532
Return to citation in text: [1] -
Xu, H.; Holgate, T.; He, J.; Su, Z.; Tritt, T. M.; Kleinke, H. J. Electron. Mater. 2009, 38, 1030–1036. doi:10.1007/s11664-008-0623-0
Return to citation in text: [1]
| 22. | Xu, H.; Holgate, T.; He, J.; Su, Z.; Tritt, T. M.; Kleinke, H. J. Electron. Mater. 2009, 38, 1030–1036. doi:10.1007/s11664-008-0623-0 |
| 13. | Soheilnia, N.; Xu, H.; Zhang, H.; Tritt, T. M.; Swainson, I.; Kleinke, H. Chem. Mater. 2007, 19, 4063–4068. doi:10.1021/cm0708517 |
| 13. | Soheilnia, N.; Xu, H.; Zhang, H.; Tritt, T. M.; Swainson, I.; Kleinke, H. Chem. Mater. 2007, 19, 4063–4068. doi:10.1021/cm0708517 |
| 1. | Shevelkov, A. V. Russ. Chem. Rev. 2008, 77, 3–21. doi:10.1070/RC2008v077n01ABEH003746 |
| 7. | Shevelkov, A. V.; Kovnir, K. Zintl Clathrates. In Zintl Phases; Fässler, T. F., Ed.; Structure and Bonding, Vol. 139; Springer-Verlag: Berlin Heidelberg, 2011; pp 97–142. doi:10.1007/430_2010_25 |
| 17. | Perdew, J. P.; Wang, Y. Phys. Rev. B 1992, 45, 13244–13249. doi:10.1103/PhysRevB.45.13244 |
| 5. | Shi, X.; Yang, J.; Salvador, J.; Chi, M.; Cho, J.; Wang, H.; Bai, S.; Yang, J.; Zhang, W.; Chen, L. J. Am. Chem. Soc. 2011, 133, 7837–7846. doi:10.1021/ja111199y |
| 6. | Rogl, G.; Grytsiv, A.; Rogl, P.; Bauer, E.; Zehetbauer, M. Intermetallics 2011, 19, 546–555. doi:10.1016/j.intermet.2010.12.001 |
| 15. | Jensen, P.; Kjekshus, A.; Skansen, T. J. Less-Common Met. 1969, 17, 455–458. doi:10.1016/0022-5088(69)90073-3 |
| 3. | Heremans, J. P.; Jovovic, V.; Toberer, E. S.; Saramat, A.; Kurosaki, K.; Charoenphakdee, A.; Yamanaka, S.; Snyder, G. J. Science 2008, 321, 554–557. doi:10.1126/science.1159725 |
| 4. | Venkatasubramanian, R.; Colpitts, T.; Watko, E.; Lamvik, M.; El-Masry, N. J. Cryst. Growth 1997, 170, 817–821. doi:10.1016/S0022-0248(96)00656-2 |
| 15. | Jensen, P.; Kjekshus, A.; Skansen, T. J. Less-Common Met. 1969, 17, 455–458. doi:10.1016/0022-5088(69)90073-3 |
| 2. | Rowe, D. M. CRC Handbook of Thermoelectrics; CRC Press: Boca Raton, FL, 1995. doi:10.1201/9781420049718 |
| 16. | Koepernik, K.; Eschrig, H. Phys. Rev. B 1999, 59, 1743–1757. doi:10.1103/PhysRevB.59.1743 |
| 12. | Soheilnia, N.; Giraldi, J.; Assoud, A.; Zhang, H.; Tritt, T. M.; Kleinke, H. J. Alloys Compd. 2008, 448, 148–152. doi:10.1016/j.jallcom.2006.10.056 |
| 14. | Häussermann, U.; Elding-Pontén, M.; Svensson, C.; Lidin, S. Chem.–Eur. J. 1998, 4, 1007–1015. doi:10.1002/(SICI)1521-3765(19980615)4:6<1007::AID-CHEM1007>3.3.CO;2-Z |
| 11. | Gascoin, F.; Rasmussen, J.; Snyder, G. J. J. Alloys Compd. 2007, 427, 324–329. doi:10.1016/j.jallcom.2006.03.030 |
| 13. | Soheilnia, N.; Xu, H.; Zhang, H.; Tritt, T. M.; Swainson, I.; Kleinke, H. Chem. Mater. 2007, 19, 4063–4068. doi:10.1021/cm0708517 |
| 9. | Zaikina, J. V.; Mori, T.; Kovnir, K. A.; Teschner, D.; Senyshin, A.; Schwarz, U.; Grin, Y.; Shevelkov, A. V. Chem.–Eur. J. 2010, 16, 12582–12589. doi:10.1002/chem.201001990 |
| 10. | Gougeon, P.; Gall, P.; Al Orabi, R. A. R.; Fontaine, B.; Gautier, R.; Potel, M.; Zhou, T.; Lenoir, B.; Colin, M.; Candolfi, C.; Dauscher, A. Chem. Mater. 2012, 24, 2899–2908. doi:10.1021/cm3009557 |
| 13. | Soheilnia, N.; Xu, H.; Zhang, H.; Tritt, T. M.; Swainson, I.; Kleinke, H. Chem. Mater. 2007, 19, 4063–4068. doi:10.1021/cm0708517 |
| 13. | Soheilnia, N.; Xu, H.; Zhang, H.; Tritt, T. M.; Swainson, I.; Kleinke, H. Chem. Mater. 2007, 19, 4063–4068. doi:10.1021/cm0708517 |
| 18. | Blöchl, P. E.; Jepsen, O.; Andersen, O. K. Phys. Rev. B 1994, 49, 16223–16233. doi:10.1103/PhysRevB.49.16223 |
| 15. | Jensen, P.; Kjekshus, A.; Skansen, T. J. Less-Common Met. 1969, 17, 455–458. doi:10.1016/0022-5088(69)90073-3 |
| 11. | Gascoin, F.; Rasmussen, J.; Snyder, G. J. J. Alloys Compd. 2007, 427, 324–329. doi:10.1016/j.jallcom.2006.03.030 |
| 11. | Gascoin, F.; Rasmussen, J.; Snyder, G. J. J. Alloys Compd. 2007, 427, 324–329. doi:10.1016/j.jallcom.2006.03.030 |
| 13. | Soheilnia, N.; Xu, H.; Zhang, H.; Tritt, T. M.; Swainson, I.; Kleinke, H. Chem. Mater. 2007, 19, 4063–4068. doi:10.1021/cm0708517 |
| 15. | Jensen, P.; Kjekshus, A.; Skansen, T. J. Less-Common Met. 1969, 17, 455–458. doi:10.1016/0022-5088(69)90073-3 |
| 13. | Soheilnia, N.; Xu, H.; Zhang, H.; Tritt, T. M.; Swainson, I.; Kleinke, H. Chem. Mater. 2007, 19, 4063–4068. doi:10.1021/cm0708517 |
| 20. | Ashcroft, N. W.; Mermin, N. D. CRC Solid State Physics; Brooks/Cole: Belmont, CA, 1976. |
| 21. | Bain, G. A.; Berry, J. F. J. Chem. Educ. 2008, 85, 532–536. doi:10.1021/ed085p532 |
| 13. | Soheilnia, N.; Xu, H.; Zhang, H.; Tritt, T. M.; Swainson, I.; Kleinke, H. Chem. Mater. 2007, 19, 4063–4068. doi:10.1021/cm0708517 |
© 2013 Verchenko et al; licensee Beilstein-Institut.
This is an Open Access article under the terms of the Creative Commons Attribution License (http://creativecommons.org/licenses/by/2.0), which permits unrestricted use, distribution, and reproduction in any medium, provided the original work is properly cited.
The license is subject to the Beilstein Journal of Nanotechnology terms and conditions: (http://www.beilstein-journals.org/bjnano)