Abstract
A graphene oxide (GO) solution was irradiated by a Xenon lamp to form reduced graphene oxide (RGO). After irradiation, the epoxy, the carbonyl and the hydroxy groups are gradually removed from GO, resulting in an increase of sp2 π-conjugated domains and defect carbons with holes for the formed RGO. The RGO conductivity increases due to the restoration of sp2 π-conjugated domains. The photocatalytic activity of EY-RGO/Pt for hydrogen evolution was investigated with eosin Y (EY) as a sensitizer of the RGO and Pt as a co-catalyst. When the irradiation time is increased from 0 to 24 h the activity rises, and then reaches a plateau. Under optimum conditions (pH 10.0, 5.0 × 10⁻⁴ mol L−1 EY, 10 μg mL−1 RGO), the maximal apparent quantum yield (AQY) of EY-RGO24/Pt for hydrogen evolution rises up to 12.9% under visible light irradiation (λ ≥ 420 nm), and 23.4% under monochromatic light irradiation at 520 nm. Fluorescence spectra and transient absorption decay spectra of the EY-sensitized RGO confirm that the electron transfer ability of RGO increases with increasing irradiation time. The adsorption quantity of EY on the surface of RGO enhances, too. The two factors ultimately result in an enhancement of the photocatalytic hydrogen evolution over EY-RGO/Pt with increasing irradiation time. A possible mechanism is discussed.
Introduction
Hydrogen is an efficient and green energy carrier. Photocatalytic water splitting into hydrogen by means of solar energy and semiconductor photocatalysts is a environmentally friendly way to produce storable energy [1-4]. In order to enhance the activity of photocatalysts for hydrogen evolution, various graphene-based composite photocatalysts, such as graphene/TiO2 composite and graphene/ZnO composite, have recently been reported [5-8]. Kim et al. [8] have reported that two graphene/TiO2 composites, a nanographene shell on a TiO2 core and TiO2 nanoparticles on a graphene sheet, exhibit a higher photocatalytic H2 evolution than TiO2 under UV irradiation. This can be attributed to an efficient electron transfer from TiO2 to graphene [9,10]. Interestingly, single reduced graphene oxide itself (RGO) shows a higher activity as a semiconductor under UV irradiation [11,12]. Yeh et al. [12] reported that RGO sheets with in situ photoreduced platinum displayed a high activity for hydrogen evolution from an aqueous methanol solution. However, the RGO exhibits a very low photocatalytic activity under visible light irradiation.
Eosin Y (EY), a xanthene dye, is a very good sensitizer [13-18]. EY has been used to sensitize various matrixes such as TiO2 [13], Na2Ti2O4(OH)2 nanotubes [14], g-C3N4 [15], and α-[AlSiW11(H2O)O39]5− [18], and the sensitized photocatalysts are characterized by a high activity for H2 evolution under visible light irradiation. Recently, to improve the photocatalytic activity for hydrogen evolution in the visible light region, EY has been employed to sensitize RGO, and the sensitized photocatalyst displays an increased photoactivity for hydrogen evolution [19-21]. Mou et al. [19] found that the photocatalytic activity of EY-RGO for hydrogen evolution was superior to that of EY-GO. However, the activity of the former was still very low. Min and Lu [20] demonstrated a successful example of enhancing H2 evolution activity by using RGO as an efficient electron relay between the photoexcited EY and the loaded Pt co-catalyst, which shows an AQY of 4.15% under visible light irradiation. In these works, RGO was obtained by a chemical reduction of GO with hydrazine or sodium borohydride as a reductant.
Graphene, an atom-thick two-dimensional (2D) sheet of sp2-hybrized carbon, has received tremendous research interests based on its extraordinary electronic, thermal, optical and excellent electron transport properties [21,22]. Graphene can be easily obtained by reducing graphene oxide (GO), which is a cheap and scalable preparation method [23-26]. The GO contains not only hydroxy and epoxy groups in the 2D sheet, but also carbonyl and carboxyl groups at the edges of the sheet [27,28]. The oxygen-containing groups in the sheet break the sp2 π-conjugation, leading to the formation of oxidized aliphatic six-membered rings with sp3-hybridization in the GO layer. As a result, the conductivity of GO decreases greatly compared with that of graphene. Amongst various methods for the reduction of GO to form RGO, photoreaction (photoreduction) is “green” without any toxic chemical reagents. Moreover, it is easy to control the degree of reduction by applying different UV irradiation times [29-32]. The RGO prepared by UV irradiation is of high dispersion, can be stored for a long time without getting aggregated, and exists in the quasi homogeneous form [33,34].
In this work, we prepared RGO starting from an aqueous GO solution by controlling UV irradiation time. The RGO solution and its powder were denoted as RGOx and RGOx-p, respectively, where x (in hours) represents the particular UV irradiation time. The photocatalytic activity of EY-sensitized RGOx was investigated by using Pt as a co-catalyst and trimethylamine (TMA) as a sacrificial electron donor. To the best of our knowledge, studies on the effect of irradiation time on the performance of RGOx for the dye sensitized H2 generation have not been reported so far. The sensitization activity for hydrogen evolution under visible light illumination is much higher than that of EY-RGO/Pt produced by chemical reduction methods in the literature [19,20]. A possible mechanism is discussed.
Results and Discussion
The effect of irradiation time on the performance of RGOx
Figure 1 shows UV–vis spectra of GO and RGOx solution. The peak at 232 nm is due to the C=C bond in an aromatic ring [35], whereas the broad shoulder peak at 291 nm can be assigned to C=O [36]. The absorption over 291 nm is expected to be caused by the conjugated fused ring plane [37]. An increase of the irradiation time from 0 to 24 h entails an increase of the absorption strength of the RGOx solution over 291 nm and a red-shift of the absorption. The absorption of RGO36 is close to that of RGO24, indicating that the deoxygenation reaction takes place slowly at that stage [38]. This can be attributed to an enhancement of π-conjugated sp2 domains (restoration of sp2 π-conjugated network) by the removal of oxygen-containing groups whose carbon atoms are sp3 hybridized, and a decrease of sp3 domains (see Mechanism section, Scheme 1). The inset of Figure 1 shows a picture of GO and RGO24. The GO dispersion is yellow–brown and semitransparent, gradually changes to dark brown after irradiation (not shown here), and finally turns black and opaque after 24 h of irradiation. This indicates an increase of the degree of sp2 conjugation by a regeneration of the sp2 π-conjugated network [35].
![[2190-4286-5-92-1]](/bjnano/content/figures/2190-4286-5-92-1.svg?scale=2.0&max-width=1024&background=FFFFFF)
Figure 1: UV–vis spectra of (a) GO, (b) RGO4, (c) RGO12, (d) RGO24, and (e) RGO36 solution (20 μg mL−1). The inset is an image of GO and RGO24.
Figure 1: UV–vis spectra of (a) GO, (b) RGO4, (c) RGO12, (d) RGO24, and (e) RGO36 solution (20 μg mL−1). The ...
Figure 2A displays ATR-IR spectra of GO-p, RGO4-p and RGO24-p. The peak intensity at 1626 cm−1, which can be assigned to C=C [39], increases with irradiation time, whereas the epoxy C–O peak at 993 cm−1 [12] disappears after irradiation of 24 h. These suggest that epoxy C–O–C has been reduced to produce sp2 carbons [40]. Figure 2B shows XPS spectra of C1s for GO-p, RGO4-p and RGO24-p. The deconvoluted peaks centered in a binding energy range of 284.8–285.0 eV and 287–287.2 eV are attributed to C–C, C=C, and C–H bonds, and C–O bonds (C–O–C and C–OH), respectively [30]. The deconvoluted peaks at binding energy of 287.8 eV and 289.0 eV belongs to C=O and O=C–OH respectively [41]. The peak intensities of epoxy C–O–C and C=O decrease with increasing irradiation time, which suggests that most of epoxy C–O–C and C=O are removed to produce sp2 domains [40]. Clearly, the peak intensities of C–C, C=C, and C–H bonds increase. As shown in Table 1, the O/C atomic ratio decreases from 0.33 in the GO sample to 0.26 after 24 h of photoreaction. This further indicates the restoration of the sp2 π-conjugated network for RGO after the photoreaction. Due to restoration of the sp2 π-conjugated network in RGOx, its conductivity is expected to increase [42]. To verify this enhancement, the electrochemical impedance spectroscopy (EIS) of GO, RGO4 and RGO24 were measured. Figure 2C shows the Nyquist diagrams for GO, RGO4 and RGO24. The semicircles correspond to the charge transfer resistance (RCT) [43] and become smaller and smaller after irradiation. This suggests that their conductivity order is RGO24 > RGO4 > GO, which is due to the increase of the aromatic ring plane, more specifically, the increase of sp2 π-conjugated domains [44].
![[2190-4286-5-92-2]](/bjnano/content/figures/2190-4286-5-92-2.svg?scale=2.0&max-width=1024&background=FFFFFF)
Figure 2: (A) ATR-IR spectra of GO-p, RGO4-p and RGO24-p, (B) XPS spectra of C1s for GO-p, RGO4-p and RGO24-p, and (C) Nyquist diagrams of GO, RGO4 and RGO24.
Figure 2: (A) ATR-IR spectra of GO-p, RGO4-p and RGO24-p, (B) XPS spectra of C1s for GO-p, RGO4-p and RGO24-p...
Table 1: Peak area ratios of oxygen-containing bonds to CC bonds and O/C ratio obtained from Figure 2B.
| sample | AC–O/ACC | AC=O/ACC | AOCOH/ACC | O/C |
|---|---|---|---|---|
| GO | 0.69 | 0.13 | 0.05 | 0.33 |
| RGO4 | 0.59 | 0.10 | 0.07 | 0.30 |
| RGO24 | 0.42 | 0.06 | 0.08 | 0.26 |
The interaction between EY and GO/RGOx
The chemical structure of EY is shown in Figure 3. The benzoate ring is perpendicular to the xanthenes moiety. The main interaction between EY and graphene is through π–π stacking [19-21] of the xanthene moiety (the fused ring) of EY with sp2 π-conjugated domains of graphene.
![[2190-4286-5-92-3]](/bjnano/content/figures/2190-4286-5-92-3.svg?scale=2.0&max-width=1024&background=FFFFFF)
Table 2 lists the amount of adsorbed EY on the surface of RGOx. Before the irradiation, the adsorption amount of EY on the GO surface is 11.7 μmol g−1. After irradiation of GO for 4, 12 and 24 h, the adsorption amount increases to 15.0, 32.7 and 74.3 μmol g−1, respectively. This is because the sp2 domains of RGOx increase with the reaction time (see Mechanism section, Scheme 1). As a result, the π–π stacking interaction between EY and RGO becomes stronger.
To further confirm the interaction between EY and GO/RGOx, the fluorescence spectra of the mixture of EY and GO or RGOx were measured, as shown in Figure 4. The inset of Figure 4 displays a strong fluorescence peak of EY (about 6.8 × 10³ a.u.) at 542 nm. This can be attributed to the large visible light absorption by its conjugated xanthenes structure and the strong recombination of photo-excited electron–hole pairs. When GO is added to the EY solution, the fluorescence intensity of EY at 541.6 nm sharply declines to about 2.8 × 10³ a.u. The addition of RGO24 results in a great fluorescence quenching of EY (Figure 4d,), the emission peak intensity decreases to about 1.4 × 10³ a.u., and the fluorescence peak shifts from 541.6 to 540.0 nm. This is because the number of sp2 π-conjugated domains (larger adsorption amount for EY) and the conductivity of RGOx increase with longer irradiation times, thereby enhancing the ability for a photo-induced electron transfer from the excited dye molecules to RGOx. The slight blue shift suggests that an intermolecular π-π stacking interaction between RGO24 and EY is stronger than the interaction between GO and EY [20].
![[2190-4286-5-92-4]](/bjnano/content/figures/2190-4286-5-92-4.svg?scale=2.0&max-width=1024&background=FFFFFF)
Figure 4: Fluorescence spectra of EY-RGOx in TMA solution. The inset shows the fluorescence spectrum of EY in TMA solution. Conditions: 30 μg mL−1 GO or RGOx; 1.0 × 10⁻⁵ mol L−1 EY; 7.7 × 10⁻² mol L−1 TMA.
Figure 4: Fluorescence spectra of EY-RGOx in TMA solution. The inset shows the fluorescence spectrum of EY in...
To further confirm the increased ability to transfer electrons between RGOx and EY, transient absorption decay spectra of 3EY* at 580 nm in EY-RGOx and EY-GO systems were measured on a laser flash photolysis spectrometer (Figure 5). It is well-known that EY molecules are excited to the singlet excited state (1EY*) which is of short-life, and then produce long-lived triplet excited states (3EY*) by inter-system crossing [45,46]. 3EY* has an absorption peak below 580 nm [47]. In the absence of GO or RGOx, the lifetime of 3EY* is 103.5 μs, while in the presence of GO, the lifetime of 3EY* is reduced to 93.5 μs. The addition of RGO4 and RGO24 yields a declined lifetime of 3EY* to 89.4 and 79.6 μs, respectively. This result confirms that RGOx can transfer the electron of 3EY* more effectively than GO [16]. The ability to transfer electrons in decreasing order is RGO24 > RGO4 > GO, which is in accordance with the result of the fluorescence spectra.
![[2190-4286-5-92-5]](/bjnano/content/figures/2190-4286-5-92-5.svg?scale=2.0&max-width=1024&background=FFFFFF)
Figure 5: Transient absorption decay of 3EY* followed at 580 nm for (A) EY, (B) EY−GO, (C) EY−RGO4, and (D) EY−RGO24 under pulse irradiation of 532 nm. Conditions: 30 μg mL−1 GO or RGOx; 2.0 × 10⁻⁵ mol L−1 EY.
Figure 5: Transient absorption decay of 3EY* followed at 580 nm for (A) EY, (B) EY−GO, (C) EY−RGO4, and (D) E...
Photocatalytic H2 evolution
Figure 6 shows the photocatalytic H2 evolution of EY-sensitized GO and RGOx under visible light irradiation. The amount of H2 evolution increases with an increase of the irradiation time from 0 to 24 h, and then keeps almost unchanged. In the absence of GO or RGOx, the photocatalytic activity of the EY–Pt system is 21.5 μmol, whereas in the absence of EY, no hydrogen is produced from the RGO24/Pt system. This suggests that the visible light activity is comes from the EY sensitization. When GO is added to the EY solution, the photocatalytic activity is 50.1 μmol. When RGO24 is added, the H2 evolution reaches 156.8 μmol. The activity increases by a factor of 3.1 compared to the activity of EY-GO/Pt. This result can be attributed to an enhancement of the adsorption quantity of EY on the surface of RGOx and the increased electron transfer ability (Table 2 and Figures 2,4,5). However, further irradiation of GO does not lead significant changes of the photocatalytic activity. This may be attributed to a slow increase of the sp2 domains of RGOx after an irradiation time of over 24 h.
![[2190-4286-5-92-6]](/bjnano/content/figures/2190-4286-5-92-6.svg?scale=2.0&max-width=1024&background=FFFFFF)
Figure 6: Photocatalytic H2 evolution of EY sensitized GO and RGOx. Conditions: 30 μg mL−1 GO or RGOx; 1.45 × 10⁻⁴ mol L−1 EY; 4.6 × 10⁻⁶ mol L−1 H2PtCl6; 7.7 × 10⁻² mol L−1 TMA, pH 11.9; irradiation 2 h.
Figure 6: Photocatalytic H2 evolution of EY sensitized GO and RGOx. Conditions: 30 μg mL−1 GO or RGOx; 1.45 ×...
We also investigated the effects of the pH value, EY and RGO24 concentration on the photocatalytic activity for hydrogen evolution over EY-RGO24/Pt. Figure 7A shows that the pH value has a remarkable effect on the photocatalytic activity in the presence of TMA as a sacrificial donor. The hydrogen evolution of EY-RGO24/Pt increases with a rise of the pH from 7.0 to 10.0, and then decreases starting at 11.9 (nature pH). When the pH value of the TMA solution is 7.0, no hydrogen evolution is observed, because TMA (pKb = 4.22) is completely protonated and TMAH+ cannot act as an effective electron donor [48]. With the pH value increasing, more and more TMA species exists in its molecular form. Thus, the activity increases with the pH value and reaches a maximal value at pH 10.0. However, over pH 10.0, the activity decreases. This is caused by the increasing negativity of the redox potential of H+/H2, which is disadvantageous for an efficient generation of hydrogen [49].
![[2190-4286-5-92-7]](/bjnano/content/figures/2190-4286-5-92-7.png?scale=2.0&max-width=1024&background=FFFFFF)
Figure 7: (A) The effect of the pH value on the photocatalytic activity of EY-RGO24/Pt. Conditions: 30 μg mL−1 RGO24; 1.45 × 10⁻⁴ mol L−1 EY; 4.6 × 10⁻⁶ mol L−1 H2PtCl6; 7.7 × 10⁻² mol L−1 TMA; irradiation 2 h. (B) The effect of the EY concentration on the photocatalytic H2 evolution over EY-RGO24/Pt. Conditions: 30 μg mL−1 RGO24; 4.6 × 10⁻⁶ mol L−1 H2PtCl6; 7.7 × 10⁻² mol L−1 TMA, pH 10.0; irradiation 2 h. (C) The effect of the RGO24 concentration on the photocatalytic H2 evolution over EY-RGO24/Pt. Conditions: 5.0 × 10⁻⁴ mol L−1 EY; 4.6 × 10⁻⁶ mol L−1 H2PtCl6; 7.7 × 10⁻² mol L−1 TMA, pH 10.0; irradiation 2 h.
Figure 7: (A) The effect of the pH value on the photocatalytic activity of EY-RGO24/Pt. Conditions: 30 μg mL−1...
Figure 7B displays the effect of the concentration of EY on the photocatalytic activity. The activity increases with increasing concentrations of EY. The maximal activity is at 5.0 × 10⁻⁴ mol L−1 and then decreases with higher concentrations. When the concentration of EY is 2.0 × 10⁻⁵ mol L−1, the amount of generated hydrogen in 2 h is very low, only 0.7 μmol. This may be due to the deceleration of the light absorption of EY by RGO24, which results in the formation of few photo-excited electrons at low concentrations of dye. When the EY concentration increases to 5.0 × 10⁻⁴ mol L−1, more and more EY molecules adsorb at RGO24, which can effectively absorb photons and transfer photo-induced electrons into the sp2 domains of RGO24 for hydrogen evolution. Nevertheless, with a further increase of the concentration of EY, more and more free EY molecules are in solution. These free dye molecules cannot effectively transfer their photo-excited electrons to RGO. Moreover, excess EY in solution may not only screen the light absorption of EY-RGO but also produce self-quenching, which greatly decreases the utilization efficiency of the incident light [20,50]. Thus, the photocatalytic activity decreases at 1.0 × 10⁻³ mol L−1 EY.
Figure 7C shows the influence of the concentration of RGO24 on the activity of hydrogen evolution. The activity enhances with an increase of the RGO24 concentration and then declines. The optimal concentration of RGO24 is 10 μg mL−1, and the corresponding activity for hydrogen evolution is 290 μmol. Its calculated AQY reaches 12.9%, which is much higher than the reported AQY of EY-sensitized RGO obtained by sodium borohydride reduction [20]. The activity decreases notably at higher RGO24 concentrations, which is ascribed to a strong visible light absorption of RGO24 (Figure 1), which shields the absorption of EY.
The wavelength dependence of the photocatalytic H2 evolution of EY-RGO24/Pt was investigated. Figure 8 displays the AQY for EY-RGO24/Pt as a function of the incident light wavelength. AQY increases with increasing wavelength, the highest AQY is 23.4% at 520 nm, and then it decreases. This corresponds with the absorption wavelength of EY in TMA solution (inset of Figure 8).
![[2190-4286-5-92-8]](/bjnano/content/figures/2190-4286-5-92-8.svg?scale=2.0&max-width=1024&background=FFFFFF)
Figure 8: AQY of the EY-RGO24/Pt photocatalyst plotted as a function of the wavelength of the incident light. Conditions: 10 μg mL−1 RGO24; 5.0 × 10⁻⁴ mol L−1 EY; 4.6 × 10⁻⁶ mol L−1 H2PtCl6; 7.7 × 10⁻² mol L−1 TMA, pH 10.0; irradiation 2 h. The inset is the UV–vis absorption spectrum of EY in TMA solution.
Figure 8: AQY of the EY-RGO24/Pt photocatalyst plotted as a function of the wavelength of the incident light....
Mechanism
When GO is irradiated by UV light, holes h+ (in HOMO) and electrons e− (in LUMO) are produced in its π-conjugated domains due to π–π* band excitation [35]. These holes (h+) and electrons (e−) react with the oxygen-containing groups of GO sheets, e.g., the epoxy groups. The reactions can be expressed as follows [51]:
![[2190-4286-5-92-i3]](/bjnano/content/inline/2190-4286-5-92-i3.svg?max-width=590&scale=1.18182)
![[2190-4286-5-92-i4]](/bjnano/content/inline/2190-4286-5-92-i4.svg?max-width=590&scale=1.18182)
Similarly, photoreactions of the hydroxy group of the GO can be described by the following reactions:
![[2190-4286-5-92-i5]](/bjnano/content/inline/2190-4286-5-92-i5.svg?max-width=590&scale=1.18182)
![[2190-4286-5-92-i6]](/bjnano/content/inline/2190-4286-5-92-i6.svg?max-width=590&scale=1.18182)
For the C=O and O=C–OH groups of GO, similar reactions take place to form defect carbon atoms. In our irradiation system for GO, due to the presence of O2 (see Experimental section), the solved O2 would trap the electrons:
![[2190-4286-5-92-i7]](/bjnano/content/inline/2190-4286-5-92-i7.svg?max-width=590&scale=1.18182)
The formed O2− is a strong oxidant which can also oxidize the oxygen-containing groups to form CO2 and defect carbon atoms. However, at a later stage of the reaction, the oxidation action decreases, as more and more O2 is consumed in the closed reaction system.
The formed defect carbons (radicals) are active, and are expected to react to form C=C. As shown in Scheme 1, π-conjugated domains extend, which is consistent with the results shown in Figure 1 and Figure 2. At the same time , many holes in RGOx sheets occur caused by the oxidation of the holes and O2− produced by the UV excitation. Figure 9A and Figure 9B show the morphology change of GO before and after the photoreaction. Before the irradiation, GO are complete sheets except for a few wrinkles. After the irradiation, many small holes occur in the RGO24 sheet (Figure 9B), which is consistent with the model shown in Scheme 1. The model is similar to the one reported in [51].
![[2190-4286-5-92-i1]](/bjnano/content/inline/2190-4286-5-92-i1.png?scale=2.0&max-width=1024&background=FFFFFF)
Scheme 1: Schematic diagram of the reduction of GO by irradiation.
Scheme 1: Schematic diagram of the reduction of GO by irradiation.
![[2190-4286-5-92-9]](/bjnano/content/figures/2190-4286-5-92-9.jpg?scale=2.0&max-width=1024&background=FFFFFF)
Figure 9: TEM images of GO (A), RGO24 (B), RGO24 with deposited Pt (C), and HRTEM image of deposited Pt (D). The inset of Figure 9D is the EDS spectrum.
Figure 9: TEM images of GO (A), RGO24 (B), RGO24 with deposited Pt (C), and HRTEM image of deposited Pt (D). ...
The ferromagnetic properties [51] of RGO obtained by a photoreaction and its paramagnetic resonance (EPR) spectra [38] indicate that there are some radicals or defect carbons at the zigzag hole edges of the RGO. The defect carbons or radicals are stable due to larger π-conjugated domains, which are expected to exist for a long time at room temperature [38,52].
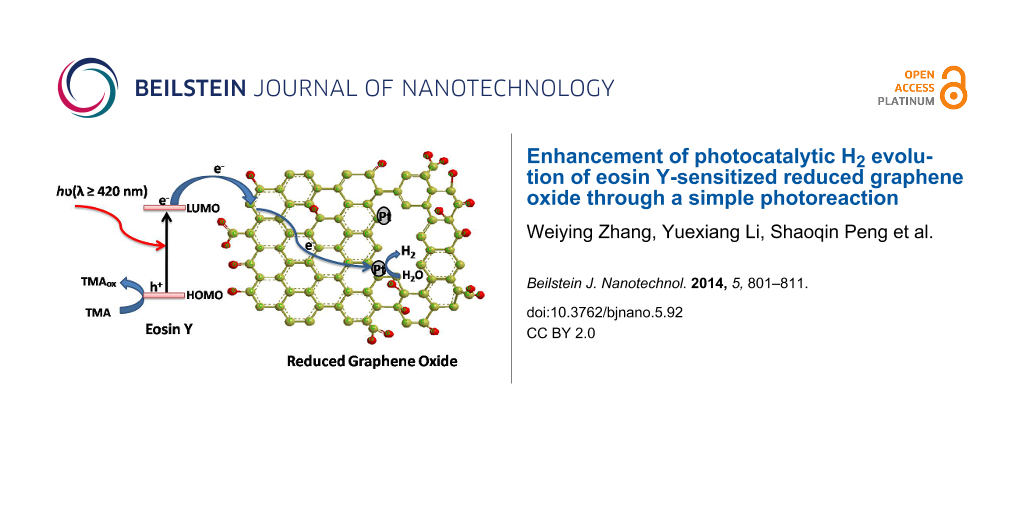
When EY adsorbed at RGOx absorbs the visible light, the excited EY* forms by transferring its HOMO electron to the LUMO. The formed EY* injects its electron into the RGOx to produce EY+. The electron can be transferred to the radicals or defect carbons of RGOx via the π-conjugated domains (higher conductivity) to form RGOx− ions. Then, EY+ is transformed into EY by the electron donor TMA. These processes can be described by the following reactions.
![[2190-4286-5-92-i8]](/bjnano/content/inline/2190-4286-5-92-i8.svg?max-width=590&scale=1.18182)
![[2190-4286-5-92-i9]](/bjnano/content/inline/2190-4286-5-92-i9.svg?max-width=590&scale=1.18182)
![[2190-4286-5-92-i10]](/bjnano/content/inline/2190-4286-5-92-i10.svg?max-width=590&scale=1.18182)
The formed RGOx− can reduce PtCl62− at the zigzag edges of the RGOx.
![[2190-4286-5-92-i11]](/bjnano/content/inline/2190-4286-5-92-i11.svg?max-width=590&scale=1.18182)
Figure 9C shows the Pt nanoparticles deposited on the surface of RGO24 by an in situ photoreduction of H2PtCl6 with EY sensitization. It clearly displays the uniform Pt aggregated nanograins with a diameter of 24–30 nm. High-resolution TEM (Figure 9D) shows that the Pt nanograins consists of small Pt nanoparticles with a diameter of about 5 nm. The lattice spacing of 0.226 nm could be indexed to the {111} planes of Pt. After the Pt deposition, the electron from the excited EY can transfer to the radicals or defect carbons to form RGOx− ions, which would be trapped by the deposited Pt to reduce water into H2.
![[2190-4286-5-92-i12]](/bjnano/content/inline/2190-4286-5-92-i12.svg?max-width=590&scale=1.18182)
The possible mechanism for the photocatalytic H2 evolution in a EY-RGOx/Pt system is described by Scheme 2.
![[2190-4286-5-92-i2]](/bjnano/content/inline/2190-4286-5-92-i2.png?scale=2.0&max-width=1024&background=FFFFFF)
Scheme 2: Proposed mechanism for the photocatalytic hydrogen evolution of a EY-RGOx/Pt system under visible light irradiation.
Scheme 2: Proposed mechanism for the photocatalytic hydrogen evolution of a EY-RGOx/Pt system under visible l...
Conclusion
In summary, RGOx was prepared by a simple photoreaction through controlling irradiation time. After the irradiation, the epoxy, carbonyl and hydroxy groups of GO are gradually removed, sp2 π-conjugated domains increase, and the formed RGO sheets have holes. The conductivity of RGOx and the adsorption amount of EY on the surface of RGOx increase with the irradiation time. The two factors lead to the enhancement of the photocatalytic hydrogen evolution over EY-RGO/Pt with increasing irradiation time. The maximal apparent quantum yield of EY-RGO24/Pt for hydrogen evolution is up to 12.9% under visible light irradiation (λ ≥ 420 nm), and 23.4% under monochromatic light irradiation at 520 nm.
Experimental
Preparation of GO
All the reagents were of analytical grade except EY (bioreagent) and were used without further purification. Graphite oxide was synthesized from natural flake graphite powder (Sinopharm Chemical Reagent Co. Ltd) by the modified Hummers method [53,54]. In a typical method, natural graphite (2 g), NaNO3 (1 g), and H2SO4 (46 mL) were mixed in an ice bath, then KMnO4 (6 g) was slowly added to this mixture, and was stirred continuously for 30 min. Then the resulting mixture was heated to a temperature of 35 °C and was stirred for 2 h. 90 mL of distilled water was added slowly to the mixture for 20 min. Then the mixture was rapidly heated to 98 °C and kept stirring for 15 min. 144 mL of distilled water and 20 mL of H2O2 were added to the mixture. After the reaction, the obtained yellow-brown dispersion of graphite oxide was washed with 5% HCl and water until pH 5 and dried in an oven at 60 °C. 0.5 g of graphite oxide powder was added into 1 L of distilled water, and the dispersion was treated with ultrasound (KQ-800KDB, KunShan Ultrasonic Instrument Co. Ltd) for 2 h until the solution became clear to obtain a graphene oxide (GO) solution.
Photoreaction of GO
100 mL of GO solution (0.5 mg mL−1) in a sealed Pyrex flask with a flat window was irradiated with a Xenon lamp (XQ350, ShangHai LanSheng Electronics Co. Ltd.). The headspace of the flask is air. The irradiation time was 4, 12, 24 and 36 h, respectively. The obtained reduced graphene oxide solution is denoted as RGOx, where x represents the reaction time in hours. In order to characterize the performance of RGOx, its powder (denoted as RGOx-p) was obtained by centrifuging at 12000 rpm for 30 min and drying at 120 °C.
Characterization methods
An X-ray photoelectron spectrometer (XPS) was used to analyze GO and RGOx on an ESCALAB250xi equipped with a Mg Kα X-ray source. The C1s peak set at 284.8 eV was used as an internal reference for the absolute binding energy. Attenuated total reflection infrared (ATR-IR) spectra were recorded on a FTIR Nicolet 5700 spectrometer equipped with a ZnSe crystal horizontal ATR unit. UV–vis absorption spectra were measured on a Hitachi U-3310 spectrophotometer with distilled water for reference. The fluorescence spectra were measured on a Hitachi F-7000 fluorescence spectrophotometer. The transmission electron microscopy (TEM) and high-resolution TEM (HRTEM) images were taken on a JEOL JEM-2010 (TEM) equipped with an energy dispersive spectrometer (EDS).
Electrochemical impedance spectroscopy (EIS) was measured on an IVIUMSTAT electrochemical workstation (Netherlands). The electrochemical experiments were performed in a 3-compartment cell with a glassy carbon electrode (diameter 2 mm) as the working electrode, a platinum wire as the counter electrode, and an Ag/AgCl electrode as the reference electrode. The electrolyte was a solution of 0.1 M phosphate buffer solution (PBS, pH 7), 0.1 M KCl, 10 mM K3Fe(CN)6 and 10 mM K4Fe(CN)6.
Adsorption amounts of EY on GO and RGOx were measured as follows: 6 mL of GO or RGOx solution (0.5 mg mL−1) and 0.5 mL of 1 mM EY were added into trimethylamine (TMA) solution (93.5 mL, 7.7 × 10⁻² mol L−1). The mixture was stirred for 5 h at room temperature in the dark, and then centrifuged at 12000 rpm for 45 min to remove RGOx or GO with EY. The EY concentration of the supernatant was measured on the spectrophotometer. The adsorption amount of EY onto RGOx was calculated based on the concentration difference (ΔC) before and after the mixing.
Transient absorption decay measurements for 3EY* were performed on a LP-920 laser flash photolysis spectrometer (Edinburgh). The excitation pulses were obtained from the unfocused second harmonic (532 nm) output of a Nd:YAG laser (Brilliant b), the probe light was provided by a Xenon short arc lamp (450 W). The measured aqueous solution was prepared as follows: 6 mL of GO or RGOx solution (0.5 mg mL−1), 0.2 mL of 10 mM EY and distilled water were added to keep the volume 100 mL, and then the mixtures were stirred for 30 min at room temperature. The dispersion was transferred to a cuvette with a cover, and then aerated for 20 min with nitrogen gas before measurements.
Photocatalytic H2 evolution
Photocatalytic H2 evolution activity was evaluated in a similar manner as described in [18]. The photocatalytic reaction was carried out in a 190 mL Pyrex cell with a side flat window at room temperature (an efficient irradiation area of ca. 16.9 cm2). A high pressure Hg lamp (400 W) was used as the light source, equipped with a cutoff filter (λ ≥ 420 nm) to remove radiation below 420 nm. The IR fraction of the beam was removed by means of a cool water filter to ensure an illumination with visible light only. In a typical photocatalytic experiment, 6 mL of GO or RGOx solution (0.5 mg mL−1), 1.45 mL of 10 mM EY solution, and 0.24 mL of 1.93 mM H2PtCl6 aqueous solution were added to 92.3 mL of TMA solution. Before irradiation, the suspension of the catalyst was bubbled with N2 for 30 min to completely remove oxygen. Sampling was operated intermittently through the septum during experiments. The amount of photocatalytic hydrogen evolution for 2 h of irradiation was determined on a gas chromatograph (TCD, 13X molecular sieve column, N2 as gas carrier).
The average photon flux of the incident light determined on an FGH-1 Ray virtual radiation actinometer (light spectrum: 400–700 nm) was 363 μmol m−2 s−1. The apparent quantum yield (AQY) was calculated according to the following equation.
![[Graphic 1]](/bjnano/content/inline/2190-4286-5-92-i13.svg?max-width=637&scale=1.18182)
The quantum yields under monochromatic light irradiation were also measured by using various monochromatic LED lamps (UVEC-4, Shenzhen LAMPLIC Science Co.Ltd, China) as light sources. The apparent quantum yields were based on the amount of produced hydrogen for 2 h irradiation by using various LED lamps. All other reaction conditions except the light resources were identical to the conditions of the photocatalytic reaction.
References
-
Zhang, W.; Wang, Y. B.; Wang, Z.; Zhong, Z. Y.; Xu, R. Chem. Commun. 2010, 46, 7631–7633. doi:10.1039/c0cc01562h
Return to citation in text: [1] -
Wei, L.; Chen, Y. J.; Zhao, J. L.; Li, Z. H. Beilstein J. Nanotechnol. 2013, 4, 949–955. doi:10.3762/bjnano.4.107
Return to citation in text: [1] -
Yao, W. F.; Huang, C. P.; Muradov, N.; T-Raissi, A. Int. J. Hydrogen Energy 2011, 36, 4710–4715. doi:10.1016/j.ijhydene.2010.12.124
Return to citation in text: [1] -
Kozlova, E. A.; Vorontsov, A. V. Int. J. Hydrogen Energy 2010, 35, 7337–7343. doi:10.1016/j.ijhydene.2010.04.122
Return to citation in text: [1] -
Pan, X.; Zhao, Y.; Liu, S.; Korzeniewski, C. L.; Wang, S.; Fan, Z. Y. ACS Appl. Mater. Interfaces 2012, 4, 3944–3950. doi:10.1021/am300772t
Return to citation in text: [1] -
Liang, Y. Y.; Wang, H. L.; Sanchez Casalongue, H.; Chen, Z.; Dai, H. J. Nano Res. 2010, 3, 701–705. doi:10.1007/s12274-010-0033-5
Return to citation in text: [1] -
Bai, X. J.; Wang, L.; Zong, R. L.; Lv, Y.; Sun, Y.; Zhu, Y. F. Langmuir 2013, 29, 3097–3105. doi:10.1021/la4001768
Return to citation in text: [1] -
Kim, H.-i.; Moon, G.-h.; Monllor-Satoca, D.; Park, Y.; Choi, W. Y. J. Phys. Chem. C 2012, 116, 1535–1543. doi:10.1021/jp209035e
Return to citation in text: [1] [2] -
Wan, X.; Long, G.; Huang, L.; Chen, Y. Adv. Mater. 2011, 23, 5342–5358. doi:10.1002/adma.201102735
Return to citation in text: [1] -
Xiang, Q. J.; Yu, J. G.; Jaroniec, M. Chem. Soc. Rev. 2012, 41, 782–796. doi:10.1039/c1cs15172j
Return to citation in text: [1] -
Yoo, E. J.; Okata, T.; Akita, T.; Kohyama, M.; Nakamura, J.; Honma, I. Nano Lett. 2009, 9, 2255–2259. doi:10.1021/nl900397t
Return to citation in text: [1] -
Yeh, T.-F.; Syu, J.-M.; Cheng, C.; Chang, T.-H.; Teng, H. S. Adv. Funct. Mater. 2010, 20, 2255–2262. doi:10.1002/adfm.201000274
Return to citation in text: [1] [2] [3] -
Li, Y. X.; Guo, M. M.; Peng, S. Q.; Lu, G. X.; Li, S. B. Int. J. Hydrogen Energy 2009, 34, 5629–5636. doi:10.1016/j.ijhydene.2009.05.100
Return to citation in text: [1] [2] -
Li, Q. Y.; Lu, G. X. J. Mol. Catal. A: Chem. 2006, 266, 75–79. doi:10.1016/j.molcata.2006.10.047
Return to citation in text: [1] [2] -
Xu, J. Y.; Li, Y. X.; Peng, S. Q.; Lu, G. X.; Li, S. B. Phys. Chem. Chem. Phys. 2013, 15, 7657–7665. doi:10.1039/c3cp44687e
Return to citation in text: [1] [2] -
Liu, X.; Li, Y. X.; Peng, S. Q.; Lu, G. X.; Li, S. B. Photochem. Photobiol. Sci. 2013, 12, 1903–1910. doi:10.1039/c3pp50167a
Return to citation in text: [1] [2] -
Li, Q. Y.; Jin, Z. L.; Peng, Z. G.; Li, Y. X.; Li, S. B.; Lu, G. X. J. Phys. Chem. C 2007, 111, 8237–8241. doi:10.1021/jp068703b
Return to citation in text: [1] -
Liu, X.; Li, Y. X.; Peng, S. Q.; Lu, G. X.; Li, S. B. Int. J. Hydrogen Energy 2012, 37, 12150–12157. doi:10.1016/j.ijhydene.2012.06.028
Return to citation in text: [1] [2] [3] -
Mou, Z. G.; Dong, Y. P.; Li, S. J.; Du, Y.; Wang, X.; Yang, P.; Wang, S. Int. J. Hydrogen Energy 2011, 36, 8885–8893. doi:10.1016/j.ijhydene.2011.05.003
Return to citation in text: [1] [2] [3] [4] -
Min, S. X.; Lu, G. X. J. Phys. Chem. C 2011, 115, 13938–13945. doi:10.1021/jp203750z
Return to citation in text: [1] [2] [3] [4] [5] [6] [7] -
Min, S. X.; Lu, G. X. Int. J. Hydrogen Energy 2013, 38, 2106–2116. doi:10.1016/j.ijhydene.2012.11.124
Return to citation in text: [1] [2] [3] -
Geim, A. K. Science 2009, 324, 1530–1534. doi:10.1126/science.1158877
Return to citation in text: [1] -
Zhang, Y.; Tan, Y. W.; Stormer, H. L.; Kim, P. Nature 2005, 438, 201–204. doi:10.1038/nature04235
Return to citation in text: [1] -
Stoller, M. D.; Park, S.; Zhu, Y.; An, J.; Ruoff, R. S. Nano Lett. 2008, 8, 3498–3502. doi:10.1021/nl802558y
Return to citation in text: [1] -
Allen, M. J.; Tung, V. C.; Kaner, R. B. Chem. Rev. 2010, 110, 132–145. doi:10.1021/cr900070d
Return to citation in text: [1] -
Balandin, A. A.; Ghosh, S.; Bao, W.; Calizo, I.; Teweldebrhan, D.; Miao, F.; Lau, C. N. Nano Lett. 2008, 8, 902–907. doi:10.1021/nl0731872
Return to citation in text: [1] -
Xu, L. Q.; Wang, L.; Zhang, B.; Lim, C. H.; Chen, Y.; Neoh, K.-G.; Kang, E. T.; Fu, G. D. Polymer 2011, 52, 2376–2383. doi:10.1016/j.polymer.2011.03.054
Return to citation in text: [1] -
Ganguly, A.; Sharma, S.; Papakonstantinou, P.; Hamilton, J. J. Phys. Chem. C 2011, 115, 17009–17019. doi:10.1021/jp203741y
Return to citation in text: [1] -
Williams, G.; Seger, B.; Kamat, P. V. ACS Nano 2008, 7, 1487–1491. doi:10.1021/nn800251f
Return to citation in text: [1] -
Li, H. L.; Pang, S. P.; Feng, X. L.; Bubeck, C. Chem. Commun. 2010, 46, 6243–6245. doi:10.1039/c0cc01098g
Return to citation in text: [1] [2] -
Zhang, H. H.; Liu, Q.; Feng, K.; Chen, B.; Tung, C.-H.; Wu, L. Z. Langmuir 2012, 28, 8224–8229. doi:10.1021/la301429g
Return to citation in text: [1] -
Liu, R. J.; Li, S. W.; Yu, X. L.; Zhang, G. J.; Zhi, L. J. J. Mater. Chem. 2012, 22, 3319–3322. doi:10.1039/c2jm15875b
Return to citation in text: [1] -
Xiang, Q. J.; Yu, J. G.; Jaroniec, M. J. Phys. Chem. C 2011, 115, 7355–7363. doi:10.1021/jp200953k
Return to citation in text: [1] -
Tung, V. C.; Allen, M. J.; Yang, Y.; Kaner, R. B. Nat. Nanotechnol. 2009, 4, 25–29. doi:10.1038/nnano.2008.329
Return to citation in text: [1] -
Li, D.; Müller, M. B.; Gilje, S.; Kaner, R. B.; Wallace, G. G. Nat. Nanotechnol. 2008, 3, 101–105. doi:10.1038/nnano.2007.451
Return to citation in text: [1] [2] [3] -
Skoog, D. A.; Haller, F. J.; Niemann, T. A. Principles of Instrumental Analysis; Hartcourt Brace & Company: Philadelphia, 1998.
Return to citation in text: [1] -
Karousis, N.; Economopous, S. P.; Sarantopoulou, E.; Tagmatarchis, N. Carbon 2010, 48, 854–860. doi:10.1016/j.carbon.2009.10.039
Return to citation in text: [1] -
Hou, X. L.; Li, J. L.; Drew, S. C.; Tang, B.; Sun, L.; Wang, X. G. J. Phys. Chem. C 2013, 117, 6788–6793. doi:10.1021/jp311727t
Return to citation in text: [1] [2] [3] -
Li, J. F.; Lin, H.; Li, J. B. Carbon 2011, 49, 3024–3030. doi:10.1016/j.carbon.2011.03.022
Return to citation in text: [1] -
Matsumoto, Y.; Koinuma, M.; Kim, S. Y.; Watanabe, Y.; Taniguchi, T.; Hatakeyama, K.; Tateishi, H.; Ida, S. ACS Appl. Mater. Interfaces 2010, 12, 3461–3466. doi:10.1021/am100900q
Return to citation in text: [1] [2] -
Stankovich, S.; Dikin, D. A.; Piner, R. D.; Kohlhaas, K. A.; Kleinhammes, A.; Jia, Y. Y.; Wu, Y.; Nguyen, S. B.; Ruoff, R. S. Carbon 2007, 45, 1558–1565. doi:10.1016/j.carbon.2007.02.034
Return to citation in text: [1] -
Akhavan, O.; Abdolahad, M.; Esfandiar, A.; Mohatashamifar, M. J. Phys. Chem. C 2010, 114, 12955–12959. doi:10.1021/jp103472c
Return to citation in text: [1] -
Casero, E.; Parra-Alfambra, A. M.; Petit-Domínguez, M. D.; Pariente, F.; Lorenzo, E.; Alonso, C. Electrochem. Commun. 2012, 20, 63–66. doi:10.1016/j.elecom.2012.04.002
Return to citation in text: [1] -
Guo, S.; Dong, S. Chem. Soc. Rev. 2011, 40, 2644–2672. doi:10.1039/c0cs00079e
Return to citation in text: [1] -
Shimidzu, T.; Iyoda, T.; Koide, Y. J. Am. Chem. Soc. 1985, 107, 35–41. doi:10.1021/ja00287a007
Return to citation in text: [1] -
Moser, J.; Graetzel, M. J. Am. Chem. Soc. 1984, 106, 6557–6564. doi:10.1021/ja00334a017
Return to citation in text: [1] -
Fisher, G. J.; Lewis, C.; Madill, D. Photochem. Photobiol. 1976, 24, 223–228. doi:10.1111/j.1751-1097.1976.tb06815.x
Return to citation in text: [1] -
Lee, J.; Choi, W. Y. Environ. Sci. Technol. 2004, 38, 4026–4033. doi:10.1021/es034954b
Return to citation in text: [1] -
Lazarides, T.; McCormick, T.; Du, P. W.; Luo, G. G.; Lindley, B.; Eisenberg, R. J. Am. Chem. Soc. 2009, 131, 9192–9194. doi:10.1021/ja903044n
Return to citation in text: [1] -
Fu, N.; Lu, G. X. Chem. Commun. 2009, 3591–3593. doi:10.1039/b906073a
Return to citation in text: [1] -
Matsumoto, Y.; Koinuma, M.; Ida, S.; Hayami, S.; Taniguchi, T.; Hatakeyama, K.; Tateishi, H.; Watanabe, Y.; Amano, S. J. Phys. Chem. C 2011, 115, 19280–19286. doi:10.1021/jp206348s
Return to citation in text: [1] [2] [3] -
Radovic, L. R.; Silva-Villalobos, A. F.; Silva-Tapia, A. B.; Vallejos-Burgos, F. Carbon 2011, 49, 3471–3487. doi:10.1016/j.carbon.2011.04.046
Return to citation in text: [1] -
Hummers, W. S., Jr..; Offeman, R. E. J. Am. Chem. Soc. 1958, 80, 1339. doi:10.1021/ja01539a017
Return to citation in text: [1] -
Kovtyukhova, N.; Ollivier, P.; Martin, B. R.; Mallouk, T. E.; Chizhik, S. A.; Buzaneva, E. V.; Gorchinskiy, A. D. Chem. Mater. 1999, 11, 771–778. doi:10.1021/cm981085u
Return to citation in text: [1]
| 40. | Matsumoto, Y.; Koinuma, M.; Kim, S. Y.; Watanabe, Y.; Taniguchi, T.; Hatakeyama, K.; Tateishi, H.; Ida, S. ACS Appl. Mater. Interfaces 2010, 12, 3461–3466. doi:10.1021/am100900q |
| 30. | Li, H. L.; Pang, S. P.; Feng, X. L.; Bubeck, C. Chem. Commun. 2010, 46, 6243–6245. doi:10.1039/c0cc01098g |
| 41. | Stankovich, S.; Dikin, D. A.; Piner, R. D.; Kohlhaas, K. A.; Kleinhammes, A.; Jia, Y. Y.; Wu, Y.; Nguyen, S. B.; Ruoff, R. S. Carbon 2007, 45, 1558–1565. doi:10.1016/j.carbon.2007.02.034 |
| 45. | Shimidzu, T.; Iyoda, T.; Koide, Y. J. Am. Chem. Soc. 1985, 107, 35–41. doi:10.1021/ja00287a007 |
| 46. | Moser, J.; Graetzel, M. J. Am. Chem. Soc. 1984, 106, 6557–6564. doi:10.1021/ja00334a017 |
| 47. | Fisher, G. J.; Lewis, C.; Madill, D. Photochem. Photobiol. 1976, 24, 223–228. doi:10.1111/j.1751-1097.1976.tb06815.x |
| 19. | Mou, Z. G.; Dong, Y. P.; Li, S. J.; Du, Y.; Wang, X.; Yang, P.; Wang, S. Int. J. Hydrogen Energy 2011, 36, 8885–8893. doi:10.1016/j.ijhydene.2011.05.003 |
| 20. | Min, S. X.; Lu, G. X. J. Phys. Chem. C 2011, 115, 13938–13945. doi:10.1021/jp203750z |
| 21. | Min, S. X.; Lu, G. X. Int. J. Hydrogen Energy 2013, 38, 2106–2116. doi:10.1016/j.ijhydene.2012.11.124 |
| 20. | Min, S. X.; Lu, G. X. J. Phys. Chem. C 2011, 115, 13938–13945. doi:10.1021/jp203750z |
| 43. | Casero, E.; Parra-Alfambra, A. M.; Petit-Domínguez, M. D.; Pariente, F.; Lorenzo, E.; Alonso, C. Electrochem. Commun. 2012, 20, 63–66. doi:10.1016/j.elecom.2012.04.002 |
| 44. | Guo, S.; Dong, S. Chem. Soc. Rev. 2011, 40, 2644–2672. doi:10.1039/c0cs00079e |
| 40. | Matsumoto, Y.; Koinuma, M.; Kim, S. Y.; Watanabe, Y.; Taniguchi, T.; Hatakeyama, K.; Tateishi, H.; Ida, S. ACS Appl. Mater. Interfaces 2010, 12, 3461–3466. doi:10.1021/am100900q |
| 42. | Akhavan, O.; Abdolahad, M.; Esfandiar, A.; Mohatashamifar, M. J. Phys. Chem. C 2010, 114, 12955–12959. doi:10.1021/jp103472c |
| 16. | Liu, X.; Li, Y. X.; Peng, S. Q.; Lu, G. X.; Li, S. B. Photochem. Photobiol. Sci. 2013, 12, 1903–1910. doi:10.1039/c3pp50167a |
| 48. | Lee, J.; Choi, W. Y. Environ. Sci. Technol. 2004, 38, 4026–4033. doi:10.1021/es034954b |
| 49. | Lazarides, T.; McCormick, T.; Du, P. W.; Luo, G. G.; Lindley, B.; Eisenberg, R. J. Am. Chem. Soc. 2009, 131, 9192–9194. doi:10.1021/ja903044n |
| 38. | Hou, X. L.; Li, J. L.; Drew, S. C.; Tang, B.; Sun, L.; Wang, X. G. J. Phys. Chem. C 2013, 117, 6788–6793. doi:10.1021/jp311727t |
| 38. | Hou, X. L.; Li, J. L.; Drew, S. C.; Tang, B.; Sun, L.; Wang, X. G. J. Phys. Chem. C 2013, 117, 6788–6793. doi:10.1021/jp311727t |
| 52. | Radovic, L. R.; Silva-Villalobos, A. F.; Silva-Tapia, A. B.; Vallejos-Burgos, F. Carbon 2011, 49, 3471–3487. doi:10.1016/j.carbon.2011.04.046 |
| 51. | Matsumoto, Y.; Koinuma, M.; Ida, S.; Hayami, S.; Taniguchi, T.; Hatakeyama, K.; Tateishi, H.; Watanabe, Y.; Amano, S. J. Phys. Chem. C 2011, 115, 19280–19286. doi:10.1021/jp206348s |
| 51. | Matsumoto, Y.; Koinuma, M.; Ida, S.; Hayami, S.; Taniguchi, T.; Hatakeyama, K.; Tateishi, H.; Watanabe, Y.; Amano, S. J. Phys. Chem. C 2011, 115, 19280–19286. doi:10.1021/jp206348s |
| 35. | Li, D.; Müller, M. B.; Gilje, S.; Kaner, R. B.; Wallace, G. G. Nat. Nanotechnol. 2008, 3, 101–105. doi:10.1038/nnano.2007.451 |
| 51. | Matsumoto, Y.; Koinuma, M.; Ida, S.; Hayami, S.; Taniguchi, T.; Hatakeyama, K.; Tateishi, H.; Watanabe, Y.; Amano, S. J. Phys. Chem. C 2011, 115, 19280–19286. doi:10.1021/jp206348s |
| 20. | Min, S. X.; Lu, G. X. J. Phys. Chem. C 2011, 115, 13938–13945. doi:10.1021/jp203750z |
| 50. | Fu, N.; Lu, G. X. Chem. Commun. 2009, 3591–3593. doi:10.1039/b906073a |
| 20. | Min, S. X.; Lu, G. X. J. Phys. Chem. C 2011, 115, 13938–13945. doi:10.1021/jp203750z |
| 18. | Liu, X.; Li, Y. X.; Peng, S. Q.; Lu, G. X.; Li, S. B. Int. J. Hydrogen Energy 2012, 37, 12150–12157. doi:10.1016/j.ijhydene.2012.06.028 |
| 53. | Hummers, W. S., Jr..; Offeman, R. E. J. Am. Chem. Soc. 1958, 80, 1339. doi:10.1021/ja01539a017 |
| 54. | Kovtyukhova, N.; Ollivier, P.; Martin, B. R.; Mallouk, T. E.; Chizhik, S. A.; Buzaneva, E. V.; Gorchinskiy, A. D. Chem. Mater. 1999, 11, 771–778. doi:10.1021/cm981085u |
| 1. | Zhang, W.; Wang, Y. B.; Wang, Z.; Zhong, Z. Y.; Xu, R. Chem. Commun. 2010, 46, 7631–7633. doi:10.1039/c0cc01562h |
| 2. | Wei, L.; Chen, Y. J.; Zhao, J. L.; Li, Z. H. Beilstein J. Nanotechnol. 2013, 4, 949–955. doi:10.3762/bjnano.4.107 |
| 3. | Yao, W. F.; Huang, C. P.; Muradov, N.; T-Raissi, A. Int. J. Hydrogen Energy 2011, 36, 4710–4715. doi:10.1016/j.ijhydene.2010.12.124 |
| 4. | Kozlova, E. A.; Vorontsov, A. V. Int. J. Hydrogen Energy 2010, 35, 7337–7343. doi:10.1016/j.ijhydene.2010.04.122 |
| 11. | Yoo, E. J.; Okata, T.; Akita, T.; Kohyama, M.; Nakamura, J.; Honma, I. Nano Lett. 2009, 9, 2255–2259. doi:10.1021/nl900397t |
| 12. | Yeh, T.-F.; Syu, J.-M.; Cheng, C.; Chang, T.-H.; Teng, H. S. Adv. Funct. Mater. 2010, 20, 2255–2262. doi:10.1002/adfm.201000274 |
| 21. | Min, S. X.; Lu, G. X. Int. J. Hydrogen Energy 2013, 38, 2106–2116. doi:10.1016/j.ijhydene.2012.11.124 |
| 22. | Geim, A. K. Science 2009, 324, 1530–1534. doi:10.1126/science.1158877 |
| 9. | Wan, X.; Long, G.; Huang, L.; Chen, Y. Adv. Mater. 2011, 23, 5342–5358. doi:10.1002/adma.201102735 |
| 10. | Xiang, Q. J.; Yu, J. G.; Jaroniec, M. Chem. Soc. Rev. 2012, 41, 782–796. doi:10.1039/c1cs15172j |
| 23. | Zhang, Y.; Tan, Y. W.; Stormer, H. L.; Kim, P. Nature 2005, 438, 201–204. doi:10.1038/nature04235 |
| 24. | Stoller, M. D.; Park, S.; Zhu, Y.; An, J.; Ruoff, R. S. Nano Lett. 2008, 8, 3498–3502. doi:10.1021/nl802558y |
| 25. | Allen, M. J.; Tung, V. C.; Kaner, R. B. Chem. Rev. 2010, 110, 132–145. doi:10.1021/cr900070d |
| 26. | Balandin, A. A.; Ghosh, S.; Bao, W.; Calizo, I.; Teweldebrhan, D.; Miao, F.; Lau, C. N. Nano Lett. 2008, 8, 902–907. doi:10.1021/nl0731872 |
| 8. | Kim, H.-i.; Moon, G.-h.; Monllor-Satoca, D.; Park, Y.; Choi, W. Y. J. Phys. Chem. C 2012, 116, 1535–1543. doi:10.1021/jp209035e |
| 19. | Mou, Z. G.; Dong, Y. P.; Li, S. J.; Du, Y.; Wang, X.; Yang, P.; Wang, S. Int. J. Hydrogen Energy 2011, 36, 8885–8893. doi:10.1016/j.ijhydene.2011.05.003 |
| 5. | Pan, X.; Zhao, Y.; Liu, S.; Korzeniewski, C. L.; Wang, S.; Fan, Z. Y. ACS Appl. Mater. Interfaces 2012, 4, 3944–3950. doi:10.1021/am300772t |
| 6. | Liang, Y. Y.; Wang, H. L.; Sanchez Casalongue, H.; Chen, Z.; Dai, H. J. Nano Res. 2010, 3, 701–705. doi:10.1007/s12274-010-0033-5 |
| 7. | Bai, X. J.; Wang, L.; Zong, R. L.; Lv, Y.; Sun, Y.; Zhu, Y. F. Langmuir 2013, 29, 3097–3105. doi:10.1021/la4001768 |
| 8. | Kim, H.-i.; Moon, G.-h.; Monllor-Satoca, D.; Park, Y.; Choi, W. Y. J. Phys. Chem. C 2012, 116, 1535–1543. doi:10.1021/jp209035e |
| 20. | Min, S. X.; Lu, G. X. J. Phys. Chem. C 2011, 115, 13938–13945. doi:10.1021/jp203750z |
| 14. | Li, Q. Y.; Lu, G. X. J. Mol. Catal. A: Chem. 2006, 266, 75–79. doi:10.1016/j.molcata.2006.10.047 |
| 18. | Liu, X.; Li, Y. X.; Peng, S. Q.; Lu, G. X.; Li, S. B. Int. J. Hydrogen Energy 2012, 37, 12150–12157. doi:10.1016/j.ijhydene.2012.06.028 |
| 13. | Li, Y. X.; Guo, M. M.; Peng, S. Q.; Lu, G. X.; Li, S. B. Int. J. Hydrogen Energy 2009, 34, 5629–5636. doi:10.1016/j.ijhydene.2009.05.100 |
| 19. | Mou, Z. G.; Dong, Y. P.; Li, S. J.; Du, Y.; Wang, X.; Yang, P.; Wang, S. Int. J. Hydrogen Energy 2011, 36, 8885–8893. doi:10.1016/j.ijhydene.2011.05.003 |
| 20. | Min, S. X.; Lu, G. X. J. Phys. Chem. C 2011, 115, 13938–13945. doi:10.1021/jp203750z |
| 21. | Min, S. X.; Lu, G. X. Int. J. Hydrogen Energy 2013, 38, 2106–2116. doi:10.1016/j.ijhydene.2012.11.124 |
| 13. | Li, Y. X.; Guo, M. M.; Peng, S. Q.; Lu, G. X.; Li, S. B. Int. J. Hydrogen Energy 2009, 34, 5629–5636. doi:10.1016/j.ijhydene.2009.05.100 |
| 14. | Li, Q. Y.; Lu, G. X. J. Mol. Catal. A: Chem. 2006, 266, 75–79. doi:10.1016/j.molcata.2006.10.047 |
| 15. | Xu, J. Y.; Li, Y. X.; Peng, S. Q.; Lu, G. X.; Li, S. B. Phys. Chem. Chem. Phys. 2013, 15, 7657–7665. doi:10.1039/c3cp44687e |
| 16. | Liu, X.; Li, Y. X.; Peng, S. Q.; Lu, G. X.; Li, S. B. Photochem. Photobiol. Sci. 2013, 12, 1903–1910. doi:10.1039/c3pp50167a |
| 17. | Li, Q. Y.; Jin, Z. L.; Peng, Z. G.; Li, Y. X.; Li, S. B.; Lu, G. X. J. Phys. Chem. C 2007, 111, 8237–8241. doi:10.1021/jp068703b |
| 18. | Liu, X.; Li, Y. X.; Peng, S. Q.; Lu, G. X.; Li, S. B. Int. J. Hydrogen Energy 2012, 37, 12150–12157. doi:10.1016/j.ijhydene.2012.06.028 |
| 12. | Yeh, T.-F.; Syu, J.-M.; Cheng, C.; Chang, T.-H.; Teng, H. S. Adv. Funct. Mater. 2010, 20, 2255–2262. doi:10.1002/adfm.201000274 |
| 15. | Xu, J. Y.; Li, Y. X.; Peng, S. Q.; Lu, G. X.; Li, S. B. Phys. Chem. Chem. Phys. 2013, 15, 7657–7665. doi:10.1039/c3cp44687e |
| 33. | Xiang, Q. J.; Yu, J. G.; Jaroniec, M. J. Phys. Chem. C 2011, 115, 7355–7363. doi:10.1021/jp200953k |
| 34. | Tung, V. C.; Allen, M. J.; Yang, Y.; Kaner, R. B. Nat. Nanotechnol. 2009, 4, 25–29. doi:10.1038/nnano.2008.329 |
| 27. | Xu, L. Q.; Wang, L.; Zhang, B.; Lim, C. H.; Chen, Y.; Neoh, K.-G.; Kang, E. T.; Fu, G. D. Polymer 2011, 52, 2376–2383. doi:10.1016/j.polymer.2011.03.054 |
| 28. | Ganguly, A.; Sharma, S.; Papakonstantinou, P.; Hamilton, J. J. Phys. Chem. C 2011, 115, 17009–17019. doi:10.1021/jp203741y |
| 29. | Williams, G.; Seger, B.; Kamat, P. V. ACS Nano 2008, 7, 1487–1491. doi:10.1021/nn800251f |
| 30. | Li, H. L.; Pang, S. P.; Feng, X. L.; Bubeck, C. Chem. Commun. 2010, 46, 6243–6245. doi:10.1039/c0cc01098g |
| 31. | Zhang, H. H.; Liu, Q.; Feng, K.; Chen, B.; Tung, C.-H.; Wu, L. Z. Langmuir 2012, 28, 8224–8229. doi:10.1021/la301429g |
| 32. | Liu, R. J.; Li, S. W.; Yu, X. L.; Zhang, G. J.; Zhi, L. J. J. Mater. Chem. 2012, 22, 3319–3322. doi:10.1039/c2jm15875b |
| 39. | Li, J. F.; Lin, H.; Li, J. B. Carbon 2011, 49, 3024–3030. doi:10.1016/j.carbon.2011.03.022 |
| 12. | Yeh, T.-F.; Syu, J.-M.; Cheng, C.; Chang, T.-H.; Teng, H. S. Adv. Funct. Mater. 2010, 20, 2255–2262. doi:10.1002/adfm.201000274 |
| 38. | Hou, X. L.; Li, J. L.; Drew, S. C.; Tang, B.; Sun, L.; Wang, X. G. J. Phys. Chem. C 2013, 117, 6788–6793. doi:10.1021/jp311727t |
| 35. | Li, D.; Müller, M. B.; Gilje, S.; Kaner, R. B.; Wallace, G. G. Nat. Nanotechnol. 2008, 3, 101–105. doi:10.1038/nnano.2007.451 |
| 36. | Skoog, D. A.; Haller, F. J.; Niemann, T. A. Principles of Instrumental Analysis; Hartcourt Brace & Company: Philadelphia, 1998. |
| 37. | Karousis, N.; Economopous, S. P.; Sarantopoulou, E.; Tagmatarchis, N. Carbon 2010, 48, 854–860. doi:10.1016/j.carbon.2009.10.039 |
| 19. | Mou, Z. G.; Dong, Y. P.; Li, S. J.; Du, Y.; Wang, X.; Yang, P.; Wang, S. Int. J. Hydrogen Energy 2011, 36, 8885–8893. doi:10.1016/j.ijhydene.2011.05.003 |
| 20. | Min, S. X.; Lu, G. X. J. Phys. Chem. C 2011, 115, 13938–13945. doi:10.1021/jp203750z |
| 35. | Li, D.; Müller, M. B.; Gilje, S.; Kaner, R. B.; Wallace, G. G. Nat. Nanotechnol. 2008, 3, 101–105. doi:10.1038/nnano.2007.451 |
© 2014 Zhang et al; licensee Beilstein-Institut.
This is an Open Access article under the terms of the Creative Commons Attribution License (http://creativecommons.org/licenses/by/2.0), which permits unrestricted use, distribution, and reproduction in any medium, provided the original work is properly cited.
The license is subject to the Beilstein Journal of Nanotechnology terms and conditions: (http://www.beilstein-journals.org/bjnano)