From lithium to sodium: cell chemistry of room temperature sodium–air and sodium–sulfur batteries
1,2,
2,3,
2,
2,
2 and
2,4
Philipp Adelhelm
Institute for Technical Chemistry and Environmental Chemistry, Center for Energy and Environmental Chemistry, Friedrich-Schiller-University Jena, Lessingstraße 12, 07743 Jena, Germany
Institute of Physical Chemistry, Justus-Liebig-University Giessen, Heinrich-Buff-Ring 58, 35392 Giessen, Germany
Institute of Physical Chemistry, Justus-Liebig-University Giessen, Heinrich-Buff-Ring 58, 35392 Giessen, Germany
Battery and Electrochemistry Laboratory, Institute of Nanotechnology, Karlsruhe Institute of Technology, Hermann-von-Helmholtz-Platz 1, 76344 Eggenstein-Leopoldshafen, Germany
1Institute for Technical Chemistry and Environmental Chemistry, Center for Energy and Environmental Chemistry, Friedrich-Schiller-University Jena, Lessingstraße 12, 07743 Jena, Germany
4Battery and Electrochemistry Laboratory, Institute of Nanotechnology, Karlsruhe Institute of Technology, Hermann-von-Helmholtz-Platz 1, 76344 Eggenstein-Leopoldshafen, Germany
Guest Editor: M. Fichtner Beilstein J. Nanotechnol.2015,6, 1016–1055.https://doi.org/10.3762/bjnano.6.105 Received 19 Nov 2014,
Accepted 05 Mar 2015,
Published 23 Apr 2015
Research devoted to room temperature lithium–sulfur (Li/S8) and lithium–oxygen (Li/O2) batteries has significantly increased over the past ten years. The race to develop such cell systems is mainly motivated by the very high theoretical energy density and the abundance of sulfur and oxygen. The cell chemistry, however, is complex, and progress toward practical device development remains hampered by some fundamental key issues, which are currently being tackled by numerous approaches. Quite surprisingly, not much is known about the analogous sodium-based battery systems, although the already commercialized, high-temperature Na/S8 and Na/NiCl2 batteries suggest that a rechargeable battery based on sodium is feasible on a large scale. Moreover, the natural abundance of sodium is an attractive benefit for the development of batteries based on low cost components. This review provides a summary of the state-of-the-art knowledge on lithium–sulfur and lithium–oxygen batteries and a direct comparison with the analogous sodium systems. The general properties, major benefits and challenges, recent strategies for performance improvements and general guidelines for further development are summarized and critically discussed. In general, the substitution of lithium for sodium has a strong impact on the overall properties of the cell reaction and differences in ion transport, phase stability, electrode potential, energy density, etc. can be thus expected. Whether these differences will benefit a more reversible cell chemistry is still an open question, but some of the first reports on room temperature Na/S8 and Na/O2 cells already show some exciting differences as compared to the established Li/S8 and Li/O2 systems.
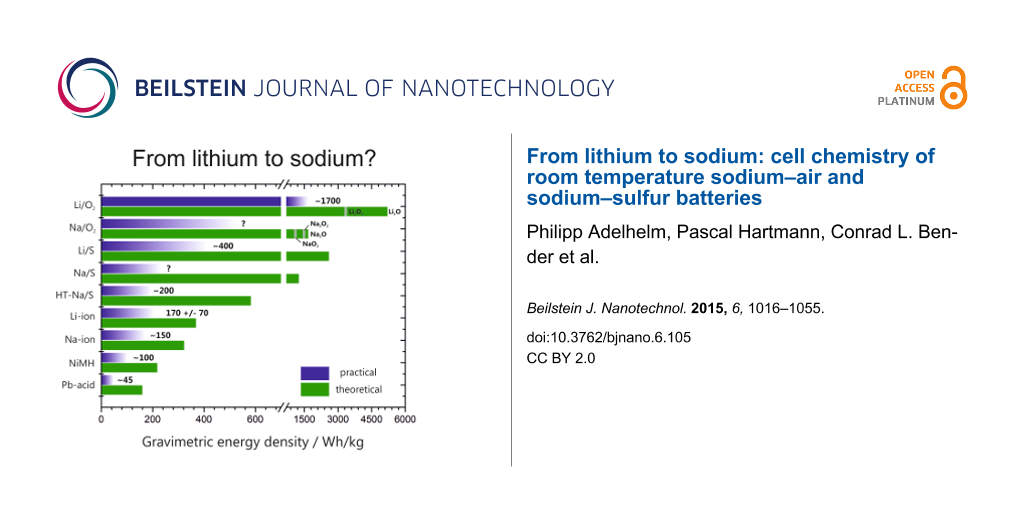
Rechargeable lithium-ion batteries (LIBs) have rapidly become the most important form of energy storage for all mobile applications since their commercialization in the early 1990s. This is mainly due to their unrivaled energy density that easily surpasses other rechargeable battery systems such as metal–hydride or lead–acid. However, the ongoing need to store electricity even more safely, more compactly and more affordably necessitates continuous research and development. The need for inexpensive stationary energy storage has become an additional challenge, which also triggers research on alternative batteries. Major efforts are directed towards continuous improvements of the different Li-ion technologies by more efficient packaging, processing, better electrolytes and optimized electrode materials, for example. Although significant progress has been achieved with respect to the power density over the last years, the increase in energy density (volumetrically and gravimetrically) was relatively small [1]. A comparison of different battery technologies with respect to their energy densities is shown in Figure 1.
Figure 1:
Theoretical and (estimated) practical energy densities of different rechargeable batteries: Pb–acid – lead acid, NiMH – nickel metal hydride, Na-ion – estimate derived from data for Li-ion assuming a slightly lower cell voltage, Li-ion – average over different types, HT-Na/S8 – high temperature sodium–sulfur battery, Li/S8 and Na/S8 – lithium–sulfur and sodium–sulfur battery assuming Li2S and Na2S as discharge products, Li/O2 and Na/O2 – lithium–oxygen battery (theoretical values include the weight of oxygen and depend on the stoichiometry of the assumed discharge product, i.e., oxide, peroxide or superoxide). Note that the values for practical energy densities can largely vary depending on the battery design (size, high power, high energy, single cell or battery) and the state of development. All values for practical energy densities refer to the cell level (except Pb–acid, 12 V). The values for the Li/S8 and Li/O2 batteries were taken from the literature (cited within the main text) and are used to estimate the energy densities for the Na/S8 and Na/O2 cells. Of the above technologies, only the lead acid, NiMH, Li-ion and high temperature Na/S8 technologies have been commercialized to date.
Figure 1:
Theoretical and (estimated) practical energy densities of different rechargeable batteries: Pb–acid...
Ultimately, the energy density of a practical battery is determined by the cell reaction itself, that is, the electrode materials being used. The need for a proper cell design and packaging considerably reduces the practical energy density of a battery compared to the theoretical energy density. The cell reaction of Li-ion batteries is not fixed and different electrode materials and mixtures are used depending on the type of application. Graphite/carbon and to a lesser degree Li4/3Ti5/3O4 (LTO) serve as the negative electrodes. Recently, silicon has been added in small amounts to graphite to increase the capacity. Layered oxides (the classic LiCoO2, LCO) and related materials (LiNi1−x−yMnxCoyO2, NMC; LiNi0.8Co0.15Al0.05O2, NCA; olivines, LiFePO4, LFP; spinels, LiMn2O4, LMO) are applied as positive electrodes. The underlying storage principle of all these electrode materials is a one-electron transfer per formula unit. In this process, the de-/intercalation of one Li-ion is linked to a change in the transition metal oxidation state by one (Co3+/4+, Fe2+/3+, Mn3+/4+, etc.), as illustrated in Figure 2a. However, since the positive electrode materials often suffer from stability issues at too low lithium contents, only a fraction of the theoretical capacity can be achieved in practice (with LFP being an exception). For example, only 0.5 electrons per formula unit can be reversibly exchanged for LCO. The electrode reaction for LCO can therefore be written as
(1)
The amount of charge that can be stored during this process is therefore limited and the capacities of positive insertion-type and intercalation-type electrode materials are around 120–180 mAh/g. Employing graphite as a negative electrode (372 mAh/g), the theoretical energy densities of single cells for current Li-ion technology are limited to around 350–400 Wh/kg and 1200–1400 Wh/L. Roughly about one fourth to one half is achieved in practice due to the additional weight and volume of the current collectors, separator, electrolyte, cell housing, and so forth.
Figure 2:
Operating principles of (a) a lithium-ion battery, (b) a metal–oxygen battery (non-aqueous electrolyte) and (c) a metal–sulfur battery during discharge. (A = Li, Na). A lithium-ion battery is based on intercalation compounds as electrodes. The exact cell reaction depends on the materials used. In this example, the reaction equation is formulated for the classical LIB with graphite as the negative and LiCoO2 as the positive electrode. The same concept can be applied for a sodium-ion battery. Metal–oxygen and metal–sulfur batteries perform best with a lithium or sodium metal as the anode. The positive electrode consists of a porous support, usually carbon. In a metal–oxygen battery, this support enables the reduction of atmospheric oxygen and accommodates the insulating discharge products of Li2O2, Na2O2, NaO2, or ideally, Li2O and Na2O. In metal–sulfur batteries, the support hosts the insulating end members of the cell reaction, which are sulfur (before discharge) and ideally Li2S and Na2S (after discharge). The sketch in Figure 2 illustrates the most frequently studied cell concepts for metal–oxygen and metal–sulfur cells. Other concepts, for example, solid electrolytes or liquid electrodes, are also currently being studied.
Figure 2:
Operating principles of (a) a lithium-ion battery, (b) a metal–oxygen battery (non-aqueous electrol...
Significantly higher energy densities can only be achieved by using electrode reactions such as multielectron transfer and/or lighter elements. A broad range of so-called conversion reactions has been studied which are based on the full reduction of the transition metal [2]. The general electrode reaction can be written as:
(2)
where M is either a transition metal (Cu, Co, Fe, etc.) or Mg, and X is an anion (F, O, S, etc.). The overall success has been limited as conversion reactions typically show large irreversible capacities during the first cycle and a large hysteresis during cycling. This irreversible capacity is mostly caused by the need for complete lattice reconstruction and the corresponding formation of new interfaces.
The most appealing multielectron transfer systems are the lithium–sulfur battery and the lithium–air (or more precisely, the lithium–oxygen battery) in which a non-metal is the redox-active element. Both batteries combine very high theoretical energy densities with the advantage of using abundant and thus resource-uncritical elements. Both systems have been intensively studied over the last years. For example, more than 250 publications appeared in the field of lithium–sulfur batteries in 2014 alone and about 200 publications in 2014 are concerned with lithium–oxygen batteries. The cell concepts are entirely different from conventional Li-ion technology, as depicted in Figure 2. Here, elemental sulfur and atmospheric oxygen are reduced at the positive electrode to form Li2S and Li2O2 during discharge, which is expressed by:
(3)(4)
Moreover, the cells ideally operate with metallic lithium as the negative electrode. No heavy transition metals participate in the cell reaction and theoretical energy densities of 2613 Wh/kg for the Li/S8 and 3458 Wh/kg for the Li/O2 cell can be calculated.
Perhaps the most important conceptual differences between these cell systems and Li-ion batteries are (1) that the redox centers (oxygen and sulfur) are lighter and spatially more concentrated, allowing for higher energy densities and (2) that the redox-active (molecular) species are mobile in liquid electrolytes and new phases form and decompose during cycling. In intercalation compounds, the redox centers (transition metal cations) are immobile as they are pinned to the fixed positions of the crystal lattice and are, therefore, spatially diluted. However, due to the poor conductivity of sulfur, Li2S and Li2O2, the non-metal redox materials also require a suitable conductive support structure. For the Li/S8 and Li/O2 batteries, this means that significant complexity is added, as a series of transport steps and nucleation/decomposition processes take place that will depend on the morphology, microstructure and surface chemistry of the conductive support. Side reactions with the metallic anode and dendrite formation further complicate the cell chemistry, and therefore, the cycle life of both cell systems remains insufficient to date. The Li/O2 cell particularly suffers from additional side reactions related to electrolyte decomposition at the positive electrode. Many challenges therefore must be tackled in order to develop practical systems.
Research on sodium-ion batteries (NIBs) has recently been revived and is largely motivated by the natural abundance of sodium [3-10]. The sodium content in the earth’s crust and water amount to 28,400 mg/kg and 11,000 mg/L compared to 20 mg/kg and 0.18 mg/L for lithium [11]. Additionally, the number of known sodium compounds is much larger as compared to lithium, and thus combinations of electrode materials that enable the development of batteries based solely on low cost elements (or that provide specific advantages that complement Li-ion technology in special applications) are expected. It is interesting to note that sodium-ion and lithium-ion batteries were studied in the 1970s and 1980s. However, due to the success of the lithium-ion battery (and probably the insufficient overall quality of materials, electrolytes and glove boxes [3]), research on sodium-based batteries was largely abandoned. The only exceptions were the high temperature systems Na/S8 and Na/NiCl2[12-15].
Although one would initially assume very similar cell chemistries for otherwise identical LIBs and NIBs, the behavior is in most cases quite different. The reason is related to the larger size of the sodium ion that affects the phase stability, the transport properties and the interphase formation. The basic characteristics of multielectron transfer reactions involving sodium-based conversion reactions have been recently summarized and appear quite attractive. However, similar challenges compared to lithium-based conversion reactions are also found [10].
The intriguing question is whether the chemical differences between sodium and lithium could help to solve some of the challenges known for the Li/S8 and Li/O2 cells. Although an unavoidable penalty with respect to the energy density is paid when replacing lithium by sodium, the theoretical value for a room-temperature Na/S8 battery with Na2S as a discharge product (1273 Wh/kg) and a Na/O2 cell with Na2O2 as a discharge product (1600 Wh/kg) are still very high compared to LIBs. However, to date, only very little is known about the room temperature chemistry of Na/S8 and Na/O2 cells. Only around thirty studies have been published as of 2014 in total. Although there is some dispute about the stoichiometry of the discharge products in these cells, it has been demonstrated that Na/O2 cells can be cycled with much better performance as compared to the analogue Li/O2 cell. Replacing lithium by sodium might therefore be an effective strategy to improve the reversibility of high energy battery systems, notwithstanding the reduced theoretical energy capacity.
Some general differences between lithium and sodium cells are immediately apparent:
The lower melting point of sodium (Tm,Na = 98 °C) as compared to lithium (Tm,Li = 181 °C) and its generally higher chemical reactivity pose additional safety issues for cells using metal anodes. On the other hand, cell concepts with a molten anode might be easier to realize given the advantages of better kinetics and prevention of dendrite formation.
Sodium is softer than lithium, making handling and processing more difficult. On the other hand, avoiding dendrite formation by means of mechanical pressure can be easier.
Sodium is less reducing than lithium, meaning that more substances are thermodynamically stable in direct contact with the metal. This can be an important advantage when designing cell concepts including solid ion-conducting membranes. Many Li-ion conducting solid electrolytes degrade exposed to direct contact with metallic lithium [16]. Moreover, by employing beta-alumina, an excellent Na-ion conducting solid electrolyte is commercially available.
The total number of known sodium compounds is larger compared to lithium, so cell reactions might require more intermediate steps or stop at a different stoichiometry. Two notable exceptions exist that might be of advantage for sodium cells. Aluminium forms binary alloys with lithium but not with sodium. Therefore, aluminium instead of the more expensive copper can be used as a current collector for the negative electrode in sodium batteries. Another exception that might have practical relevance is that sodium, in contrast to lithium, does not form a stable nitride when exposed to N2 atmosphere. This has an immediate impact on Li/O2 and Na/O2 cells when operated under air.
The larger sizes of the sodium atom and ion compared to lithium (+82% for the atom and +25% to +55% for the ion, depending on the coordination) lead to larger volume changes during cycling. Sodium-based electrodes might therefore degrade faster and the formation of stable interfaces might become more difficult. But the smaller size of the lithium ion corresponds to a larger charge density, and the lithium ion polarizes it environment stronger than the sodium ion. This causes severe differences in chemical bonding and ion mobility.
The solubility of sodium and lithium compounds in solvents are different. The discharge products and/or interphases (SEI formation) can therefore dissolve to different degrees and electrolyte solutions might have different properties.
2 Lithium–oxygen (Li/O2) and sodium–oxygen (Na/O2) batteries
This section is organized as follows. Firstly, the basic operating principles and energy densities of Li/O2 and Na/O2 cells are discussed. Secondly, the state-of-the-art knowledge on Li/O2 cells is summarized. As several reviews have been published in this field, we will only briefly highlight important achievements and discuss recent developments. Thirdly, the available literature on the Na/O2 cell is summarized and similarities and differences to the analogue Li/O2 cell are discussed. Li/S8 and Na/S8 batteries are discussed the same way in chapter 3. The section will end with a brief summary and outlook.
2.1 Operating principles and general remarks
The operating principle of a lithium–oxygen battery is depicted in Figure 2b. The major difference compared to Li-ion batteries is that the battery is designed as an open system that enables uptake and release of atmospheric oxygen at the cathode during cycling (hence the name “lithium–air battery”, which is misleading as mostly pure oxygen gas is used). During discharge, lithium is oxidized at the negative electrode and oxygen is reduced on the positive electrode. Similar to a fuel cell cathode, the positive electrode is a porous, electron-conducting support (gas diffusion layer, GDL) that enables oxygen transport, oxygen reduction (ORR) and oxygen evolution (OER) during cell cycling. Carbon-based materials are mostly used for this purpose. Considering the basic principle of this cell concept, some challenges are immediately obvious: (1) The implementation of special membranes is necessary to prevent contamination of the cell by unwanted gases from the atmosphere (N2, CO2, and also H2O for the case of non-aqueous systems) and to protect the metal electrode from oxygen exposure. At the same time, drying out of the cell due to solvent evaporation must be avoided. (2) The gas transport must be fast enough to enable sufficiently fast discharging and charging. (3) The cell needs to provide enough free volume to accommodate the discharge product.
The reaction product depends on the type of electrolyte used. In aqueous electrolytes, water becomes part of the cell reaction and dissolved LiOH is formed during discharge, which precipitates as LiOH·H2O once the solubility limit is reached. The need to protect the lithium anode from direct contact with water is experimentally challenging, so most research has been devoted to lithium–oxygen batteries with an aprotic electrolyte. Some possible discharge products can be directly predicted from the Li–O phase diagram shown in Figure 3a. Under ambient conditions, the thermodynamically stable phases are lithium oxide (Li2O) and lithium peroxide (Li2O2). As these compounds are insulators, GDLs with a high surface area are used to improve the kinetics. Two other cell concepts that have been studied to a lesser extent are cells with a mixed aprotic/aqueous electrolyte and cells based on solid electrolytes. A sodium–oxygen battery can be designed exactly the same way but the phase diagram (Figure 3b) shows that in addition to Na2O2 and Na2O, sodium superoxide (NaO2) can also be formed (although possibly only kinetically stable under ambient conditions). The relative stability of NaO2 was recently calculated by two groups with somewhat controversial results (see the section The sodium–oxygen (Na/O2) battery for more details). Sodium ozonide (NaO3) has been frequently reported as being unstable under ambient conditions and hence is not considered. Different discharge products may form in alkali-metal–oxygen cells. As will be discussed later in more detail, the discharge products in aprotic electrolytes are Li2O2 in Li/O2 cells, and Na2O2 and NaO2 (and Na2O2·2H2O) in Na/O2 cells. It is an open and interesting question whether the relative stability of the different alkali oxides is correctly represented in the phase diagrams, as the influence of water may have been overlooked. It is well known that even small amounts of water can stabilize oxide phases, which are otherwise absent in the phase diagram [17].
Figure 3:
(a) The Li–O phase diagram. (b) The Na–O phase diagram. Figure redrawn based on [18] and [19].
Figure 3:
(a) The Li–O phase diagram. (b) The Na–O phase diagram. Figure redrawn based on [18] and [19].
The theoretical cell voltages and energy densities of the cell reactions are summarized in Table 1. We note that also potassium-oxygen batteries are being studied [20,21]. The energy densities however, are lower. The values for energy densities vary depending on whether the weight of oxygen is included or not, but all metal–oxygen batteries are superior compared to Li-ion batteries in terms of theoretical energy capacity. This is also the case for cells with NaO2 as a discharge product, although they are based on one-electron transfer. It is important to note that all values in Table 1 are theoretical values. As the concept of metal–oxygen batteries requires many additional design-related components (e.g., gas diffusion layer, membranes to minimize oxygen diffusion towards the metal anode and to minimize access of other detrimental gases from the atmosphere) the weight penalty for reaching a commercial product will be much higher as compared to LIBs. The estimated values of the practical energy density vary greatly. Values of 1700 Wh/kg at the cell level and 850 Wh/kg at the battery level have been suggested by Girishkumar et al. [22], while Christensen et al. estimated around 1300 Wh/kg for the cell level [23]. PolyPlus, one of the leading companies working on lithium–air batteries, project 600 Wh/kg and 1000 Wh/L, respectively [24]. Recently, Gallagher et al. comprehensively studied the use of Li–air batteries for electric vehicles (EVs) and predicted values of around 250–500 Wh/kg and 300–450 Wh/L on the system level. The authors concluded that Li–air batteries will not be a viable option for commercial automotive applications [25], which then also would exclude Na–air systems. An additional challenge for electric vehicle application is that the current densities of lithium–oxygen cells (usually below 1 mA/cm2) are still too small and an improvement by one to two orders of magnitude is necessary, as the target current density should be in the range of 8–80 mA/cm2[23,26]. Although these estimates depend on the assumptions made, it is clear that the competition between lithium–oxygen batteries and LIB technology will depend on the application. In any case, the limits of such a technology will only be fully apparent once a meaningful prototype has been built. The only report of a fully engineered cell reported in the literature is given by PolyPlus for a primary, aqueous, lithium–air battery. Their cells with a total capacity of about 10 Ah achieved 800 Wh/kg at a current density of 0.3 mA/cm2[24]. Given the fact that research on rechargeable lithium–oxygen cells is still at a more fundamental level, possible applications should therefore not be restricted to EVs.
Table 1:
Theoretical cell voltage, E°, gravimetric and volumetric energy density, Wth, and charge density Qth for lithium–oxygen and sodium–oxygen batteries with a metal anode. Values for the gravimetric energy densities are given without and including the weight of oxygen. All other values given refer to the discharged state. Thermodynamic data derived from HSC chemistry for all compounds in their standard state at 25 °C. Calculations for the aqueous systems are simplified and assume formation of hydrated hydroxide with all water resulting from the electrolyte.
Cell reaction
E° / V
Wth / Wh/kg
Qth / mAh/g
Wth / Wh/L
Qth / mAh/cm3
3.40
2684 / 2172
639
3280
1634
2.91
11229 / 5216
1794
10501
3606
2.96
11421 / 3456
1168
7983
2698
2.77
1486 / 1281
462
–
–
1.95
2273 / 1687
867
3828
1968
2.33
2717 / 1602
689
4493
1936
2.27
2643 / 1105
488
2431
1074
Li-ion (average cathode vs Li/Li+)
3.8
530
140
2300
600
For sodium cells, the theoretical energy densities are smaller compared to the analogue lithium systems. Therefore, the development of a high energy device might be more challenging unless the sodium cell chemistry provides specific advantages which might include: (1) faster kinetics of the oxygen electrode in the case of NaO2 as a discharge product, (2) a higher tolerance against atmospheric nitrogen as no stable nitride exists, (3) cell concepts with a molten sodium electrode [26], or (4) the availability of beta-alumina as a solid electrolyte that might enable cell concepts including solid membranes.
Considering all of these aspects, lithium–oxygen and sodium–oxygen batteries are very attractive means for energy storage in theory, but the development of practical cells is an ambitious goal. Even in the best scenario, such materials are unlikely to be developed for EV applications. However, the major showstopper for the development of rechargeable alkali–air devices is that the cell systems usually suffer from severe side reactions that hinder stable cell cycling for a large number of cycles. As will be discussed below, the sodium–oxygen cell indeed shows some promising advantages over the lithium system but several fundamental challenges must be understood and solved before the development of a practical battery might become feasible.
2.2 Classification of voltage profiles
The basic properties of a cell reaction can be easily discerned from diagrams showing the voltage profiles (discharge/charge curves) as their shape provides direct information on the complexity, reversibility and efficiency of the cell reactions. At moderate currents, most of the Li/O2 and Na/O2 batteries show quite similar discharge curves: the discharge voltage is more or less constant and comparably close to the theoretical cell potential. The discharging stage ends with a sudden potential drop (“sudden death”). The charging curves, however, vary significantly and heavily depend on the cell configuration (sodium or lithium cell, type of electrolyte, use of catalysts, type of GDL, etc.). So in order to more easily discuss the experimental results, the classification of the voltage profiles according to the shape of the charging curves is useful (Figure 4).
Figure 4:
Matrix for classifying voltage profiles of metal–oxygen batteries. Type 1A is the ideal case. Frequently observed are Type 1B, 2C, 3B and 3C. The coulombic efficiency is calculated as Φ = Qcharge/Qdischarge × 100%.
Figure 4:
Matrix for classifying voltage profiles of metal–oxygen batteries. Type 1A is the ideal case. Frequ...
The starting point of the matrix is the ideal cell reaction, classified as Type 1A. The voltage profile is characterized by negligible overpotentials for discharge and charge and a Coulombic efficiency of Φ = 100%, that is, the charging voltage is close to its theoretical value and charging ends with a sudden increase in cell potential as soon as all discharge products are decomposed. Based on this ideal cell reaction, the following matrix can be derived.
Type 1: The combined overpotentials (sum of the overpotentials during discharge and charge) approach zero, meaning that kinetic limitations are negligible.
A: Coulombic efficiency = 100%. The cell reaction is completely reversible. B: Coulombic efficiency < 100 %. The reaction is only partially reversible. Possible reasons are that some of the discharge product became electrochemically inactive, lost contact to the electrode, or underwent irreversible side reactions with other cell components. C: Coulombic efficiency > 100 %. Either electrochemical side reactions or a so-called shuttle process (chemical shortcut) between both electrodes takes place. A shuttle process can be intentional (e.g., overcharge protection in LIBs) or unintentional (e.g., polysulfide shuttle in lithium–sulfur batteries). Unless it is intentional, Coulombic efficiencies exceeding 100% are always a sign of undesired side reactions. Note that in this case the Coulombic efficiency of the desired cell reaction is also below 100%. Values exceeding 100% simply arise from the fact the shuttling/side reactions give rise to additional external currents leading to charging capacities exceeding the discharge capacities.
Type 2: Considerably high combined overpotential occurs and the cell kinetics are sluggish. Various processes can contribute to overpotential, but using catalysts or optimizing the transport properties might be effective strategies for improvement.
Type 3: The voltage continuously increases during charging and might exhibit additional plateaus. Such a behavior indicates a more complex electrode reaction. In most cases, this is a strong indication of undesired side reactions. Additional plateaus during charging can originate from the electrochemical decomposition of side products stemming from undesired side reactions between cell components and the discharge product. For example, Li2O2 can react with the electrolyte to form Li2CO3, which decomposes during charging at high voltages. Another possibility is that the cell discharge was incomplete (e.g., the discharged state is a mixture of Na2O2 and NaO2) and the different discharge products decompose at different potentials during charging.
The matrix certainly includes some simplifications: side reactions might be time dependent, the voltage profile can change during cycling, overpotential increases with current density, etc. However, the matrix allows for a straightforward classification of the large number of different experimental results published. Briefly, the more different the voltage profile is from the ideal case (Type 1A), the more challenges that have to be tackled to achieve a reversible cell reaction. So far most metal–oxygen batteries show the following behavior when cycled at moderate rates: Type 1B is found for Na/O2 cells with NaO2 as discharge product. Type 2C, 3B, and 3C are found for Li/O2 and Na/O2 cells with either Li2O2, Na2O2, or Na2O2·2H2O as a discharge product.
It is important to note that values for the capacity, Q, of metal–oxygen cells are presented differently as it is usually done. The common way in battery research is to state the capacity in mAh per gram of active material, that is, per gram of LCO or sulfur, for example. This is possible because the electrode contains all active material and the battery is a closed system. In open metal–oxygen batteries, the active material (oxygen) is not part of the electrode and the discharge product forms as a new phase during discharge. Therefore, capacity values are usually given in mAh per gram of carbon support. As the absolute amount of carbon used is usually very small, the reported capacity values can reach very high numbers, easily exceeding 1000 mAh/g. Stating this value only, however, is clearly not sufficient to judge the performance of the cell and may easily mislead the uninformed reader [22,27]. At a minimum, carbon loading (mg/cm2), electrode size and thickness of the carbon layer (if known) and the total amount of charge should be stated. Given this, the charge density (mAh/cm3) and areal capacity (mAh/cm2) can be calculated and benchmarked against commercialized LIB materials (approximately 1–4 mAh/cm2 and 350–600 mAh/cm3). A comparable problem is that the common definition of the C rate cannot be applied to metal–oxygen cells without further assumptions, and therefore, discharge and charge rates are usually given as current density (calculated by using the cell cross section).
2.3 State-of-the art and recent developments
2.3.1 The lithium–oxygen (Li/O2) battery: In 1969, A. E. Lyall filed a patent application on “A room-temperature-operated fuel cell comprising an oxygen electrode, a lithium metal-containing electrode, and an electrolyte comprising an inert, aprotic organic solvent […], which contains an inorganic or organic ionizable salt […]” [28]. Interestingly, the components of this Li/O2 battery are remarkably close to those utilized today. The pioneering work on rechargeable, room temperature, Li/O2 batteries with a non-aqueous electrolyte can be summarized as follows. In 1996, Abraham et al. reported on “A polymer electrolyte-based rechargeable lithium/oxygen battery” [29]. This cell could be re-charged at room temperature at least three times at potentials as low as 3.8 V. In 2002, Read characterized a Li/O2 cell comprising different carbon materials and different electrolyte formulations [30]. This was the first work to analyze and correlate the amount of consumed gaseous oxygen with respect to the transferred electric charge, and found that this value varies strongly depending on electrolyte composition. As will be discussed in the following sections, this kind of characterization is crucial for both evaluating and understanding aprotic Li/O2 cells. He interpreted this variation using mixtures of Li2O2 and Li2O which are formed during discharge.
Today’s strong interest in Li/O2 batteries was most likely initiated by the work of Bruce et al. who reported on a Li/O2 cell in 2008 that could be efficiently cycled, resulting in capacities as high as 3000 mAh/gcarbon by introducing α-MnO2 nanowires as catalyst in the oxygen cathode [31]. From 2008 onwards, the number of publications on Li/O2 batteries rapidly increased. The progress in Li/O2 research and development is the subject of numerous review articles [22,32-34]; therefore, we focus here on a brief summary of, in our opinion, the major trends in current research efforts.
2.3.1.1 Catalysts: As shown by Bruce et al., Li/O2 cells with liquid aprotic electrolyte can apparently be recharged, but rather high potentials (>4 V vs Li/Li+) for the decomposition of Li2O2 (OER) are required. Hence, research focused on the preparation and characterization of catalytically active materials for Li/O2 cells is aimed at higher discharge capacities and lower overpotentials during cycling. Various metal oxide materials, mostly manganese oxides (MnO2, Mn3O4), but also others have been proposed [9,31,35-38] as well as noble metals [39-41]. In 2011, McCloskey et al. attentively figured out that catalysts such as Pt, MnO2 or Au also promote the decomposition of the aprotic electrolyte rather than the oxygen evolution reaction (see also Figure 5) [42]. Although both the functionality and the necessity of heterogeneous catalysts in Li/O2 cells remain unsolved, the search for improved heterogeneous catalysts for improved cyclability is still the subject of many new articles on Li/O2 batteries. The most promising catalyst material, ruthenium nanocrystals, was reported by Sun et al., and the cells show a type 3A hysteresis (see Figure 4) with a charge potential as low as 3.5 V [41].
Figure 5:
DEMS analysis of Li/O2 cells with different electrolyte compositions, namely a mixture of propylene carbonate and dimethoxyethane, PC:DME, (a–c) and pure dimethoxyethane, DME, (d–f). Furthermore, gold, platinum and manganese dioxide were tested as heterogeneous catalysts. (a) and (d) show the galvanostatic cycling characteristics. (b) and (d) show the desired oxygen (O2) evolution during charging, and (c) and (f) show the corresponding carbon dioxide (CO2) evolution measured. Figure adapted with permission from [42], copyright 2011 American Chemical Society.
Figure 5:
DEMS analysis of Li/O2 cells with different electrolyte compositions, namely a mixture of propylene...
2.3.1.2 Electrolyte instability: Liquid aprotic electrolytes containing carbonate-based solvents such as propylene carbonate (PC), ethylene carbonate (EC), diethyl carbonate (DEC), or dimethyl carbonate (DMC) have been applied in almost all of the experimental studies on catalyst materials between 2006 and 2010, because these compounds are well used in LIBs. A comprehensive overview of the properties of liquid lithium electrolytes is given in [43]. In the beginning, only minor attention had been paid to clarify the chemistry taking place in the cells, for example by analyzing all chemical species being formed during cycling. In 2010 Mizuno et al. reported an FTIR and TEM study of the reaction products in Li/O2 cells employing a PC based electrolyte [44]. They concluded that, although the cell was cycled up to 100 times, lithium carbonate (Li2CO3) and lithium alkyl carbonate species (RO–(C=O)–OLi) instead of Li2O2 were found as discharge products. In the following, similar observations for various carbonate-based solvents were reported by other groups as well [45-48]. The experimental findings are supported by computational studies looking into molecule stability and possible decomposition pathways for the solvents [49,50] and it is now clear that carbonate-based electrolytes are not suitable for aprotic Li/O2 cells. In addition it was found that many electrolyte salts are at least partially decomposed during cell cycling as well [47,51-53]. From this perspective, it is of note that even as early as 1991, Aurbach et al. reported the irreversible decomposition of propylene carbonate (PC) in the presence of oxygen during cyclic voltammetry experiments [54].
2.3.1.3 Stable electrolytes: The finding that the decomposition of the carbonate solvents was responsible for much of the capacity in Li/O2 cells was a setback that quickly changed the research focus to the stability and potential decomposition reactions of the electrolyte components. Three different reactive oxygen species may be involved in solvent decomposition reactions: (a) molecular oxygen (O2), (b) superoxide (, “LiO2”) and (c) peroxide species (, Li2O2). The individual role of these different species in the decomposition reactions is still unclear. In a number of studies on different solvents have been made including ionic liquids [55-57], sulfoxides (DMSO) [58-60], amides [61,62], and others [62-64]. The ether-based glyme solvents with the general structure CH3–O–(CH2–CH2–O)n–CH3 with n = 1–4 are the current state-of-the-art solvents [65-69], although they are not entirely stable. A solvent with better performance still must be found. Adams et al. recently reported on a chemically modified monoglyme (DME), 2,3-dimethyl-2,3-dimethyoxybutane, as a promising solvent as it leads to a significantly lower CO2 evolution (see DEMS) and lower overpotentials for both discharge and charge [70]. Analogous to the lithium–sulfur batteries, the use of lithium nitrate (LiNO3) seems to improve the cyclability of Li/O2 cells as well. In publications by Liox Power Inc., it was shown that LiNO3 leads to an improved stability of the lithium electrode solid electrolyte interphase (SEI) formation [61]. Kang et al. showed that it also leads to an improved stability of carbon at the cathode [71].
2.3.1.4 Differential electrochemical mass spectrometry (DEMS) studies: The electrolyte decomposition is a major drawback that made DEMS studies inevitable in Li/O2 cell research. Today, this real-time analysis of the gaseous species being consumed or released during cell cycling is a necessary standard technique. In an ideally operating cell, only oxygen (O2) evolves during recharge, but in reality, other products such as CO2, H2O or H2 are detected and give evidence for unwanted side reactions. Therefore, DEMS or online electrochemical mass spectrometry (OEMS) was introduced into the Li/O2 battery field and is now one of the most important, but seldom employed, diagnostic tools of current research [46,72-77]. Figure 5 shows the potential of DEMS analysis when comparing different electrolyte and oxygen electrode materials in an Li/O2 cell [42]. Figure 5a,d shows the galvanostatic cycling characteristics for a PC:DME electrolyte and a pure DME electrolyte, respectively. For both electrolytes, in addition to a pure carbon electrode, heterogeneous catalysts, such as Pt, Au and MnO2 were also tested. It was shown that the catalysts (especially in combination with the PC:DME electrolyte) lead to a significant reduction of the charge overpotential, and in the case of Pt, by almost 1 V in comparison to pure carbon. However, the corresponding DEMS data in Figure 5b,c clearly prove that only minor amounts of oxygen (O2) but mainly CO2 is evolved during the charging of the cell. Thus, by means of DEMS, McCloskey et al. could clearly prove that the improved rechargeability due to the heterogeneous catalysts is not related to an improvement of the Li2O2 decomposition, but rather to the promotion of the electrolyte decomposition. In contrast, in pure DME electrolyte, oxygen evolution is indeed observed. However, in this case, the catalyst materials had almost no impact on the charge overpotential, but again only led to an increased evolution of CO2.
2.3.1.5 Number of electrons per oxygen molecule, e−/O2: As already mentioned above, Read observed that in certain electrolytes the oxygen consumption during discharge was too low for the sole formation of Li2O2 and proposed that Li2O is formed in concomitance [30]. Looking back to these results, one can now definitively assume that Read observed the partial decomposition of the electrolyte during discharge rather than the formation of Li2O species. Hence, it is of crucial importance to understand that for metal–oxygen cells the reversibility cannot be proven by solely stating Coulombic efficiencies. It is, as introduced by Read, the ratio between consumed or released oxygen and the amount of transferred charge that gives the true reversibility. For an ideal Li/O2 cell, where Li2O2 is reversibly formed, two electrons are transferred for each reacting oxygen molecule, or 2.16 mAh for 1 mL of gaseous oxygen at 298 K and 105 Pa. Any deviation from this ratio is a strong indication for (partial) malfunction and hence, this value is essential, especially when new electrolyte or electrode components are tested. A simple but effective way to measure this ratio is the usage of a pressure sensor and a hermetic gas reservoir as introduced by McCloskey et al. [46,78] or via quantitative DEMS/OEMS, which in addition allows for the identification and separation of the gaseous reactants [42,60,66,68,74]. In addition to the analysis of gaseous reactants, first attempts are also made to quantify the amount of discharge product formed [67,78-80]. This will also be an important step towards true reversibility evaluation.
2.3.1.6 Electrode materials: Obviously a Li/O2 cell is a very reactive environment and it seems likely that the different oxygen species would also react with other components of the oxygen electrode. Black et al. exposed battery components to potassium superoxide dissolved in aprotic liquids and found that polyvinylidene fluoride (PVDF), a common binder material, decomposes while lithium fluoride (LiF) is formed [81]. They suggest that LiO2, a strong base that is formed as an intermediate in a Li/O2 cell, extracts protons from the PVDF polymer. From the thermodynamic point of view, carbon is also reactive towards, for example, Li2O2 or oxygen at high oxidative potentials, too. For this purpose McCloskey et al. employed a 13C carbon electrode and monitored CO2 species via DEMS evolved during the charge process [82]. The appearance of 13CO2 at the end of the charge process was taken as evidence for carbon oxidation. Similar findings were made by Thotiyl et al. (Figure 6) who proposed that carbon oxidation can be avoided as long as potentials remain below 3.5 V vs Li/Li+[83]. The same group also investigated non-carbon electrodes, such as nanoporous gold or titanium carbide (TiC) [60,84]. Both materials are claimed to significantly improve the cycle performance compared to carbon electrodes due to a higher chemical stability towards lithium oxide species. On the other hand, the solvent employed in their study (DMSO) is known to be unstable in Li/O2 cells [85,86]. Notwithstanding the above, the understanding of electrode corrosion and the search for stable electrode materials, either modified carbons or non-carbon materials, is of crucial importance for a reliable Li/O2 battery.
Figure 6:
Sketch by Thotiyl et al. illustrating their findings on the oxidation of the carbon electrode. At discharge at potentials below 3 V, mostly Li2O2 is electrochemically formed and accompanied by electrolyte decomposition. During recharge at potentials between 3.0 and 3.5 V, CO2 evolution is mainly related to electrolyte decomposition. Lastly, at potentials higher than 3.5 V, oxidation of the carbon electrode takes place. Figure adapted with permission from [83], copyright 2012 American Chemical Society.
Figure 6:
Sketch by Thotiyl et al. illustrating their findings on the oxidation of the carbon electrode. At d...
2.3.1.7 Particle growth and dissolution: At first glance, the chemistry of a Li/O2 cell may appear quite simple, however, due to worldwide research efforts within the last four years, it was recognized that it is in fact, a very complex cell chemistry. As a consequence it was necessary to refocus on fundamental aspects such as the growth and dissolution process of Li2O2 particles during cycling on a microscopic scale. Various morphologies of Li2O2 deposits are reported in literature. On the one hand, so-called Li2O2 “donuts” or toroids are reported that form to a diameter of up to 1 µm, depending on solvent and cycling conditions (see Figure 7). On the other hand, thin film coverage of the carbon electrode is found. It is reported that at low current densities large toroid-like particles form and that at high current densities Li2O2 film formation takes place [32,87]. Interestingly, Read basically made the same observation in 2002 and concluded that large particles could only grow if the oxide (Li2O2) is (a) soluble in the electrolyte (b) able to migrate on electrode surface or (c) capable of catalyzing the oxygen reduction [30]. Theoretical studies are particularly focused on possibility (c) and look for electric transport in Li2O2. Since Li2O2 is an intrinsic wide band gap insulator, additional transport mechanisms such as transport along metal-type surfaces or hole polaron transport are proposed [88-91]. The assumption of a soluble redox-active species (e.g., soluble O2−), as polysulfides in the case of lithium–sulfur or sodium–sulfur batteries, has only very recently been seriously taken into account. Viswanathan et al. suggest that Li2O2 grows only to film deposits of 5–10 nm in thickness because charge transport through the Li2O2 layer can only proceed by hole tunneling [92,93]. In a very recent study they propose that the comparably large donut structures can only be observed in the presence of water in the electrolyte, which leads to soluble superoxide species [94]. Their findings, however, are in contrast to those of Zheng et al. who were able to operate a model all-solid-state Li/O2 cell, without any liquid electrolyte, in an environmental SEM and observed the formation of large toroid particles larger than 500 nm [95]. To conclude, even the dissolution process of Li2O2 during battery operation is not fully understood and continues to be a part of research efforts.
Figure 7:
SEM image of toroidal Li2O2 nanoparticles on a carbon fiber (10 µm in diameter) that form as a discharge product in lithium–oxygen cells (C. L. Bender, JLU Giessen).
Figure 7:
SEM image of toroidal Li2O2 nanoparticles on a carbon fiber (10 µm in diameter) that form as a disc...
2.3.1.8 Electrolyte additives: The electrochemical activity of Li2O2 itself is quite poor without doubt, especially for the charge process (OER). Hence catalysis is necessary especially when aiming for experimental current densities. The results of heterogeneous catalysts until now did not fulfill the expectations. A new and promising concept is to add soluble and redox-active molecules to the liquid electrolyte. In 2011 Liox Power Inc. filed a patent application on such “soluble oxygen evolving catalysts for rechargeable metal–air batteries” [96]. Those often called redox mediators (RM) molecules possess a redox potential higher than that of Li2O2 (E°RM > E°Li2O2 = 2.96 V vs Li/Li+). During recharge of the battery the RM molecules are oxidized at the oxygen electrode. Subsequently, the oxidized RM molecules oxidize Li2O2 chemically and hence catalyze the OER. In 2013 Chen et al. reported on tetrathiafulvalene (TTF) as RM with redox potentials, TTF/TTF+ and TTF+/TTF2+, of 3.4 to 3.7 V. With TTF in a DMSO:LiClO4 electrolyte the Li/O2 cells showed a Type 1C hysteresis and significantly improved kinetics for the charge process. In addition e−/O2 ratios very close to two, as expected for Li2O2 oxidation, were claimed [97]. Also lithium iodide [98] and TEMPO [99] have been recently studied as RMs with promising results (see Figure 8). It is worth noting that redox mediators (also called “relays”) are used also in other applications for the improvement of poor electrode kinetics.
Figure 8:
Illustration of TEMPO as a redox mediator (RM) in an Li/O2 cell reversibly catalyzing the Li2O2 oxidation. Figure adapted with permission from [99], copyright 2014 American Chemical Society.
Figure 8:
Illustration of TEMPO as a redox mediator (RM) in an Li/O2 cell reversibly catalyzing the Li2O2 oxi...
An interesting and complementary approach is to increase the solubility of oxides species (e.g., Li2O2) in the liquid electrolyte which would allow fast transport of oxide species to active electrode sites. Lim et al. synthesized TFSI based cations that are able to considerably increase the solubility of Li2O2 in DMSO [98], and Lopez et al. reported on hexacarboxamide cryptands that are capable of incorporation of peroxide dianions in solution [100]. As these approaches are quite new, several questions such as long term functionality and stability of the molecular additives in an Li/O2 battery need to be investigated. Nevertheless, we believe that major improvements are possible due to chemical tailoring of the molecules with respect to desired functionality.
In conclusion, several challenges for the development of aprotic Li/O2 cells with competitive performance remain. Within the last few years more and more researchers focus on the chemical processes taking place during operation of metal–oxygen batteries, which surely will lead to deeper understanding of Li/O2 batteries and its potential in application. This is remarkable, especially in the fast moving field of battery research, as experimental mechanistic studies are usually time demanding and require both a careful execution of experiments and the use of complex and often expensive analytical methods.
2.3.2 The sodium–oxygen (Na/O2) battery: The sodium–oxygen battery is based on the same cell concept as the lithium–oxygen battery, however, only very little literature is available. Mostly aprotic electrolytes have been used and only one study on a mixed aprotic/aqueous electrolyte has been published. This may be due to the strong reactivity of sodium with water. Although research on Na/O2 cells started only in 2010 the number of publications now rapidly increases. To date, more than 20 studies have been published altogether. The currently most striking characteristic of aprotic Na/O2 cells is that, in contrast to Li/O2 cells, a number of different discharge products have been reported: sodium superoxide (NaO2), sodium peroxide (Na2O2), sodium carbonate (Na2CO3), hydrated sodium peroxide (Na2O2∙2H2O) and sodium hydroxide (NaOH). The underlying reason for this is not clear yet but it might be also related to the different experimental conditions used in the different studies. A summary of selected experimental parameters and reported discharge products is shown in Table 2.
Table 2:
Literature overview on Na/O2 cells summarizing experimental conditions and reported discharge products.
aSee Figure 4 for graphical representations of the different types.
Figure 9 shows a literature timeline of all studies on sodium–oxygen cells. Most of them report on the general cell chemistry and performance improvements in terms of capacity and cycle life. Some related studies including carbon dioxide assisted cells or high temperature cells are also included. These reports are shown in grey and will be discussed at the end of this literature survey. Also two review papers by Das et al. [112] and Ha et al. [113] have been very recently published.
Figure 9:
Literature timeline of research papers on aprotic sodium–oxygen batteries (ranked after date of acceptance).
Figure 9:
Literature timeline of research papers on aprotic sodium–oxygen batteries (ranked after date of acc...
Peled et al. were the first to publish an electrochemical cell based on the reaction of sodium with oxygen in 2010 [26]. The cell was adopted from a fuel cell design and consisted of a molten sodium electrode, a polyglyme/PC (90:10) based electrolyte with different additives and a Pt containing carbon electrode. The cell operated at 105–110 °C. The high temperature concept with molten anode was chosen for several reasons: Counteracting the sluggish cathode reactions, lowering the cell impedance, eliminating dendrites and minimizing interference with water and carbon dioxide. On the other hand, the high reactivity towards the electrolyte was an issue. The cell discharged at 1.75 V (100 µA) and was charged at 3.0 V (50 µA). The discharge product of a full discharge was assumed to be sodium peroxide without further proof by analytical techniques. Later on, the same group published a follow-up study with the main focus on investigating SEI formation and sodium plating/stripping in an ionic liquid based electrolyte [114]. Na2SO4 was added to the electrolyte as SEI former. Although sodium plating/stripping was obtained for 300 cycles without internal shortcuts, the efficiency with around 70–80% was still unsatisfying. In general, these results underline that studying the reversibility of the ORR/OER reactions in metal–air batteries is not sufficient as also plating/stripping of the alkali metal needs to be reversible in order to achieve a long cycle life. Cell discharge using this IL based electrolyte at 25 µA/cm2 was characterized by a sloping decrease, charging (250 µA/cm2) mainly occurred at about 3 V. As we will see in the following, the overall cycling behavior of this cell is very different from cells operating with a solid sodium anode at room temperature.
In 2011, Sun et al. showed first results on an aprotic, room temperature sodium oxygen cell (Figure 10a) [101]. In contrast to Peled et al. they made use of a solid sodium foil as anode and a diamond-like carbon thin film electrode as cathode. In accordance with typical lithium–oxygen cells they used 1 M NaPF6 in EC:DMC 1:1 as the liquid, aprotic electrolyte. The cell setup was an H-shaped glass cell. Using transmission electron microscopy, single area electron diffraction and Fourier transform infrared spectroscopy sodium peroxide (Na2O2) and sodium carbonate (Na2CO3) were proven as discharge products. These products vanished during charge with overpotentials exceeding 1 V similar to lithium–oxygen cells. Overall, the cell performed just like a typical lithium–oxygen battery, however, the discharge potentials were slightly lower (around 2.4 V), as expected. In 2013, the same group (Liu et al., [103]) used graphene nanosheets as cathode and NaPF6 dissolved in monoglyme as electrolyte. This way, discharge capacities as high as 9268 mAh/gcarbon were achieved. Again, sodium peroxide was described as the discharge product and large overpotentials were observed (Figure 10b). In both cases, the voltage profile can be classified as Type 2C.
Figure 10:
Sketch of the first room temperature sodium–oxygen cell and its discharge and charge potentials during the first ten cycles (left), Figure adapted with permission from [101], copyright 2012 Elsevier B.V. The voltage profile can be classified as Type 2C. Voltage profile of a sodium–oxygen cell with graphene nanosheets as cathode and NaPF6 in DME as electrolyte (Type 2C) (right). The discharge product was identified as sodium peroxide. Figure adapted with permission from [103], copyright 2013 The Royal Society of Chemistry.
Figure 10:
Sketch of the first room temperature sodium–oxygen cell and its discharge and charge potentials dur...
In 2012 Hartmann et al. [109] reported a sodium–oxygen battery with sodium superoxide (NaO2) as discharge product. Unequivocal proofs for superoxide formation were provided by X-ray diffraction, Raman spectroscopy and pressure monitoring. SEM studies revealed that, in contrast to Li/O2 cells for which nanoscopic Li2O2 toroids are found, NaO2 forms large micrometer-sized cubic crystallites (compare Figure 7 with Figure 11). The cells showed only very small combined overpotentials of about 200 mV during cycling which was attributed to the kinetically favored one-electron transfer. Shortly after, similar findings were reported for potassium–oxygen cells. Here, KO2 forms during discharge and a very similar voltage profile has been found [20]. The Coulombic efficiency of the sodium superoxide cell in the first cycle was around 90%, discharging and charging ended with a sudden voltage drop and increase, respectively. The voltage profile can therefore be classified as Type 1B, meaning that the cell cycles more ideal than Li/O2 cells or Na/O2 cells with peroxides as discharge products. The achieved discharge capacity with 300 mAh/gcarbon was relatively low due to the high mass of the free standing electrode. On the other hand, the absolute capacities were comparably high. Cycle life, however, was poor and the capacity faded to virtually zero within ten cycles. The study also included a direct comparison in cycling behavior between otherwise identical Na/O2 and Li/O2 cells. The latter showed a much smaller discharge capacity and the expected large overpotentials. Although the Na/O2 cell with NaO2 as discharge product shows a much more reversible cell reaction compared to the Li/O2 cell, it should be noted that also the Na/O2 cell is not entirely free from side reactions either. Overall, this study provided clear evidence that lithium–oxygen and sodium–oxygen batteries can behave completely different.
Figure 11:
Discharge/charge curves (Type 1B) of a sodium–oxygen battery with NaO2 as discharge product. The main differences compared to Li/O2 cells are that only small overpotentials are observed and that the crystallite size of the discharge product is much larger (see SEM image on the right) [109].
Figure 11:
Discharge/charge curves (Type 1B) of a sodium–oxygen battery with NaO2 as discharge product. The ma...
Later on, the same group published a more comprehensive study on their findings using a range of different methods including DEMS, pressure monitoring, XPS, SEM, UV–vis spectroscopy, XRD and Raman spectroscopy [78]. The reason why NaO2 grows to such large crystals is still not clear yet, but precipitation of NaO2 from a supersaturated solution was suggested as a possible growth mechanism. XPS studies showed that the reason for the poor overall reversibility might be due to decomposition of the conductive salt. Further, the issue of dendrite formation in Na/O2 cells was discussed.
Kim et al. studied the influence of the electrolyte solvent on the discharge product in sodium–oxygen cells [106]. The electrode was made of Ketjenblack, a typical high surface area carbon. Capacities of 2800 mAh/g and even 6000 mAh/g were reported for PC and tetraglyme, respectively. The voltage profiles were of Type 2C. The discharge product was not the same as reported in literature before. Using FTIR spectroscopy and X-ray diffraction they found that sodium carbonate was the major discharge product for carbonate based electrolytes and hydrated sodium peroxide (Na2O2·2H2O) was the discharge product for tetraglyme. The authors suggested that the water molecules stem from the irreversible decomposition of the electrolyte. But comparing this result to the study by Hartmann et al. who found NaO2 using diglyme as solvent, it becomes clear that a direct link between ether solvents and formation of Na2O2·2H2O cannot be drawn. Indeed, the reason why different groups find different discharge products is not clear yet.
Liu et al. studied the influence of nitrogen doping of the carbon electrode on the performance of sodium–oxygen batteries [103]. Compared to a pure graphene cathode the doped one showed considerably higher discharge capacities reaching up to 8600 mAh/gcarbon. In both cases, Na2O2 formed during discharge as evidenced by XRD. Galvanostatic cycling and cyclic voltammetry revealed that nitrogen doping is effective in reducing the overpotentials during discharge and charge. The hysteresis, however, can be still classified as a Type 3B. SEM was used to study the morphology of the discharge product as a function of the discharge current. In line with what is known from Li/O2 cells, particles form at low currents whereas film formation is observed at higher currents.
Only a short time later another high capacity cathode was presented by Jian et al. [107]. They used a carbon nanotube electrode in combination with two different electrolytes, namely NaTFSI in tetraglyme and NaTfO in diglyme. Although the latter showed a higher discharge capacity (7530 mAh/g compared to 6000 mAh/g), the overall performance was similar. During discharge hydrated sodium peroxide was formed as evidenced by XRD. Charging started at small overpotentials but was quickly followed by a rapid increase in voltage. Only 50% of the capacity could be recovered during charging. The performance could be improved by shallow cycling at around 13% of the full capacity, however, all voltage profiles can by classified as Type 3B.
Additional physicochemical aspects of the Na/O2 cell with NaO2 as discharge product were discussed by Hartmann et al. in 2014 [110]. Here, pressure monitoring was successfully combined with the standard electrochemical methods galvanostatic cycling and cyclic voltammetry. Furthermore, electrochemical pressure impedance spectroscopy (EPIS) was introduced as a tool to study the transport properties within the cell. With this, the experimental data were fitted by a quantitative microkinetic model that is based relevant parameters and transport process describing the cell. Further, solubility and diffusion coefficients of oxygen in several solvents were determined and operation of the Na/O2 cell under mixed O2/N2 gas atmosphere was demonstrated. Importantly, NaO2 was found as discharge product despite the addition of nitrogen gas. On the other hand, the discharge capacity under synthetic air was much lower compared to pure oxygen. This result underlines that metal–air batteries need to be studied also at lower oxygen partial pressures when aiming at practical applications.
Around the same time two theoretical studies were published. Lee et al. studied the phase stabilities of different possible discharge products as a function of the oxygen partial pressure and calculated that NaO2 and respectively Li2O2 are most stable under standard conditions [115]. Surface energies were calculated and used to predict the Wulff equilibrium shape of the different phases. The cubic crystallites predicted for NaO2 are well in line with what has been experimentally reported (see Figure 11). Finally, it was calculated that the OER from superoxides is kinetically favored compared to peroxides. Kang et al. studied the phase stabilities of sodium–oxygen compounds as a function of temperature, partial pressure and, importantly, also crystal size [116]. In contrast to the results of Lee et al., they found that Na2O2 is the most stable phase at standard conditions in the bulk phase. In the nanometer regime, however, NaO2 becomes more stable due to its lower surface energy. The threshold under standard conditions is approximately reached for crystal sizes of ≈6 nm in diameter. For the same reason, also nucleation of NaO2 is preferred over Na2O2 at any oxygen pressure and temperature. The authors state that NaO2, once nucleated during discharge, may never transform to Na2O2.
The fundamental difference in cell behavior between otherwise identical Li/O2 and Na/O2 cells was further pointed out by McCloskey et al. [67]. They compared lithium–oxygen to sodium–oxygen cells with ether based electrolytes by means of DEMS measurements. Ratios for n(e–)/n(O2) of around 2 and 1 were found for the different cells, respectively, indicating formation of Li2O2 in Li/O2 cells and formation of NaO2 in Na/O2 cells. In line with other studies finding NaO2, the voltage hysteresis showed a Type 1B behavior, that is, small overpotentials during charging (≈200 mV) and a sudden voltage increase at the very end of charging. The Li/O2 cell showed Type 3C behavior, that is, an increase in voltage during charging resulting in very high overpotentials of more than 1.5 V. Interestingly, this significant difference in overpotentials is not seen by cyclic voltammetry using a glassy carbon working electrode. The authors suggest that the difference in overpotentials between lithium and sodium based cells is due to the different reactivity of the discharge products: During charging, Li2O2 reacts with the electrolyte and carbon cathode to form Li2CO3 leading to a continuous increase in overpotential. In contrast, NaO2 is less reactive and hence no Na2CO3 forms. As a consequence, overpotentials during charging remain small.
Bender et al. discussed possible origins for the different discharge products observed in Li/O2 and Na/O2 cells by comparing tabulated thermodynamic data of the different phases [27]. A graphical representation is shown in Figure 12 and is based on thermodynamic data of the bulk phases (T = 298 K, p = 1 bar). The kinetic barriers shown are only a guide to the eye as absolute values are not known. Three relevant aspects can be seen: (1) In both systems, the peroxide is thermodynamically most stable at standard pressure and should therefore form as discharge product, (2) In the Na/O2 system, NaO2 and Na2O2 are thermodynamically quite close, whereas in the Li/O2 system, Li2O2 and Li2O are very close. For Na/O2 cells this means that the cell voltages for NaO2 (2.27 V) and Na2O2 (2.33 V) formation are very close. Given the uncertainty of the thermodynamic data it becomes clear that the discharge mechanism cannot be simply derived from the discharge potential. (3) The phase stability naturally depends on the oxygen partial pressure, meaning that NaO2 or LiO2 might become more stable than the peroxides at elevated pressures. For NaO2, the threshold can be estimated to 133 bar, which well explains why the chemical synthesis of phase pure NaO2 from Na2O2 in autoclaves occurs at partial pressures and temperatures of around 280 bar and 475 °C [117].
Figure 12:
The thermodynamic landscape of (a) sodium– and (b) lithium–oxygen cells. All values are calculated for the reaction 2A + 2O2 → A2Oy + (2–y/2)O2, where y = 1,2,4. Figure adapted with permission from [27], copyright 2014 Wiley-VCH.
Figure 12:
The thermodynamic landscape of (a) sodium– and (b) lithium–oxygen cells. All values are calculated ...
The authors suggested that as the energetic difference between NaO2 and Na2O2 is so small (about 12 kJ/mol), slight differences in the kinetic properties might lead to either of them as discharge products. A reasonable assumption for what controls the kinetics of the cell reaction is the type of carbon electrode. Indeed, the different groups reporting on Na/O2 cells all used different carbon materials which might explain the different findings. The authors therefore tested a range of different carbon materials but concluded that the type of carbon has no influence on the nature of the discharge product as in all cases NaO2 was found as major discharge product. Overall, Type 1B behavior was found in all cases. The achievable capacities, however, were significantly affected by the type of carbon (Figure 13, left). Furthermore, shallow cycling at around 33% of full capacity enabled cycling of the cell for more than 50 cycles with a capacity of 1666 mAh/g using a Ketjenblack electrode with 0.5 M NaOTf in diglyme as electrolyte.
Figure 13:
Voltage hysteresis of different carbon materials for the cathode of a sodium oxygen cell (left), figure adapted with permission from [27], copyright 2014 Wiley-VCH. SEM image of the oxygen electrode of a Na/O2 cell after discharge with Na2O2 and Na2CO3 as discharge product (right), figure adapted with permission from [105], copyright 2014 Elsevier.
Figure 13:
Voltage hysteresis of different carbon materials for the cathode of a sodium oxygen cell (left), fi...
Liu et al. substituted the commonly used carbon electrode by a nickel based composite electrode consisting of nickel foam covered with NiCo2O4 nanosheets [105]. NaClO4 in monoglyme was used as electrolyte. The pure nickel foam was shown to be inactive. For the composite, however, a discharge capacity of 1762 mAh/g (at 20 mA/g based on the mass of the nanosheets was found). A strong capacity fade was observed during cycling. The voltage profiles can be classified as Type 3B/3C. IR spectroscopy and TEM/SAED were used to determine the discharge products. Sodium peroxide and, as a result of side reactions, Na2CO3 were found. The electrodes after discharge were further studied by SEM. Flat sheets with a diameter of around 20 µm were found (Figure 13, right). Obviously, this morphology is very different from the cubic particles reported for cells with NaO2 formation.
Another study discussing reasons for the different types of discharge products reported in literature was published Zhao et al. [111]. Vertically aligned carbon nanotubes grown on a steel substrate were used as oxygen electrode, sodium triflate in tetraglyme was used as electrolyte. Voltage profiles were of Type 1B and consequently also NaO2 in form of cubic particles was observed as discharge product. The cell delivered a capacity of more than 4000 mAh/gcarbon. Improved cycle life was achieved with shallow cycling at 750 mAh/g (19% DOD). More than 100 cycles have been achieved this way. Rate performance was improved by electrochemically predepositing a thin layer of NaO2 at low currents (67 mA/g). This procedure was applied to increase the overall number of nucleation sites for product formation during subsequent cycles at higher currents. By doing so, a capacity of around 1500 mAh/g was achieved at 667 mA/g, for example. An important feature of the study was that the cells were not only cycled under static atmosphere in a sealed container but additionally also under continuous gas flow. Pure oxygen or an Ar/O2 (80/20) mixture were used. Interestingly, the authors found NaO2 under static conditions and Na2O2·2H2O under continuous gas flow. The authors suggest that humidity is likely to be introduced when applying a constant flow (presumably due to leakage or gas impurity). Charging was followed by XRD and it was found that Na2O2·2H2O decomposes to form water, O2 and NaOH leading to higher overall potentials and a Type 3B behavior, see Figure 14. It is important to note that a continuous gas flow is closer to the operation mode of a practical cell operating with atmospheric oxygen. Further studies are therefore needed to clarify the source and impact of H2O on the cell reaction.
Figure 14:
Voltage profiles of Na/O2 cells under static gas atmosphere and flowing gas atmosphere (Type 1B/3B). Figure adapted with permission from [111], copyright 2014 The Royal Society of Chemistry.
Figure 14:
Voltage profiles of Na/O2 cells under static gas atmosphere and flowing gas atmosphere (Type 1B/3B)...
Yadegari et al. studied the relation between specific surface area and discharge capacity using chemical activation of commercial carbon black by NH3 or a CO2 gas [108]. Sodium triflate in diglyme was used as electrolyte. The results can be summarized as follows: The longer the chemical treatment, the higher the specific surface area, the higher the discharge capacity. The major discharge product was Na2O2·2H2O although small amounts of Na2O2 and NaO2 were also detected by combining different methods. As the PVDF binder used in this study is known to be unstable against the superoxide radical, the authors suggested that the formation of the hydrated peroxide is related to the binder decomposition. As a result of the complex mixture of discharge products, the charging curves were characterized by several steps. Overall, all voltage profiles were of Type 3C. The morphology of the electrode after discharge showed quite some similarities compared to the study by Liu et al. It was further shown that the discharge rate influences the voltage behavior during charging.
Overall comparison
For a better comparison of the published literature, we digitalized the voltage profiles and grouped them according the different discharge products. The result is shown in Figure 15. Groups finding sodium superoxide as discharge product find a Type 1B behavior with low overpotentials and a sudden voltage increase once the end or recharge is reached. Efficiencies are typically above 80%. Groups finding Na2O2·2H2O as discharge product find a Type 3C behavior. Characteristic for this behavior are increasing potentials and no defined end point of charge, indicating a complex charging mechanism and side reactions. Different sources for H2O have been suggested, but its origin is still a matter of debate. Groups finding Na2O2 as discharge product usually observe voltage profiles with Type 2C or 3C behavior. A sudden or sloping increase in potential during charging and no defined end point of charge are observed in these cases.
Figure 15:
Literature overview on different studies of Na/O2 cells. The comparison shows the voltage profile of the first cycle. Data has been digitalized from the different publications. Only cells with NaO2 as discharge product show a defined voltage hysteresis, combined with low overpotentials and a defined end point during recharge. Please note that some groups measure in 3-electrode, others in 2-electrode configuration.
Figure 15:
Literature overview on different studies of Na/O2 cells. The comparison shows the voltage profile o...
In addition to the studies discussed so far some other related concepts have been suggested. Das et al. proposed a cell concept that mainly aims at CO2 capture while at the same time generating electrical energy [102]. Their cells can be therefore described as Na/(O2 + CO2). The authors investigated the cell discharge behavior under different gas ratios and found that a 50:50 mixture of O2 and CO2 yielded higher discharge capacities than the single gases. Na2CO3 and Na2C2O4 were suggested as discharge products. No charging curves were shown as the cell was designed as primary cell. In a later study, the same group used an organic/inorganic hybrid liquid electrolyte in order to enable partial recharge [118]. The voltage profiles are of Type 3C and show combined overpotentials of up to around 2.5 V. The discharge product was found to be NaHCO3.
Hayashi et al. published results on a Na/O2 battery with a mixed aqueous/aprotic electrolyte. Both electrolytes were separated by a Nasicon solid electrolyte [119]. Discharge capacities of about 600 mAh/g (based on the weight of Na and H2O) with NaOH as the discharge product were achieved, which is only 30% lower than the theoretical capacity of the cell reaction; however, no data on rechargeability was shown. The concept of combining different types of electrolytes has been already applied for Li/O2 cells. But the authors point out that the much higher solubility of NaOH in aqueous electrolytes compared to LiOH might be of an important advantage. Clogging of the cathode by precipitated hydroxide might be delayed and an even higher energy density could be obtained.
3 Lithium–sulfur (Li/S8) and sodium–sulfur (Na/S8) batteries
3.1 Operating principles and general remarks
The lithium–sulfur battery system has been studied for several decades. The first patents and reports on lithium–sulfur batteries date back to the 1960s and 70s [120-122]. However, a rapid increase in research efforts and progress in development was only achieved within the last 10 to 15 years. The number of research publications is growing exponentially. The most studied cell concept is based on lithium as a negative electrode and solid sulfur as a positive electrode. Lithium sulfide (Li2S) is the final discharge product and the only thermodynamically stable binary Li–S phase, as shown in Figure 16a. The theoretical cell voltage of 2.24 V is comparably low but due to the high capacity of sulfur (1672 mAh/g) the theoretical energy density by weight (2615 Wh/kg) exceeds that of LIB by a factor of five. The basic cell concept of a lithium–sulfur battery is depicted in Figure 2c. The main challenges of the lithium–sulfur battery are related to two intrinsic properties:
Sulfur and Li2S are insulators, and intimate contact to a conductive support and sufficiently small particle sizes are necessary to render a complete cell reaction. At the same time, the support must accommodate the volume change of 80% that arises from the difference in molar volumes of sulfur (15.5 mL/mol) and Li2S (28.0 mL/mol).
Formation of Li2S from sulfur does not occur directly but via a series of polysulfide intermediates (Li2S2 and Li2Sx, x > 2). Polysulfides of the stoichiometry Li2Sx are highly soluble in commonly used electrolytes, meaning that the active material diffuses out of the positive electrode and eventually reacts with the negative electrode or deposits somewhere else in the cell where it remains inactive. So cycling sulfur in a Li/S8 battery is essentially based on dissolution and precipitation processes as schematically illustrated in Figure 17. Despite several efforts, however, it is still not well understood in which amounts and stoichiometries polysulfides form. The polysulfide solubility leads to a parasitic phenomenon called the ‘‘shuttle mechanism’’ [123] (Figure 18) that corresponds to a chemical shortcut of the cell. This effect essentially leads to continuous self-discharging during discharge, charge and rest. The degree of the shuttle effect heavily depends on the experimental conditions. Shuttling becomes stronger at small current and/or higher temperatures [123,124]. Moreover, also sulfur S8 itself is mobile and was found to diffuse rapidly [125].
The complex cell reaction gives rise to a characteristic discharge/charge profile as shown in Figure 19. Both the discharge and the charge voltage profiles consist of two voltage plateaus occurring at about 2.3 V and 2.1 V (discharge) or 2.3 V and 2.4 V (charge), respectively. Within the higher discharge plateau the soluble intermediate polysulfides are formed, corresponding to reduction of S0 to S−0.5 (), accounting for a quarter of the overall capacity. Further reduction leads to formation and precipitation of insoluble species leading to an overall two electron reduction of S with Li2S as end product. During the following charge, Li2S is reconverted to S8 via intermediate polysulfides, ideally. The characteristic minimum between the upper and the lower discharge plateau is attributed to the nucleation of solid products [126,127]. The exact position of the potentials also depends on the electrolyte solvent [128].
Figure 16:
(a) The Li–S phase diagram. (b) The Na–S phase diagram. Redrawn from references [129,130]. The Na–S phase diagram also depicts the operating window of the commercialized high temperature cell and alternative cell concepts operating at low temperature – including room temperature – that are on the research level.
Figure 16:
(a) The Li–S phase diagram. (b) The Na–S phase diagram. Redrawn from references [129,130]. The Na–S phase di...
Figure 17:
Schematic illustration of the reduction processes at the negative electrode during discharge of a Li/S8 battery. Reduction of sulfur S8 proceeds over several soluble polysulfide intermediates (Li2Sx) before the final precipitation of solid phases, Li2S and eventually Li2S2 occurs. The cell discharge can be also followed by UV–vis spectroscopy, as different polysulfides give rise to different coloration. Illustration adapted from [124].
Figure 17:
Schematic illustration of the reduction processes at the negative electrode during discharge of a L...
Figure 18:
Schematic illustration of the polysulfide shuttle mechanism after Mikhaylik and Akridge [123]. Long polysulfides diffuse towards the lithium electrode where they are reduced to shorter polysulfides. Subsequently, these shorter polysulfides diffuse back to the positive electrode where they are oxidized. As a result, a cyclic process (“shuttle mechanism”) develops that corresponds to a chemical shortcut of the cell. Illustration adapted from [124].
Figure 18:
Schematic illustration of the polysulfide shuttle mechanism after Mikhaylik and Akridge [123]. Long poly...
As a result of these effects, the Coulombic efficiency is low, utilization of sulfur in Li/S8 cells is poor and the capacity diminishes within a few cycles. Therefore special measures have to be taken in order to improve the performance of Li/S8 cells.
The most frequently applied strategy to improve the cell performance is to use (nano)porous carbon materials as support that provide high surface area and electronic conductivity and at the same time prevent or delay the loss of active material towards the electrolyte. Electrode mixtures are prepared by simply mixing the carbon materials with sulfur or by infiltrating the carbon matrix with molten sulfur above its melting point (Tm = 119 °C). A typical electrode for Li/S8 batteries then contains typically around 50–70 wt % sulfur, 30–50 wt % carbon and a small amount of binder. For comparison, the amount of carbon as conductive additive for electrodes in conventional LIBs is well below 5 wt %.
During the last 5–10 years, a large number of different sulfur/carbon nanocomposite materials has been studied and often considerable improvements in terms of sulfur utilization and cycle life were achieved compared to cells with conventional carbon materials. Overall, nowadays several tenths to several hundreds of cycles with capacity values around 700–1000 mAh/g are realized and the combined overpotentials in the first cycles are roughly around 200 mV. But whether the improvements are really due to specific structural properties of the nanocomposite is, however, not easy to answer considering the complexity of the possible reactions in a lithium–sulfur cell. It also turned out that the characterization of sulfur/carbon nanocomposite materials may pose problems and results can be misleading due to the high sulfur mobility [125]. The main issue, however, is that the performance of Li/S8 cells is particularly sensitive to the properties of the electrode (thickness, sulfur content, sulfur loading, preparation method, etc.) and the amount of electrolyte and lithium. In fact, quite reasonable results can be obtained with commercially available carbon materials once the electrode preparation is optimized [131,132]. Assessing the achievements of the last years, in general, long cycle life and high sulfur utilization has so far obtained only for low sulfur loadings (often <1 mg/cm2) and large excess of both electrolyte and lithium. Excess of lithium and electrolyte are necessary as both continuously react with each other during cycling. However, low loadings and large excess of lithium and electrolyte are no option for practical devices, and it will be the key to competitive Li/S8 cells to bring cathodes with high sulfur loading (about 5 mg/cm2) and a low electrolyte/sulfur ratio to function [131,133-137]. Overall, to enable a high energy battery, the electrolyte:sulfur ratio should be smaller than 5:1 (for comparison, the ratio of electrolyte and active material in conventional LIBs is around 1:3) and the sulfur content of the electrode should be at least 70% providing at least 2–4 mAh/cm2 (i.e., the typical areal capacity for LIBs).
Besides the attempts to improve the cathode design, also a number of other strategies are followed in order to improve the performance of lithium/sulfur batteries (see section, The lithium–sulfur (Li/S8) battery). The cell concept shown in Figure 2c is by far the most studied one but also other concepts have been proposed. The high solubility of polysulfides can be used to design cells with a liquid electrode (catholyte), for example. Although this concept has been studied already many years ago [121], it only recently regained attention [138]. On the other hand, solid-state concepts are being considered [139-141].
The theoretical energy densities of the lithium–sulfur battery are summarized in Table 3. But from the above arguments it becomes clear that experimental energy densities will be much lower. No lithium–sulfur cell has been commercialized yet but several companies announced (gravimetric) energy densities for rechargeable cells significantly exceeding lithium-ion technology. Sion Power currently reports 350 Wh/kg on the cell level but aims for over 600 Wh/kg and 600 Wh/L in the near future [142]. Oxis Energy reports 300 Wh/kg (2014) and predicts 400 Wh/kg (forecast in 2016) [143]. The rate capability of lithium–sulfur cells is thought to be competitive with high-rate LIBs [144]. At moderate rates of C/10, the combined overpotentials of Li/S8 amount to roughly 150–250 mV. By and large, the lithium–sulfur cell as rechargeable energy store appears to have a realistic chance for commercialization, but will compete with continuously optimized LIB.
Table 3:
Theoretical cell voltages, gravimetric and volumetric energy (Wh/kg, Wh/L) and charge (mAh/g, mAh/cm3) densities for lithium– and sodium–sulfur batteries with a metal anode. Due to the large differences in their densities, the volumetric energy densities of metal–sulfur cells strongly depend on whether they are in the charged or discharged state. Charge densities refer to the discharged state, that is, to the sulfides. Thermodynamic data were derived from HSC Chemistry for all compounds in their standard state at 25 °C or 300 °C. Densities at 300 °C are estimates. In contrast to LIBs, metal–sulfur cells are usually assembled in the charged state. The theoretical capacity of the positive electrode is therefore usually given based on the mass of sulfur only, so the theoretical capacity is Qth = 1672 mAh/g for full reduction of sulfur to form Li2S or Na2S.
Cell reaction
E° / V
Wth / Wh/kg
Qth / mAh/g
Wth / Wh/L
Qth / mAh/cm3
2.24
2615
1167
4289 / 2896
1914
1.85
1273
687
2364 / 1580
1245
(25 °C)
2.03
626
308
1326 / 997
653
(300 °C)
1.90
583
308
1124 / 845
653
Li-ion (average cathode vs Li/Li+)
3.8
530
140
2300
600
In contrast to the lithium–sulfur battery, the analogue room temperature sodium–sulfur battery has been hardly studied to date but the challenges for the construction of well functioning cells will be quite similar. However, the theoretical energy density of a Na/S8 cell is roughly 50% smaller compared to the analogous Li/S8 cell, due to higher atomic mass of sodium. So if only energy density is considered, the Na/S8 cell will not be competitive with LIB technology both in terms of volumetric and probably also gravimetric energy density. Besides, the even larger volume change of the sulfur electrode during cycling (170% for Na2S formation compared to 80% for Li2S formation) will pose additional problems.
A look at the phase diagrams shows that different cell reactions might occur in Li/S8 and Na/S8 cells, as several Na2Sx compounds are thermodynamically stable at room temperature. This means that during cell discharge, polysulfides might not only dissolve in the electrolyte, but may also precipitate as solids. Whether the stability of solid Na2Sx polysulfides is of advantage or disadvantage for a reversible cell reaction remains an open question, but – generally speaking – solid phases are likely to have detrimental effects on the cell kinetics compared to dissolved Na2Sx species. It is worth noting that also Na2S3 has been reported as stable phase, however, it turned out to be a eutectic mixture of the stable polysulfides Na2S2 and Na2S4[130]. The Na–S phase diagram (see Figure 16b) also depicts the high-temperature Na/S8 cell that operates with molten electrodes and a solid electrolyte. As the polysulfides Na2Sx have high melting points, the cell reaction at around 300 °C is limited to a narrower stoichiometric window, meaning that full reduction of sulfur cannot be achieved. The theoretical energy density for high temperature Na/S8 cells is therefore limited. In practice, 200 Wh/kg has been achieved on the battery level.
Overall, one can look at the room-temperature Na/S8 cell from two perspectives: (1) Compared to a Li/S8 cell, substituting lithium by the more abundant sodium appears attractive, and the same strategies for improving Li/S8 batteries (sulfur utilization, cycle life) might apply for Na/S8 batteries. An advantage for sodium could be that sodium solid electrolytes are commercially available, that would enable efficient protection of the metal anode from polysulfides. On the other hand, the theoretical energy densities are lower and the larger volume expansion might lead to severe problems. (2) Compared to a high-temperature Na/S8 cell, decreasing the operating temperature would be attractive because safety and corrosion issues are reduced. In addition, if full reduction of sulfur to Na2S can be accomplished, an increase in system's energy density might be possible.
A compromise could be to operate the cell at intermediate temperatures below 200 °C [145-147]. Here, the sodium anode (Tm = 98 °C) can be either solid or liquid, a NASICON-membrane (Na Super Ionic Conductor) or beta-alumina membrane is used as solid electrolyte and the cathode is based on a mixture of sulfur or Na2Sx in an organic solvent. Such an approach has been already discussed in 1980 by G. Weddigen [148].
3.2 State-of-the-art and recent developments
3.2.1 The lithium–sulfur (Li/S8) battery: As mentioned earlier, a considerable number of papers are currently being published in the field of lithium–sulfur batteries. This summary is intended to highlight the key strategies currently followed for improving the performance of Li/S8 batteries. The same strategies might be adopted to improve the performance of the analogue room temperature Na/S8 battery, although research in this field is still on an exploratory level. For a more comprehensive and complete overview on lithium–sulfur batteries, the authors refer to more specialized reviews [149-155].
The challenges of the Li/S8 system address all of its main components. Hence, main approaches striving to find a solution for these challenges, address (1) cathode composition and architecture, (2) electrolyte composition and additives and (3) improvements or alternatives to the Li anode. Beyond the improvement of the single components – both from fundamental and engineering point of view – a comprehensive understanding of the complicated redox chemistry of the Li/S8 system has to be obtained. Therefore, the demand in analytics and simulation studies of the electrochemistry is constantly growing. This section will close with an outlook to new cell design approaches to address the special chemistry of Li/S8 batteries.
3.2.1.1 Cathode: The ideal cathode of a lithium–sulfur battery should provide the following features: (a) A high electronic conductivity and fine dispersion of the active material to achieve a complete active mass utilization and high rate capability. (b) A structure confining the active mass to prevent the loss of polysulfides and hence the shuttle effect. (c) A flexible structure to accommodate the volume changes during cycling. (d) A sufficient active mass loading to compete at least with current lithium ion batteries (LIBs). Points a–c can be addressed by developing and engineering conductive supports. Mostly porous carbon or carbon composite materials are used for this purpose. Again, we emphasize that the sulfur loading on the electrodes needs to be sufficiently high in order to achieve high energy densities in practice. For example, a sulfur loading of more than 2 mg/cm2 and 100% sulfur utilization is necessary in order to reach technically relevant areal capacities of about 3.5 mAh/cm2. This aspect has been often overlooked in the last years but needs to be considered when claims on the practical rather than the academic relevance of new electrode architectures are made.
A few of the recent approaches are highlighted in the following. General remarks on the electrode preparation methods will be given at first.
Electrode preparation and binders: Intimate contact between carbon and sulfur is usually obtained by heating sulfur/carbon mixtures above the melting point of sulfur, leading to melt infiltration of the porous support. Some more specific approaches combine a first melting step followed by evaporation of excess surface–sulfur [156] or deposition of sulfur over the gas phase [157]. Apart from some binder-free cathode approaches (see below), binders play a particularly important role when preparing the final electrodes from the sulfur/carbon mixtures. Beyond the ability to bond the cathode components and link them to the current collector, binders have to be flexible enough to accommodate the volume change. Furthermore, they should favor a maximum dispersion of the active material and the conductive agent and limit polysulfide dissolution. Established binders for LIBs such as polytetrafluorethylene (PTFE) or polyvinylidene fluoride (PVDF) have been used long time for Li/S8 cells but may not provide sufficiently good properties. Polyethylene glycol (PEO, PEG) as one of the earliest alternative binders may improve cycle life [158,159] by electrolyte modification through partial dissolution. As first published by Sun et al. [160], gelatin as an environmentally benign and abundant binder shows improved bonding and helps to improve the dispersion of the active mass. It also may cause an improvement of the redox reversibility [160] and the rate capability [161]. Other binders, such as polyvinylpyrrolidone (PVP)/polyethyleneimine (PEI) show similar abilities [162]. Furthermore, the water-soluble binder SBR/CMC (styrene-butadiene rubber/carboxyl methyl cellulose) favors a uniform distribution and a network-like cathode structure [163].
Porous carbon structures: A straightforward approach to achieve favorable conductivities is to mix the insulating active material with porous carbons. Depending on the major pore size, d, they are distinguished as microporous carbon (d < 2 nm), mesoporous carbon (2 nm < d < 50 nm) or macroporous carbon (d > 50 nm). Especially microporous carbons combine electronic conductivity with an ability to trap polysulfides as first published by Wang et al. in 2002 [164]. Zhang et al. claimed that micropores can work as micro-reactors confining the active mass in the cathode [165]. In more recent studies by Guo and coworkers, an effective steering of the chain length of the active material was obtained by pore sizes smaller than S8 molecules of orthorhombic sulfur needing a space of about 0.7 nm [166-168]. The shorter chain length polysulfides show strong adsorption to the carbon matrix and the unfavorable transition between S8 and with intermediate polysulfides is hindered, resulting in high cycle life at a lower discharge plateau of 1.9 V [153,169].
Especially for microporous supports, a sulfur loading exceeding 50% is difficult due to the limited overall porosity that is provided by microporous carbons [165,169-171]. Also mesoporous carbons are able to trap polysulfides and provide space for a higher sulfur loading [127,170]. As published by Li et al. [172], there is always a tradeoff between complete filling with sulfur resulting in topmost energy density and partial filling leading to better battery performance but lowering energy output. Macroporous supports have been less investigated despite of their high pore volume, as the open structure does not seem to favor polysulfide confinement. However, when immobilizing the polysulfides by providing strong interaction to the matrix [170,173,174] or the use of a highly viscous electrolyte [175], macroporous carbon frameworks may be useful. For both meso- and macro-porous supports, nitrogen doping is promising to improve polysulfide confinement [176]. Bimodal or hierarchical porous carbons were used as compromise to combine confinement of sulfur in small pores while enabling also a higher sulfur loading due to larger pores. Bimodal pore structures were first published by Liang et al. [177]. Although possessing a 3D structure (see below), it should be noted that the CMK-3 ordered mesoporous carbon published by Ji, Lee and Nazar [178,179] was a major starting point for studying tailored, hierarchical carbon materials (see Figure 20).
Figure 20:
Schematic diagram of the interconnected pore structure of mesoporous CMK-3 impregnated with sulfur (left). TEM image of the impregnated and the pristine (small inset) CMK-3. Figure adapted with permission from [178], copyright 2009 Macmillan Publishers Ltd. Process of formation of S–TiO2 yolk–shell structures via core–shell formation and partial dissolution of sulfur (right) [180]. TEM image of the yolk–shell structure with nanoparticles of 800 nm size and shell thickness of 15 nm. Figure adapted with permission from [180], copyright 2013 Macmillan Publishers Ltd.
Figure 20:
Schematic diagram of the interconnected pore structure of mesoporous CMK-3 impregnated with sulfur ...
A range of other special carbon nanostructures have been tested for Li/S8 batteries. They are applied in pure form or in combination with conventional carbon materials such as carbon black or activated carbon. Interwoven networks can be obtained by using carbon fibers or nanotubes, for example [179,181]. Cao et al., Zhou et al. and others have reported on sandwich-like electrodes with two graphene layers incorporating the active material, one used as a lightweight current collector, the second used as a barrier for polysulfides [33,182,183]. On the other hand, graphene oxide sheets have been used for wrapping poly(ethylene glycol) covered sulfur particles to obtain confining structures [184].
To completely avoid polysulfide leakage, core–shell- or yolk–shell-structures have been developed to confine the active material inside their electronic and ionic conductive hull. Hollow carbon spheres (void up to 500 nm) with porous shell (up to 50 nm thickness) can be obtained via a hard template nanocasting [157], for example. However, when dealing with an active material that undergoes volumetric expansion and constriction during cycling, closed structures can break. Therefore “yolk–shell”-structures have been suggested that leave enough room for expansion. The latter approach was published by Cui and coworkers [180] comprising sulfur nanoparticles as yolk inside a TiO2 shell. The material showed excellent stability for more than 1000 cycles and high Coulombic efficiencies, but only low cathode loadings were reported.
Binder-free electrodes: As the additional weight of the binder reduces the overall energy density of Li/S8 cells, binder-free electrodes are studied as alternative. The preparation of binder-free electrodes also avoids the use of often toxic solvents that are necessary for conventional electrode preparation. Elazari et al. reported on a carbon fiber cloth that was able to maintain mechanical strength and conductivity during cycling [170], for example. Vertically aligned carbon nanotubes (VACNTs), directly grown via CVD-process on a metal current collector were published by Dörfler et al. [185]. The high void volume inside the ≈200 µm thick (94 vol %) films was especially favorable for high sulfur uptake, which was later on shown by Hagen and Dörfler et al. [185,186]. Vertically aligned CNTs without a substrate were produced by Zhou [187] using an aluminum anodic oxidized template. Another attempt was published by Manthiram et al., using self-interweaving MWCNTs as free-standing electrodes [188]. Overall, binder-free electrodes might be a viable alternative to standard electrodes. Areal loadings of 7.1 mg/cm2 yielding areal capacities of about 5.5 mAh/cm2 (50% S utilization) were achieved, although at a low rate of 5/C, for example [185]. Lower loadings allow higher rates of up to 3.5C with specific capacities around 700 mAh/g after 25 cycles [187]. However, reports of more than 100 cycles have not been published yet.
Lithium–sulfide cathode: Li/S8 cells are usually assembled in the charged state which is less ideal considering safety. Cell assembly in the discharged state, that is, with Li2S as positive electrode is intrinsically more safe and has another advantage: The use of anode materials such as Si [189] and Sn [190] and other alloys becomes feasible [189,191,192]. Beginning in the 1970s [193], numerous approaches for Li2S cathode formation and investigation on the basic principles have been published. As claimed by Yang et al. [194], when cycling Li2S as a cathode material, the first charge is hindered by a potential barrier originating from the slow charge transfer during the oxidation of Li2S to Li2−xS, requiring a higher cut-off voltage up to 4 V. Beyond, the hygroscopic property of Li2S prohibits handling in air. As stated above, Li2S is also an ionic and electronic insulator and requires conductive agents to function as an electrode, hence, comparable approaches to the S composite cathodes have been used [189,190,192,195]. More interesting is the direct chemical synthesis of Li2S electrodes without Li2S as the starting material: It can be obtained by lithiating a sulfur–carbon composite with stabilized lithium metal powder in situ by compression [196] or with n-butyllithium [189]. Archer and coworkers have investigated two different novel approaches towards Li2S–C composites: (1) The well-known Leblanc process can be used to reduce sulfates with carbon [197] and (2) Li2S builds strong crosslinks with the nitrile groups of polyacrylonitrile (PAN) [198]. Both result in Li2S–C composites after carbonization and show promising results. Recently, Lin and coworkers used the reaction of Li2S and P2S5 in THF to form a Li2S–Li3PS4 core–shell structure [199].
3.2.1.2 Electrolytes: The electrolyte will probably play the most fundamental role in the Li/S8 battery – potentially even more important than the cathode microstructure, as the solubility of polysulfides and hence the shuttle-effect are dramatically affected by the solvent [121,200-202]. Furthermore, the electrolyte has to be suitable for both the highly reactive Li anode and the sulfur-composite cathode with its special requirements. One important property is good polysulfide solubility to ensure fast and complete reactions between Li and the sulfur [155,200]. On the other hand, a high solubility will accelerate shuttling and loss of active material. Most ether-based solvents can dissolve polysulfides very well, most prominent examples are 1,3-dioxolane (DOL) and 1,2-dimethoxyethane (DME), tetraethylene glycol dimethyl ether (TEGDME, tetraglyme) and sometimes ethers with longer chain length [200,203-205]. Carbonate-based solvents used for conventional LIBs will most likely not be used in future Li/S8 batteries. This is due to their reactivity with polysulfides and because they are less compatible with lithium [205-208]. Nowadays, the most common solvent is a binary mixture of a cyclic ether (DOL) and a linear ether (DME), which was found to provide a good overall compromise between sulfur utilization, rate capability, temperature window and anode compatibility [209]. Lithium bis(trifluoromethanesulfonyl)imide (LiN(SO2CF3)2, LiTFSI) is commonly used as a conductive salt. Aurbach et al. pointed out the significance of LiNO3 (lithium nitrate) as an electrolyte additive [205,210-215] to build up a both relatively stable and flexible SEI on the lithium anode that suppresses the polysulfide shuttle. However, LiNO3 is progressively consumed during cycling and decomposes at the cathode at potentials below 1.6 V [215]. Increasing the conductive salt concentration might alleviate the polysulfide shuttle due to increased viscosity and salting-out effects as stated by Suo et al. [216]. In their work on “solvent-in-salt” electrolytes, an electrolyte with 7 M LiTFSI was found to suppress both polysulfide dissolution and dendrite growth. On the other hand, an increased viscosity generally opposes fast kinetics. Recently, Cuisinier et al. reported on a new “binary” electrolyte comprising a solvent–salt complex (acetonitrile(CAN)2–LiTFSI) and hydrofluoroether (HFE) that provide minimum solubility of polysulfides [217]. Hence, a different electrochemical behavior occurs, still forming polysulfide intermediates but suppressing parasitic disproportionation, enabling an earlier Li2S formation. Based on the weak Lewis acidity or basicity of ionic liquids (ILs) the solubility of PS is limited as well [218]. Drawbacks of ILs are their high viscosity and therefore lower conductivity resulting in low active mass utilization. The combination with lower viscosity solvents such as DME should be favorable [219] but at the cost of increased polysulfide dissolution. Beyond liquid electrolytes, polymer electrolytes are also used in Li/S8 cells that show favorable properties with respect to polysulfide blocking but yet suffer from low ionic conductivity [140,191,213,220]. Despite intense research efforts, the ideal electrolyte has not been identified yet. The possible cure could be to combine a fast conducting liquid electrolyte with a solid lithium-ion-selective separator or solid electrolyte membrane separating both electrodes, thus relying on reliably protected lithium anodes (PLAs) [221,222].
3.2.1.3 Anodes: As the reduction of sulfur occurs at potentials below 2.5 V vs Li/Li+, lithium metal is the preferred choice as negative electrode in order to achieve reasonable cell voltages. Moreover, the high theoretical capacity of lithium (3860 mAh/g) is a good match with the high capacity of sulfur (1672 mAhg−1). The well-known drawbacks of lithium electrodes (chemical reactivity and dendrite formation) are tried to be minimized by an ex situ applied protection layer or the in situ formed solid electrolyte interphase (SEI) as noted in the previous section. Both in situ and ex situ have to accommodate the changes in volume and morphology during cycling without fracture [223]. To obtain artificial protection layers (artificial SEI), polymer films [224] and inorganic solid electrolytes [221,222] have been applied on the Lithium metal surface. More common is the use of electrolyte additives to favor the formation of a stable SEI, as first published by Aurbach et al. [210,225] referring to LiNO3. More recently P2S5 was suggested as promising additive: A passivating layer mainly consisting of Li3PS4 with rather high ionic conductivity is formed throughout the reaction of P2S5 with Li2Sx[226]. The SEI formation in situ results from the reaction of lithium with the electrolyte components. Therefore, a fraction of the anode material is irreversibly lost and has to be provided as excess. An alternative route to suppress dendrite growth was suggested by Ding et al. [227]. Here, selected cations (Cs+ and Rb+) are added that shield emerging lithium dendrites from further Li+ access, thus enabling a smoother lithium deposition.
The interest in non-lithium anodes such as Si [189] and Sn [190] has been growing, but these – apart of being pre-lithiated [228] – can only be combined with Li2S composite cathodes. Due to the severe volumetric expansion exceeding 300% from Si to Li15Si4, Si in anodes can only provide stable cycling behavior when being nanosized [229]. Beyond, the theoretical energy density of Li–Si/S8 cells is reduced to 1862.45 Wh/kg (3299.25 Wh/L) and to 922.84 Wh/kg (2628.19 Wh/L) for Li–Sn/S8 cells, respectively, due to the additional weight and the reduced cell voltage. Also high capacity carbon materials have been studied [230]. The supposed advantages of these anode materials over lithium are improved safety and possibly increased cycle life. But whether this can outweigh the lower energy densities and the disadvantages arising from the decreased cell voltage remains to be clarified.
3.2.1.4 Analytics: Despite the fact that the Li/S8 cell has been investigated for a long time, a complete understanding of the redox chemistry and all the electrochemical and chemical processes has still not been achieved. This is foremost due to two reasons: (a) In contrast to the rocking chair LIB, the cell chemistry of Li/S8 cells is very complicated, and the reduction of the S8 molecule to Li2S requires the transfer of 16 electrons. (b) As the processes are particularly sensitive to – for example – the electrolyte composition, often different studies are hardly comparable [124,231,232]. Only recently, in situ methods have been applied to achieve a more realistic overview on the real cell reactions.
X-ray diffraction is generally a powerful tool to analyze cell reactions in situ [127,233,234] and has been applied to follow the crystalline solid phases appearing during cell cycling. Unfortunately, some discrepancies still remain: The final discharge product Li2S is not detected (to be crystalline) in some works ex situ [235] and in situ [233] while others show evidence ex situ [236] and in situ [127,234]. Furthermore, the re-oxidation to orthorhombic sulfur is detected by some groups [233] via XRD, while others see evidence for a different allotrope [127,234] or contradict the formation of elemental sulfur from polysulfides [236-239] at all. One of the most recent studies of in situ XRD is shown in Figure 21 (right), detecting formation of crystalline Li2S at the beginning of the 2nd discharge step and precipitation of monoclinic β-sulfur at the end of the charge step. Other methods are necessary to study the soluble polysulfide intermediates. Barchasz et al. proposed a possible mechanism for sulfur reduction in Li/S8 batteries by combining high performance liquid chromatography (HPLC), UV–vis absorption and electron spin resonance (ESR) [232]. Further UV–vis analysis was carried out by Patel et al. [240]. Cuisinier et al. published a study on sulfur speciation during cycling using K-edge XANES (X-ray absorption near-edge spectroscopy) [241]. They analyzed intermediate species and followed dissolution and precipitation of redox end members during cycling, finally proposing a cell reaction as denoted in Figure 21 (left). Combination of in situ and in operando techniques is a powerful tool to obtain a clearer qualitative understanding of the cell chemistry. However, challenges remain because – as stated before – the redox chemistry highly depends on the electrolyte, making different approaches hardly comparable. To understand the cell chemistry from a theoretical point of view, microkinetic models of the processes with special focus on the polysulfide shuttling were published by Mikhaylik et al. [123] and Kumaresan et al. [126]. Fronczek et al. used a modeling framework based on computational fluid dynamics (CFD) to develop a one-dimensional continuum model of a Li/S8 cell with parameters based on this reference [126] to simulate concentration profiles, voltage and current curves as well as impedance behavior during cycling [231]. Kinetics play a particular role in the Li/S8 battery especially because of the divided appearance of fast reactions in solution and sluggish solid state reactions as shown by transient galvanostatic intermittent titration technique (GITT) studies [124]. Hence, both cycling characteristics and performance are affected by the cycling rate and temperature.
Figure 21:
Operando X-ray absorption near-edge spectroscopy (XANES) measurements (left) during first charge and second discharge at 10C rate. The sulfur species denoted on top represent the proposed charge and discharge mechanism based on the measurements. Figure adapted with permission from [241], copyright 2013 American Chemical Society. In situ XRD patterns (right) during discharge and charge at 20C rate with corresponding voltage profiles (left). The * indicates packaging contribution to the patterns, red and blue lines indicate crystalline phases of sulfur and Li2S, respectively. Figure adapted with permission from [127], copyright 2013 The Royal Society of Chemistry.
Figure 21:
Operando X-ray absorption near-edge spectroscopy (XANES) measurements (left) during first charge an...
3.2.1.5 Alternative cell concepts: As the cell chemistry of Li/S8 cells is very different from conventional LIBs, it is also worth considering alternative cell concepts. Negative effects arising from the shuttle effect can be obviated by separating both electrodes with an additional membrane that conducts lithium ions only. This way, polysulfides cannot reach the lithium electrode as suggested by Visco et al, for example [242]. A range of different membranes has recently been tested: lithium ion-exchanged Nafion [243], Nafion-coated polymeric separator [244], Al2O3-coated [244] and V2O5-coated [245] separators, and a commercial glass ceramic from Ohara Inc. [185,246]. Manthiram et al. introduced different electronically conductive interlayers between cathode and separator to absorb and reactivate dissolved polysulfides [152]. Obviously, the extra weight and extra resistance of a membrane or layer decreases energy density and rate capability, respectively. However, with the current state-of-the-art, it might be the only reliable cure to the shuttle effect apart from designing an all solid state sulfur battery. This latter attempt may imply new challenges, including (1) low ionic conductivity of solid electrolytes compared to liquid electrolytes for most solid Li-ion conductors, (2) stability of the interface SE/Li-anode and (3) sluggish interfacial kinetics at both electrodes. Additionally, as the ionic contact of the active mass is no longer provided by the liquid electrolyte, a reasonable fraction of finely dispersed ion conductor has to be introduced into the cathode architecture. This leads to a further decrease in energy density. However, with solid electrolytes approaching conductivities that are on par with liquid electrolytes, that is, members of the thio-LISICON (Li Super Ionic Conductor) and Li2S–P2S5 families [247-252], all-solid-state lithium–sulfur batteries might be an attractive option. Moreover, avoiding flammable liquid electrolytes would be an important advantage with respect to battery safety.
3.2.2 The sodium–sulfur (Na/S8) battery: The large amount of research publications on lithium–sulfur batteries is in stark contrast to what has been reported on the cell chemistry of the analogue sodium system. Altogether only a few publications on the room temperature cell chemistry of sodium–sulfur batteries are currently available but – similarly to the Na/O2 battery – the majority appeared within the last two years. An overview of the available literature is shown in form of a timeline (Figure 22).
Figure 22:
Literature timeline of research papers on room temperature Na/S8 batteries (ranked after date of acceptance). Experimental studies: all journal publications in which full discharge–charge capacity profiles were shown for at least one complete cycle. The paper by Yu et al. [253] describes a related concept based on a catholyte.
Figure 22:
Literature timeline of research papers on room temperature Na/S8 batteries (ranked after date of ac...
Assuming an ideal discharge process, that is, considering thermodynamically stable solids only, sulfur is subsequently reduced to form different polysulfides (Na2Sx, x = 2, 4, 5) and finally the end product Na2S. The theoretical cell potentials of the different steps can be calculated from the corresponding thermodynamic data (no data was found for Na2S5):
(5)(6)(7)(8)
The weighted average voltage of the different steps equals the standard cell potential of the overall reaction. In cells with liquid electrolytes, the reaction path is of course more complex, as, similarly to the Li/S8 cell, the phase behavior becomes much more complex as many polysulfides are highly soluble and metastable phases exist. Na2S2 and Na2S, however, are the least soluble compounds in organic solvents so a solid state reaction as stated in Equation 7 is expected at the calculated potential.
Before providing an overview of the current literature it is worth noting beforehand that the overall understanding of the cell chemistry is poor and quite different results have been reported with respect to sulfur utilization and cycle life. This is probably also due to the fact that the experimental conditions were very different (Table 4).
Table 4:
Cathode- and electrolyte-compositions as well as discharge capacities of all sodium–sulfur cells with an elemental sodium anode that are found in the literature.
The first recent report on room temperature sodium–sulfur batteries was published by Park et al. [254] who prepared a cell using a PVDF/tetraglyme-based gel polymer electrolyte with sodium triflate (NaCF3SO3) as conductive salt (σ = 5.1 ∙ 10–4 S/cm at 25 °C). The discharge profile was characterized by two plateaus separated by a sloping potential region, indicative for a stepwise reduction of sulfur over polysulfides. The first discharge capacity was 489 mAh/g and a rapid capacity fading was observed for the subsequent cycles. The authors concluded that a mixture of Na2S2 and Na2S3 has been formed during discharge and some sulfur remained inactive. Similar results were obtained for a PEO-based polymer electrolyte but at 90 °C [264]. Later on, the same group (Kim et al. [256]) studied the cell with gel polymer electrolyte in more detail. Again, a similar behavior was found with a capacity of 392 mAh/g for the first discharge followed by a rapid capacity decay. Moreover, the impedance of the cell increased during cell storage which was attributed to the growth of a passivation layer between sodium anode and the gel polymer electrolyte.
Wang et al. [255] reported on a Na/S8 cell with liquid electrolyte (NaClO4 in EC:DMC) with a high capacity of 1455 mAh/g (or 655 mAh/gcathode) and stable cycling over 20 cycles. The cathode material was prepared by heat treating a mixture of PAN and sulfur under inert atmosphere [176]. The sulfur induced the cyclization of the PAN polymer forming H2S. The resulting composite consisted of heterocyclic structures and it was suggested that excess sulfur was finely dispersed and eventually covalently bonded to the carbon. The enhanced interaction between sulfur and carbon might explain the high sulfur utilization and stability, at the same time it might be the reason for the unexpected shape of the voltage profile and the lower average cell voltage. No further characterization of the discharge or charge products was provided.
In 2011, Ryu et al. [257] studied the performance of Na/S8 cells in a liquid ether based electrolyte (NaCF3SO3 in tetraglyme). Again, the discharge profile and capacity (538 mAh/g) were comparable to what the same group reported for the cell with gel polymer electrolyte. The voltage profile is shown in Figure 23. In order to provide further insight into the cell reaction, electrodes at different states of discharge and charge (points (a) to (e)) were characterized by differential scanning calorimetry (DSC) (Figure 3b). As several Na2Sx polysulfides are thermodynamically stable, their presence in the electrode might be confirmed over their melting points, as shown in the phase diagram in Figure 16b. Notably, this is not possible for the Li/S8 cell as Li2S is the only stable compound with a defined melting point. The DSC curves indicate that the elemental sulfur disappears during discharge (signal at 114 °C disappears) and sodium polysulfides Na2S4 and Na2S5 form (signals 303 °C and 321 °C appear). After full discharge, these polysulfides are absent. After charging, the melting points of sulfur and Na2S5 reappear. Combined with results from XRD the authors concluded that Na2Sn (4 > n ≥ 2) forms during discharge and sulfur and Na2Sn (5 > n ≥ 3) during charge. The ideal discharge product, Na2S, was not detected.
Figure 23:
(a) First discharge–charge curve of a Na/S8 battery with liquid electrolyte at room temperature and analysis points of sulfur electrode such as (a) pristine, (b) discharged to 50 mAh/g sulfur in sloping region, (c) discharged to 200 mAh/g sulfur in plateau region, (d) fully discharged to 1.2 V and (e) fully charged to 2.3 V. (b) DSC curves of the sulfur electrode with various cut-off voltage conditions as shown in (a). Figure adapted with permission from [257], copyright 2011 Elsevier.
Figure 23:
(a) First discharge–charge curve of a Na/S8 battery with liquid electrolyte at room temperature and...
Lee et al. [258] studied the performance of a sodium–sulfur battery with the same ether-based electrolyte (NaCF3SO3 in tetraglyme), but using a cathode based on a composite of hollow carbon spheres and sulfur. The cell showed a high initial discharge capacity (1200 mAh/g with a low voltage cut-off at 0.5 V) with the following 20 cycles achieving around 600 mAh/g. At the same time, the discharge potential was only around 1 V (see Figure 24a). No further characterization on the discharge products was provided. In another configuration, the sodium anode was replaced by a Na–Sn–C composite electrode and so presented the first room temperature sodium-ion sulfur battery.
Figure 24:
(a) Voltage profiles a of Na/S8 cells with a TEGDME-based electrolyte and a nanostructured carbon/sulfur composite as cathode. Figure adapted with permission from [258], copyright 2013 The Royal Society of Chemistry. (b) Voltage profiles of a Na/S8 cell with DOL:DME-based electrolyte and a cathode based on commercial materials. (c) XPS spectra of the sulfur electrode after discharge. (d) Comparison ov voltage profiles recorded at a rate of 10C for Na/S8 cells with or without solid electrolyte. Figure adapted with permission from [259], copyright 2013 Elsevier.
Figure 24:
(a) Voltage profiles a of Na/S8 cells with a TEGDME-based electrolyte and a nanostructured carbon/s...
Wenzel et al. [259] studied cells with an ether based electrolyte. Similarly to the results from Ryu et al., an initital discharge capacity of around 450 mAh/g and poor cycle life was found (see Figure 24b). Both the sodium anode and the sulfur cathode were studied by XPS. It was shown for the first time that – although sulfur reduction was incomplete – the ideal discharge product Na2S formed during discharge and disappeared during charging (see Figure 24c). At the same time, a large amount of polysulfides and Na2S was found on the sodium anode, indicating a very strong shuttle mechanism – in line what can be expected from Li/S8 cells. To prevent this shuttle mechanism, an additional inorganic solid electrolyte membrane (beta-alumina) was implemented. With this hybrid electrolyte system, Coulombic efficencies close to 100% were found and somewhat higher capacities could be achieved during cycling. More importantly, cycling at a reasonable rate of 0.1C was still possible meaning that the solid electrolyte did not significantly increase the cell resistance (Figure 24d). This is different from Li/S8 cells, where so far only poor kinetics were found for cells with free standing solid electrolyte membranes. We note that the availability of commercially available sodium-ion conducting solid electrolytes with good transport properties in the bulk and through the interfaces with liquid electrolytes offers additional opportunities in designing catholyte based cells. Nevertheless the cells still suffered from strong fading which was finally attributed to the decomposition of the PVDF binder in the presence of polysulfides.
Hwang et al. [260] followed the approach by Wang et al. and produced a composite based on heat treating a mixture of PAN and sulfur; however, PAN nanofibers instead of powder were used. Also here, a carbonate based electrolyte was used (NaClO4 in EC:DMC). The cell showed a first discharge capacity of 800 mAh/g and an excellent an cycle life. On the other hand, the sulfur loading was quite small (0.31–0.38 mg/cm2). In line with the results by Wang et al., the voltage profile shows an overall sloping behavior and partially low voltages. The authors further showed that the sodium anode was free of sulfur after 500 cycles. This means that polysulfide diffusion from the cathode to the anode can be effectively suppressed by chemically binding sulfur to carbon.
Xin et al. [261] studied the performance of a nanostructured composite consisting of CNTs covered with a microporous layer. The material was designed to alter the reaction mechanism in a beneficial way and had been tested for Li/S8 cells by the same group in an earlier study [169]. The idea is that the confinement of nanopores only allows the formation of small compounds, thus, the formation of large S8 molecules and large, highly soluble polysulfides is prevented. As a result, the cell reaction is restricted to small S2−4 molecules and Li2S only, thus improving cycle life and rate capabitlity. The concept also leads to improvements in case of Na/S8 cells. An initial discharge capacity of about 1610 mAh/g was found, followed by stable cycling at 1000 mAh/g. Also here, a carbonate-based electrolyte was employed (1 M NaClO4 in PC:EC) and the voltage shifts to low values (more than half of the capacity is achieved at voltages below 1.5 V).
Bauer et al. [262] used a polymer membrane to reduce the shuttle mechanism in Na/S8 cells with ether-based electrolyte (NaClO4 in TEGDME). The membrane was prepared by coating a standard polypropylene separator with Nafion. The initial discharge capacity was around 400 mAh/g, which is similar to what other groups obtained when using ether based electrolytes.
Zheng et al. [263] studied the performance of composite materials containing a high surface area mesoporous carbon, sulfur and copper nanoparticles. The copper nanoparticles were added in order to trap soluble polysulfides by CuSx formation [263] and a carbonate-based electrolyte was applied (NaClO4 in EC:DMC). The first discharge mainly occurs at very low voltage platetau of around 1.0 V and reaches almost 1000 mAh/g. After this activation cycle, stable capacities of around 600 mAh/g are achieved for more than 100 cycles, with Coulombic efficiencies close to 100% and sloping potential curves. Also here, the average voltage values during discharge remain relatively small to what would be ideally expected for the formation of Na2S. On the downside, the sulfur loading of the electrode is very small. Although the copper content of the electrodes is small (10%), the cycling behavior shows quite some similarity to a conventional conversion between sodium and CuSx for which an activation cycle and sloping potentials are well known. Ideally, the conversion reaction of sodium with CuS and Cu2S would occur at 1.58 V and 1.39 V, respectively [10].
Yu et al. [253] suggested that the often observed capacity fade in Na/S8 cells is due to the poor reversibility of the insoluble discharge products Na2Sn (1 ≤ n < 4). Therefore the group used a cell design optimized for shallow cycling between sulfur and soluble long chain polysulfides with the overall reaction nS + 2 Na+ + 2 e– = Na2Sn (4 ≤ n ≤ 8) (see Figure 25). Essentially, this approach is close to a catholyte concept. Evidence for the cell reaction was provided by XPS and UV–vis measurements. A comparable approach was successfully applied in Li/S8 cells before by the same group [265,266]. Shuttling of the highly soluble, long polysulfides towards the sodium anode was delayed by implementing an additional nanostructured carbon interlayer (thickness not reported) and using a concentrated electrolyte including NaNO3 (1.5 M NaClO4 and 0.3 M NaNO3 in TEGDME). LiNO3 is a well-known anti-shuttling agent in Li/S8 cells that protects the lithium anode. Overall, very stable cycling of the cell at 250 mAh/g was achieved for 50 cycles. The average discharge voltage during galvanostatic cycling was around 2.25 V, however, charging curves were not shown so it remains unclear whether the shuttle effect could be prevented.
Figure 25:
Room temperature sodium–sulfur battery based on shallow cycling between sulfur and soluble long chain polysulfides. An additional interlayer is used to reduce diffusion of polysulfides towards the sodium anode. Figure adapted with permission from [253], copyright 2014 American Chemical Society.
Figure 25:
Room temperature sodium–sulfur battery based on shallow cycling between sulfur and soluble long cha...
Overall comparison: In order to compare the different experimental results on Na/S8 cells, we digitalized literature data of the first galvanostatic cycle (if available) and plotted them into one diagram (see Figure 26). More data is summarized in Table 4. Obviously some noticeable differences exist.
Figure 26:
Literature overview on different studies of Na/S8 cells with liquid electrolyte operating at room temperature. The comparison shows the first cycle. The data was digitalized from the different publications. (a) Cells with ether-based electrolytes. (b) Cells with carbonate-based electrolytes. The dotted line indicates the lowest cell voltage possible assuming bulk thermodynamics for the solid state reaction from Na2S2 to Na2S. This reaction theoretically accounts for 836 mAh/g.
Figure 26:
Literature overview on different studies of Na/S8 cells with liquid electrolyte operating at room t...
Results for cells can be grouped according to their voltage profiles as follows:
Studies using solvents that are frequently used in Li/S8 cells (DOL:DME, tetraglyme) found a discharge behavior that is qualitatively quite similar to what is known from Li/S8 cells, that is, one or two plateaus occur at voltages not too far away from the overall expected cell potential (1.85 V). Charging occurs at slightly larger overpotentials compared the Li/S8 cell. The main difference, however, is that the achieved capacities are very low. Although it was shown that the theoretical end product Na2S forms during discharge, the reaction is incomplete and only about 350–550 mAh/g are found corresponding to an overall composition of Na2Sx (3 ≤ x ≤ 5). So solvents that work well for Li/S8 cells seem to perform bad in Na/S8 cells. A notable exception is the work from Lee et al. [258] who used tetraglyme and found a capacity of 1200 mAh/g. But here, discharge mainly occurs at voltages close to 1 V only (cut-off potential of 0.5 V).
Studies with carbonate based solvents showed much higher capacities and often also superior cycle life. In one study, the capacity was even close to the theoretical value. At the same time, the voltage profiles of these cells are very different from Li/S8 cells and usually exhibit sloping potentials during subsequent cycling and much of the capacity is obtained at voltages below 1.5 V. Such low voltages are also undesired with respect to energy density. One could argue that also the conductive salt might have an influence, however, one can conclude from results obtained for Li/S8 cells that this is less likely [205].
Assuming bulk thermodynamics, it is interesting to note that the lowest cell voltage possible is due to the reaction Equation 7:
for which E° = 1.68 V can be calculated (see above). This reaction contributes to half of the theoretical capacity of sulfur (836 mAh/g). During discharge, the cell voltage should therefore fall below this value at some point which is fulfilled for all results shown in Figure 26. During charge, one should immediately exceed this voltage; however, this is not always the case. It seems that cells with high discharge capacity partially charge below this thermodynamically derived threshold. Assuming that the thermodynamic data is correct, one has to conclude that other reactions take place. In some cases, this unexpected voltage profile might be due to sulfur bound covalently to carbon [255,260] or due to CuSx[255] formation, however, a clear understanding is missing. Taking these results together, many questions remain and further studies are needed to clarify the link between voltage profile, cycle life, sulfur utilization, and electrolyte composition. As it is well known from Li/S8 cells that carbonate based electrolytes are unstable against polysulfides [205,267], future studies should clarify whether side reactions contribute to the high capacities reported for some Na/S8 cells.
Moreover, all studies reporting capacities exceeding 1000 mAh/g were only achieved with small sulfur loadings meaning that the sulfur content of the electrode was considerably smaller than 50 wt %. In line with research on Li/S8 batteries one has to emphasize the need to increase this value in case an application should become feasible. Given the very early state of research, however, the overall perspective for Na/S8 cells is yet unclear, and further work is required to better judge the practical potential.
Conclusion
Lithium–sulfur and lithium–oxygen cells have attracted enormous interest in the last ten years, and the frequency of publications is still increasing. In the case of Li–sulfur batteries the major challenges have been obvious already at the very beginning (e.g., lithium dendrites, polysulfide shuttle) but still await a proper and effective solution. While incremental improvements can be recognized, it is unclear whether the Li–sulfur battery can finally beat LIB technology with respect to energy capacity. It is interesting to note that the majority of papers deals with the design of carbon/sulfur papers rather than targeting the critical issue of the anode.
In the case of lithium–oxygen batteries the current status is different. After an initial phase of enthusiasm major drawbacks (electrolyte decomposition, carbon instability, the need for pure oxygen) have damped too optimistic expectations, and Li/O2 batteries are now again primarily the target of academic research.
As both systems rely on multielectron transfer reactions at the cathode, and as solid phases are being formed and dissolved during cycling, the kinetics are slow compared to LIB and the energy efficiency as also the power density are not competitive yet. This may easily lead to a pessimistic outlook, but this would not be an appropriate conclusion. Rather one should consider lithium–sulfur and lithium–oxygen batteries as attractive targets which have already triggered numerous valuable technical and chemical innovations – but which still require major innovations in electrolyte and electrode design.
In contrast, (room temperature) sodium–sulfur and sodium–oxygen cells have only very recently attracted interest. Obviously, the lower theoretical energy capacity makes sodium-based systems second choice at first glance. On the other hand, sodium systems can provide some specific advantages that might help to overcome the obstacles known from the analogue lithium based cells. Several aspects have been discussed in this review. The availability of Na beta-alumina as highly conductive room temperature solid electrolyte that is also chemically stable in contact with sodium might be an important advantage for designing future cell concepts, for example. Moreover, sodium has the advantage to be much more abundant than lithium.
An intriguing example was also shown for the Na/O2 cell, where formation of NaO2 as discharge product offers significant advantages compared to the Li/O2 cell with respect to energy efficiency and reversibility. Comparing results on metal–oxygen batteries is generally difficult as research groups usually use different cell designs, materials and measurement conditions. However, the shape of voltage profile (voltage hysteresis) gives a first impression on the cell performance with respect to reversibility and efficiency. We therefore suggest using a simple 3 × 3 matrix that allows quick assessment of the overall performance of metal–oxygen cells. The ideal voltage profile corresponds to Type 1A which is not found for any of the metal–oxygen cell yet. Most close to this behavior are Na/O2 cells with NaO2 as discharge product and are classified as Type 1B. Most other metal–oxygen cells show a Type 2C/3B or Type 3C behavior. Still, very little is known about the cell chemistry of sodium–oxygen cells and it is surprising that different groups find different discharge products. Giving a reasonable explanation for this is an important research task.
Even less is known about the cell chemistry of room-temperature Na/S8 cells. The research overview showed that (with one exception), the voltage profile seems to depend on the electrolyte composition. In ether based electrolytes, the voltage profile shows similarity to what is known from Li/S8 cells. But although Na2S forms as discharge product, only low capacities and poor cycle life is achieved. The situation is different when carbonate based electrolytes are used. Much higher capacities and improved cycle life have been reported. On the other hand, the voltage profiles are much less defined and carbonates might be simply instable against polysulfides as it is known from Li/S8 cells. Clearly, there is a need to further understand the cell reaction. At the current state, Na/S8 cells are not competitive with Li/S8 cells.
In conclusion, given the relatively early state of research, (room temperature) sodium–sulfur and sodium–oxygen cells already show some attractive properties and the recent increase in research activity is a clear sign for the development of two new independent research fields. At the same time, we emphasize that just as for the analogue lithium-based systems, the road towards practical systems is long and might not necessarily lead to application – in particular in view of the energy densities which may finally not beat the LIB. Aiming for low cost stationary energy stores seems most attractive, especially considering the Na/S8 system. Progress towards practical devices will be only achieved when challenges of all cell components, that is, anode, cathode and electrolyte, are addressed and side reactions are minimized. Moreover, understanding the of role impurities on the cell reactions need further attention. Innovative approaches in both fundamental research and technical development are therefore needed.
Acknowledgements
The authors are grateful to the Federal state of Hessen (ElCh infrastructure support, LOEWE program STORE-E) and the Funds of the Chemical Industry (FCI) for financial support. Long term support and invaluable discussions within the International Network for Electrochemistry and Batteries of BASF SE (Ludwigshafen) are also gratefully acknowledged.
References
Zaghib, K.; Mauger, A.; Groult, H.; Goodenough, J. B.; Julien, C. M. Materials2013,6, 1028–1049. doi:10.3390/ma6031028
Return to citation in text:
[1]
Cabana, J.; Monconduit, L.; Larcher, D.; Rosa Palacin, M. Adv. Mater.2010,22, E170–E192. doi:10.1002/adma.201000717
Return to citation in text:
[1]
Kubota, K.; Yabuuchi, N.; Yoshida, H.; Dahbi, M.; Komaba, S. MRS Bull.2014,39, 416–422. doi:10.1557/mrs.2014.85
Return to citation in text:
[1]
[2]
Dahbi, M.; Yabuuchi, N.; Kubota, K.; Tokiwa, K.; Komaba, S. Phys. Chem. Chem. Phys.2014,16, 15007–15028. doi:10.1039/C4CP00826J
Return to citation in text:
[1]
Ellis, B. L.; Nazar, L. F. Curr. Opin. Solid State Mater. Sci.2012,16, 168–177. doi:10.1016/j.cossms.2012.04.002
Return to citation in text:
[1]
Kim, S.-W.; Seo, D.-H.; Ma, X.; Ceder, G.; Kang, K. Adv. Energy Mater.2012,2, 710–721. doi:10.1002/aenm.201200026
Return to citation in text:
[1]
Palomares, V.; Serras, P.; Villaluenga, I.; Hueso, K. B.; Carretero-González, J.; Rojo, T. Energy Environ. Sci.2012,5, 5884–5901. doi:10.1039/c2ee02781j
Return to citation in text:
[1]
Pan, H. L.; Hu, Y. S.; Chen, L. Q. Energy Environ. Sci.2013,6, 2338–2360. doi:10.1039/c3ee40847g
Return to citation in text:
[1]
Slater, M. D.; Kim, D.; Lee, E.; Johnson, C. S. Adv. Funct. Mater.2013,23, 947–958. doi:10.1002/adfm.201200691
Return to citation in text:
[1]
[2]
Klein, F.; Jache, B.; Bhide, A.; Adelhelm, P. Phys. Chem. Chem. Phys.2013,15, 15876–15887. doi:10.1039/c3cp52125g
Return to citation in text:
[1]
[2]
[3]
Holleman, A.; Wiberg, N. Lehrbuch der Anorganischen Chemie, 102nd ed.; De Gruyter: Berlin, 2007.
Return to citation in text:
[1]
Wen, Z.; Cao, J.; Gu, Z.; Xu, X.; Zhang, F.; Lin, Z. Solid State Ionics2008,179, 1697–1701. doi:10.1016/j.ssi.2008.01.070
Return to citation in text:
[1]
Akhil, A. A.; Boyes, J. D.; Bulter, P. C.; Doughty, D. H. Batteries for electrical energy storage applications. In Linden’s Handbook of Batteries, 4th ed.; Reddy, T. B., Ed.; McGraw-Hill: New York, 2011.
Return to citation in text:
[1]
Hueso, K. B.; Armand, M.; Rojo, T. Energy Environ. Sci.2013,6, 734–749. doi:10.1039/c3ee24086j
Return to citation in text:
[1]
Hartmann, P.; Leichtweiss, T.; Busche, M. R.; Schneider, M.; Reich, M.; Sann, J.; Adelhelm, P.; Janek, J. J. Phys. Chem. C2013,117, 21064–21074. doi:10.1021/jp4051275
Return to citation in text:
[1]
Eufinger, J.-P.; Schmidt, A.; Lerch, M.; Janek, J. Phys. Chem. Chem. Phys.2015,17, 6844–6857. doi:10.1039/C4CP05442C
Return to citation in text:
[1]
Sangster, J.; Pelton, A. D. J. Phase Equilib.1992,13, 296–299. doi:10.1007/BF02667558
Return to citation in text:
[1]
Wriedt, H. A. Bull. Alloy Phase Diagrams1987,8, 234–246. doi:10.1007/BF02874915
Return to citation in text:
[1]
Ren, X.; Wu, Y. J. Am. Chem. Soc.2013,135, 2923–2926. doi:10.1021/ja312059q
Return to citation in text:
[1]
[2]
Ren, X.; Lau, K. C.; Yu, M.; Bi, X.; Kreidler, E.; Curtiss, L. A.; Wu, Y. ACS Appl. Mater. Interfaces2014,6, 19299–19307. doi:10.1021/am505351s
Return to citation in text:
[1]
Girishkumar, G.; McCloskey, B.; Luntz, A. C.; Swanson, S.; Wilcke, W. J. Phys. Chem. Lett.2010,1, 2193–2203. doi:10.1021/jz1005384
Return to citation in text:
[1]
[2]
[3]
Christensen, J.; Albertus, P.; Sanchez-Carrera, R. S.; Lohmann, T.; Kozinsky, B.; Liedtke, R.; Ahmed, J.; Kojic, A. J. Electrochem. Soc.2012,159, R1–R30. doi:10.1149/2.086202jes
Return to citation in text:
[1]
[2]
Visco, S. J.; Nimon, V. Y.; Petrov, A.; Pridatko, K.; Goncharenko, N.; Nimon, E.; De Jonghe, L.; Volfkovich, Y. M.; Bograchev, D. A. J. Solid State Electrochem.2014,18, 1443–1456. doi:10.1007/s10008-014-2427-x
Return to citation in text:
[1]
[2]
Gallagher, K. G.; Goebel, S.; Greszler, T.; Mathias, M.; Oelerich, W.; Eroglu, D.; Srinivasan, V. Energy Environ. Sci.2014,7, 1555–1563. doi:10.1039/c3ee43870h
Return to citation in text:
[1]
Peled, E.; Golodnitsky, D.; Mazor, H.; Goor, M.; Avshalomov, S. J. Power Sources2011,196, 6835–6840. doi:10.1016/j.jpowsour.2010.09.104
Return to citation in text:
[1]
[2]
[3]
[4]
Bender, C. L.; Hartmann, P.; Vračar, M.; Adelhelm, P.; Janek, J. Adv. Energy Mater.2014,4, 1301863. doi:10.1002/aenm.201301863
Return to citation in text:
[1]
[2]
[3]
[4]
[5]
Lyall, A. E. U.S. Patent US3625769, Dec 7, 1971.
Return to citation in text:
[1]
Abraham, K. M.; Jiang, Z. J. Electrochem. Soc.1996,143, 1–5. doi:10.1149/1.1836378
Return to citation in text:
[1]
Read, J. J. Electrochem. Soc.2002,149, A1190–A1195. doi:10.1149/1.1498256
Return to citation in text:
[1]
[2]
[3]
Débart, A.; Paterson, A. J.; Bao, J.; Bruce, P. G. Angew. Chem., Int. Ed. Engl.2008,47, 4521–4524. doi:10.1002/anie.200705648
Return to citation in text:
[1]
[2]
Lu, Y.-C.; Gallant, B. M.; Kwabi, D. G.; Harding, J. R.; Mitchell, R. R.; Whittingham, M. S.; Shao-Horn, Y. Energy Environ. Sci.2013,6, 750–768. doi:10.1039/c3ee23966g
Return to citation in text:
[1]
[2]
Garcia-Araez, N.; Novák, P. J. Solid State Electrochem.2013,17, 1793–1807. doi:10.1007/s10008-013-1999-1
Return to citation in text:
[1]
Débart, A.; Bao, J.; Armstrong, G.; Bruce, P. G. J. Power Sources2007,174, 1177–1182. doi:10.1016/j.jpowsour.2007.06.180
Return to citation in text:
[1]
Jin, L.; Xu, L.; Morein, C.; Chen, C.-H.; Lai, M.; Dharmarathna, S.; Dobley, A.; Suib, S. L. Adv. Funct. Mater.2010,20, 3373–3382. doi:10.1002/adfm.201001080
Return to citation in text:
[1]
Ominde, N.; Bartlett, N.; Yang, X.-Q.; Qu, D. J. Power Sources2008,185, 747–753. doi:10.1016/j.jpowsour.2008.07.065
Return to citation in text:
[1]
Zhang, G. Q.; Zheng, J. P.; Liang, R.; Zhang, C.; Wang, B.; Au, M.; Hendrickson, M.; Plichta, E. J. J. Electrochem. Soc.2011,158, A822. doi:10.1149/1.3590736
Return to citation in text:
[1]
Lu, Y.-C.; Xu, Z.; Gasteiger, H. A.; Chen, S.; Hamad-Schifferli, K.; Shao-Horn, Y. J. Am. Chem. Soc.2010,132, 12170–12171. doi:10.1021/ja1036572
Return to citation in text:
[1]
Cheng, H.; Scott, K. Appl. Catal., B: Environ.2011,108–109, 140–151. doi:10.1016/j.apcatb.2011.08.021
Return to citation in text:
[1]
Lu, J.; Lei, Y.; Lau, K. C.; Luo, X.; Du, P.; Wen, J.; Assary, R. S.; Das, U.; Miller, D. J.; Elam, J. W.; Albishri, H. M.; El-Hady, D. A.; Sun, Y.-K.; Curtiss, L. A.; Amine, K. Nat. Commun.2013,4, 2383. doi:10.1038/ncomms3383
Return to citation in text:
[1]
[2]
McCloskey, B. D.; Scheffler, R.; Speidel, A.; Bethune, D. S.; Shelby, R. M.; Luntz, A. C. J. Am. Chem. Soc.2011,133, 18038–18041. doi:10.1021/ja207229n
Return to citation in text:
[1]
[2]
[3]
[4]
Xu, K. Chem. Rev.2004,104, 4303–4417. doi:10.1021/cr030203g
Return to citation in text:
[1]
Mizuno, F.; Nakanishi, S.; Kotani, Y.; Yokoishi, S.; Iba, H. Electrochemistry2010,78, 403–405. doi:10.5796/electrochemistry.78.403
Return to citation in text:
[1]
Freunberger, S. A.; Chen, Y.; Peng, Z.; Griffin, J. M.; Hardwick, L. J.; Bardé, F.; Novák, P.; Bruce, P. G. J. Am. Chem. Soc.2011,133, 8040–8047. doi:10.1021/ja2021747
Return to citation in text:
[1]
McCloskey, B. D.; Bethune, D. S.; Shelby, R. M.; Girishkumar, G.; Luntz, A. C. J. Phys. Chem. Lett.2011,2, 1161–1166. doi:10.1021/jz200352v
Return to citation in text:
[1]
[2]
[3]
Veith, G. M.; Dudney, N. J.; Howe, J.; Nanda, J. J. Phys. Chem. C2011,115, 14325–14333. doi:10.1021/jp2043015
Return to citation in text:
[1]
[2]
Xu, W.; Viswanathan, V. V.; Wang, D.; Towne, S. A.; Xiao, J.; Nie, Z.; Hu, D.; Zhang, J.-G. J. Power Sources2011,196, 3894–3899. doi:10.1016/j.jpowsour.2010.12.065
Return to citation in text:
[1]
Bryantsev, V. S.; Giordani, V.; Walker, W.; Blanco, M.; Zecevic, S.; Sasaki, K.; Uddin, J.; Addison, D.; Chase, G. V. J. Phys. Chem. A2011,115, 12399–12409. doi:10.1021/jp2073914
Return to citation in text:
[1]
Laino, T.; Curioni, A. Chemistry2012,18, 3510–3520. doi:10.1002/chem.201103057
Return to citation in text:
[1]
Hyoung Oh, S.; Yim, T.; Pomerantseva, E.; Nazar, L. F. Electrochem. Solid-State Lett.2011,14, A185–A188. doi:10.1149/2.003112esl
Return to citation in text:
[1]
Chalasani, D.; Lucht, B. L. ECS Electrochem. Lett.2012,1, A38–A42. doi:10.1149/2.010202eel
Return to citation in text:
[1]
Veith, G. M.; Nanda, J.; Delmau, L. H.; Dudney, N. J. J. Phys. Chem. Lett.2012,3, 1242–1247. doi:10.1021/jz300430s
Return to citation in text:
[1]
Aurbach, D.; Daroux, M.; Faguy, P.; Yeager, E. J. Electroanal. Chem.1991,297, 225–244. doi:10.1016/0022-0728(91)85370-5
Return to citation in text:
[1]
Mizuno, F.; Takechi, K.; Higashi, S.; Shiga, T.; Shiotsuki, T.; Takazawa, N.; Sakurabayashi, Y.; Okazaki, S.; Nitta, I.; Kodama, T.; Nakamoto, H.; Nishikoori, H.; Nakanishi, S.; Kotani, Y.; Iba, H. J. Power Sources2013,228, 47–56. doi:10.1016/j.jpowsour.2012.11.077
Return to citation in text:
[1]
Cecchetto, L.; Salomon, M.; Scrosati, B.; Croce, F. J. Power Sources2012,213, 233–238. doi:10.1016/j.jpowsour.2012.04.038
Return to citation in text:
[1]
Allen, C. J.; Mukerjee, S.; Plichta, E. J.; Hendrickson, M. A.; Abraham, K. M. J. Phys. Chem. Lett.2011,2, 2420–2424. doi:10.1021/jz201070t
Return to citation in text:
[1]
Xu, D.; Wang, Z.-L.; Xu, J.-J.; Zhang, L.-L.; Zhang, X.-B. Chem. Commun.2012,48, 6948–6950. doi:10.1039/c2cc32844e
Return to citation in text:
[1]
Trahan, M. J.; Mukerjee, S.; Plichta, E. J.; Hendrickson, M. A.; Abraham, K. M. J. Electrochem. Soc.2012,160, A259–A267. doi:10.1149/2.048302jes
Return to citation in text:
[1]
Chen, Y.; Freunberger, S. A.; Peng, Z.; Bardé, F.; Bruce, P. G. J. Am. Chem. Soc.2012,134, 7952–7957. doi:10.1021/ja302178w
Return to citation in text:
[1]
[2]
[3]
Giordani, V.; Walker, W.; Bryantsev, V. S.; Uddin, J.; Chase, G. V.; Addison, D. J. Electrochem. Soc.2013,160, A1544–A1550. doi:10.1149/2.097309jes
Return to citation in text:
[1]
[2]
Wang, H.; Liao, X.-Z.; Li, L.; Chen, H.; Jiang, Q.-Z.; He, Y.-S.; Ma, Z.-F. J. Electrochem. Soc.2012,159, A1874–A1879. doi:10.1149/2.012212jes
Return to citation in text:
[1]
[2]
Zhang, Z.; Lu, J.; Assary, R. S.; Du, P.; Wang, H.-H.; Sun, Y.-K.; Qin, Y.; Lau, K. C.; Greeley, J.; Redfern, P. C.; Iddir, H.; Curtiss, L. A.; Amine, K. J. Phys. Chem. C2011,115, 25535–25542. doi:10.1021/Jp2087412
Return to citation in text:
[1]
Sharon, D.; Etacheri, V.; Garsuch, A.; Afri, M.; Frimer, A. A.; Aurbach, D. J. Phys. Chem. Lett.2013,4, 127–131. doi:10.1021/jz3017842
Return to citation in text:
[1]
Meini, S.; Tsiouvaras, N.; Schwenke, K. U.; Piana, M.; Beyer, H.; Lange, L.; Gasteiger, H. A. Phys. Chem. Chem. Phys.2013,15, 11478–11493. doi:10.1039/c3cp51112j
Return to citation in text:
[1]
[2]
McCloskey, B. D.; Garcia, J. M.; Luntz, A. C. J. Phys. Chem. Lett.2014,5, 1230–1235. doi:10.1021/jz500494s
Return to citation in text:
[1]
[2]
[3]
[4]
McCloskey, B. D.; Bethune, D. S.; Shelby, R. M.; Mori, T.; Scheffler, R.; Speidel, A.; Sherwood, M.; Luntz, A. C. J. Phys. Chem. Lett.2012,3, 3043–3047. doi:10.1021/jz301359t
Return to citation in text:
[1]
[2]
Freunberger, S. A.; Chen, Y.; Drewett, N. E.; Hardwick, L. J.; Bardé, F.; Bruce, P. G. Angew. Chem., Int. Ed. Engl.2011,50, 8609–8613. doi:10.1002/anie.201102357
Return to citation in text:
[1]
Adams, B. D.; Black, R.; Williams, Z.; Fernandes, R.; Cuisinier, M.; Berg, E. J.; Novak, P.; Murphy, G. K.; Nazar, L. F. Adv. Energy Mater.2015,5, 1400867. doi:10.1002/aenm.201400867
Return to citation in text:
[1]
Kang, S. J.; Mori, T.; Narizuka, S.; Wilcke, W.; Kim, H. C. Nat. Commun.2014,5, 3937. doi:10.1038/ncomms4937
Return to citation in text:
[1]
Xu, W.; Xu, K.; Viswanathan, V. V.; Towne, S. A.; Hardy, J. S.; Xiao, J.; Nie, Z.; Hu, D.; Wang, D.; Zhang, J.-G. J. Power Sources2011,196, 9631–9639. doi:10.1016/j.jpowsour.2011.06.099
Return to citation in text:
[1]
Walker, W.; Giordani, V.; Uddin, J.; Bryantsev, V. S.; Chase, G. V.; Addison, D. J. Am. Chem. Soc.2013,135, 2076–2079. doi:10.1021/ja311518s
Return to citation in text:
[1]
Tsiouvaras, N.; Meini, S.; Buchberger, I.; Gasteiger, H. A. J. Electrochem. Soc.2013,160, A471–A477. doi:10.1149/2.042303jes
Return to citation in text:
[1]
[2]
Novák, P.; Panitz, J.-C.; Joho, F.; Lanz, M.; Imhof, R.; Coluccia, M. J. Power Sources2000,90, 52–58. doi:10.1016/S0378-7753(00)00447-X
Return to citation in text:
[1]
Barile, C. J.; Gewirth, A. A. J. Electrochem. Soc.2013,160, A549–A552. doi:10.1149/2.033304jes
Return to citation in text:
[1]
Armstrong, A. R.; Holzapfel, M.; Novák, P.; Johnson, C. S.; Kang, S.-H.; Thackeray, M. M.; Bruce, P. G. J. Am. Chem. Soc.2006,128, 8694–8698. doi:10.1021/ja062027+
Return to citation in text:
[1]
Hartmann, P.; Bender, C. L.; Sann, J.; Dürr, A. K.; Jansen, M.; Janek, J.; Adelhelm, P. Phys. Chem. Chem. Phys.2013,15, 11661–11672. doi:10.1039/c3cp50930c
Return to citation in text:
[1]
[2]
[3]
[4]
McCloskey, B. D.; Valery, A.; Luntz, A. C.; Gowda, S. R.; Wallraff, G. M.; Garcia, J. M.; Mori, T.; Krupp, L. E. J. Phys. Chem. Lett.2013,4, 2989–2993. doi:10.1021/jz401659f
Return to citation in text:
[1]
Hase, Y.; Ito, E.; Shiga, T.; Mizuno, F.; Nishikoori, H.; Iba, H.; Takechi, K. Chem. Commun.2013,49, 8389–8391. doi:10.1039/c3cc44723e
Return to citation in text:
[1]
Black, R.; Oh, S. H.; Lee, J.-H.; Yim, T.; Adams, B.; Nazar, L. F. J. Am. Chem. Soc.2012,134, 2902–2905. doi:10.1021/ja2111543
Return to citation in text:
[1]
McCloskey, B. D.; Speidel, A.; Scheffler, R.; Miller, D. C.; Viswanathan, V.; Hummelshøj, J. S.; Nørskov, J. K.; Luntz, A. C. J. Phys. Chem. Lett.2012,3, 997–1001. doi:10.1021/jz300243r
Return to citation in text:
[1]
Ottakam Thotiyl, M. M.; Freunberger, S. A.; Peng, Z.; Bruce, P. G. J. Am. Chem. Soc.2013,135, 494–500. doi:10.1021/ja310258x
Return to citation in text:
[1]
[2]
Ottakam Thotiyl, M. M.; Freunberger, S. A.; Peng, Z.; Chen, Y.; Liu, Z.; Bruce, P. G. Nat. Mater.2013,12, 1050–1056. doi:10.1038/nmat3737
Return to citation in text:
[1]
Younesi, R.; Norby, P.; Vegge, T. ECS Electrochem. Lett.2014,3, A15–A18. doi:10.1149/2.001403eel
Return to citation in text:
[1]
Sharon, D.; Afri, M.; Noked, M.; Garsuch, A.; Frimer, A. A.; Aurbach, D. J. Phys. Chem. Lett.2013,4, 3115–3119. doi:10.1021/Jz4017188
Return to citation in text:
[1]
Adams, B. D.; Radtke, C.; Black, R.; Trudeau, M. L.; Zaghib, K.; Nazar, L. F. Energy Environ. Sci.2013,6, 1772–1778. doi:10.1039/c3ee40697k
Return to citation in text:
[1]
Radin, M. D.; Siegel, D. J. Energy Environ. Sci.2013,6, 2370–2379. doi:10.1039/c3ee41632a
Return to citation in text:
[1]
Radin, M. D.; Rodriguez, J. F.; Tian, F.; Siegel, D. J. J. Am. Chem. Soc.2012,134, 1093–1103. doi:10.1021/ja208944x
Return to citation in text:
[1]
Garcia-Lastra, J. M.; Myrdal, J. S. G.; Christensen, R.; Thygesen, K. S.; Vegge, T. J. Phys. Chem. C2013,117, 5568–5577. doi:10.1021/jp3107809
Return to citation in text:
[1]
Gerbig, O.; Merkle, R.; Maier, J. Adv. Mater.2013,25, 3129–3133. doi:10.1002/adma.201300264
Return to citation in text:
[1]
Viswanathan, V.; Thygesen, K. S.; Hummelshøj, J. S.; Nørskov, J. K.; Girishkumar, G.; McCloskey, B. D.; Luntz, A. C. J. Chem. Phys.2011,135, 214704. doi:10.1063/1.3663385
Return to citation in text:
[1]
Luntz, A. C.; Viswanathan, V.; Voss, J.; Varley, J. B.; Nørskov, J. K.; Scheffler, R.; Speidel, A. J. Phys. Chem. Lett.2013,4, 3494–3499. doi:10.1021/jz401926f
Return to citation in text:
[1]
Aetukuri, N. B.; McCloskey, B. D.; Garcia, J. M.; Krupp, L. E.; Viswanathan, V.; Luntz, A. C. arXiv [cond-mat.mtrl-sci]2014, No. 1406.3335.
Return to citation in text:
[1]
Chase, G. V.; Zecevic, S.; Walker, W.; Uddin, J.; Sasaki, K. A.; Giordani, V.; Bryantsev, V. S.; Blanco, M.; Addison, D. U.S. Patent US2011/033821, Oct 27, 2011.
Return to citation in text:
[1]
Chen, Y.; Freunberger, S. A.; Peng, Z.; Fontaine, O.; Bruce, P. G. Nat. Chem.2013,5, 489–494. doi:10.1038/nchem.1646
Return to citation in text:
[1]
Lim, H.-D.; Song, H.; Kim, J.; Gwon, H.; Bae, Y.; Park, K.-Y.; Hong, J.; Kim, H.; Kim, T.; Kim, Y. H.; Lepró, X.; Ovalle-Robles, R.; Baughman, R. H.; Kang, K. Angew. Chem.2014,126, 4007–4012. doi:10.1002/ange.201400711
Return to citation in text:
[1]
[2]
Bergner, B. J.; Schürmann, A.; Peppler, K.; Garsuch, A.; Janek, J. J. Am. Chem. Soc.2014,136, 15054–15064. doi:10.1021/ja508400m
Return to citation in text:
[1]
[2]
Lopez, N.; Graham, D. J.; McGuire, R., Jr.; Alliger, G. E.; Shao-Horn, Y.; Cummins, C. C.; Nocera, D. G. Science2012,335, 450–453. doi:10.1126/science.1212678
Return to citation in text:
[1]
Kim, J.; Lim, H.-D.; Gwon, H.; Kang, K. Phys. Chem. Chem. Phys.2013,15, 3623–3629. doi:10.1039/c3cp43225d
Return to citation in text:
[1]
[2]
Jian, Z.; Chen, Y.; Li, F.; Zhang, T.; Liu, C.; Zhou, H. J. Power Sources2014,251, 466–469. doi:10.1016/j.jpowsour.2013.11.091
Return to citation in text:
[1]
[2]
Yadegari, H.; Li, Y.; Norouzi Banis, M.; Li, X.; Wang, B.; Sun, Q.; Li, R.; Sham, T.-K.; Cui, X.; Sun, X. Energy Environ. Sci.2014,7, 3747–3757. doi:10.1039/c4ee01654h
Return to citation in text:
[1]
[2]
Hartmann, P.; Bender, C. L.; Vračar, M.; Dürr, A. K.; Garsuch, A.; Janek, J.; Adelhelm, P. Nat. Mater.2013,12, 228–232. doi:10.1038/nmat3486
Return to citation in text:
[1]
[2]
[3]
Hartmann, P.; Grübl, D.; Sommer, H.; Janek, J.; Bessler, W. G.; Adelhelm, P. J. Phys. Chem. C2014,118, 1461–1471. doi:10.1021/jp4099478
Return to citation in text:
[1]
[2]
Zhao, N.; Li, C.; Guo, X. Phys. Chem. Chem. Phys.2014,16, 15646–15652. doi:10.1039/c4cp01961j
Return to citation in text:
[1]
[2]
[3]
Das, S. K.; Lau, S.; Archer, L. A. J. Mater. Chem. A2014,2, 12623–12629. doi:10.1039/c4ta02176b
Return to citation in text:
[1]
Ha, S.; Kim, J.-K.; Choi, A.; Kim, Y.; Lee, K. T. ChemPhysChem2014,15, 1971–1982. doi:10.1002/cphc.201402215
Return to citation in text:
[1]
Peled, E.; Golodnitsky, D.; Hadar, R.; Mazor, H.; Goor, M.; Burstein, L. J. Power Sources2013,244, 771–776. doi:10.1016/j.jpowsour.2013.01.177
Return to citation in text:
[1]
Lee, B.; Seo, D.-H.; Lim, H.-D.; Park, I.; Park, K.-Y.; Kim, J.; Kang, K. Chem. Mater.2014,26, 1048–1055. doi:10.1021/cm403163c
Return to citation in text:
[1]
Kang, S.; Mo, Y.; Ong, S. P.; Ceder, G. Nano Lett.2014,14, 1016–1020. doi:10.1021/nl404557w
Return to citation in text:
[1]
Stephanou, S. E.; Schechter, W. H.; Argersinger, W. J.; Kleinberg, J. J. Am. Chem. Soc.1949,71, 1819–1821. doi:10.1021/ja01173a083
Return to citation in text:
[1]
Xu, S.; Lu, Y.; Wang, H.; Abruña, H. D.; Archer, L. A. J. Mater. Chem. A2014,2, 17723–17729. doi:10.1039/c4ta04130e
Return to citation in text:
[1]
Hayashi, K.; Shima, K.; Sugiyama, F. J. Electrochem. Soc.2013,160, A1467–A1472. doi:10.1149/2.067309jes
Return to citation in text:
[1]
Rao, M. L. B. U.S. Patent US3413154 A, Nov 26, 1968.
Return to citation in text:
[1]
Rauh, R. D.; Abraham, K. M.; Pearson, G. F.; Surprenant, J. K.; Brummer, S. B. J. Electrochem. Soc.1979,126, 523–527. doi:10.1149/1.2129079
Return to citation in text:
[1]
[2]
[3]
Mikhaylik, Y. V.; Akridge, J. R. J. Electrochem. Soc.2004,151, A1969–A1976. doi:10.1149/1.1806394
Return to citation in text:
[1]
[2]
[3]
[4]
Busche, M. R.; Adelhelm, P.; Sommer, H.; Schneider, H.; Leitner, K.; Janek, J. J. Power Sources2014,259, 289–299. doi:10.1016/j.jpowsour.2014.02.075
Return to citation in text:
[1]
[2]
[3]
[4]
[5]
Raiß, C.; Peppler, K.; Janek, J.; Adelhelm, P. Carbon2014,79, 245–255. doi:10.1016/j.carbon.2014.07.065
Return to citation in text:
[1]
[2]
Kumaresan, K.; Mikhaylik, Y.; White, R. E. J. Electrochem. Soc.2008,155, A576–A582. doi:10.1149/1.2937304
Return to citation in text:
[1]
[2]
[3]
Waluś, S.; Barchasz, C.; Colin, J.-F.; Martin, J.-F.; Elkaïm, E.; Leprêtre, J.-C.; Alloin, F. Chem. Commun.2013,49, 7899–7901. doi:10.1039/c3cc43766c
Return to citation in text:
[1]
[2]
[3]
[4]
[5]
[6]
Schneider, H.; Gollub, C.; Weiss, T.; Kulisch, J.; Leitner, K.; Schmidt, R.; Safont-Sempere, M. M.; Mikhaylik, Y.; Kelley, T.; Scordilis-Kelley, C.; Laramie, M.; Du, H. J. Electrochem. Soc.2014,161, A1399–A1406. doi:10.1149/2.0991409jes
Return to citation in text:
[1]
Okamoto, H. J. Phase Equilib.1995,16, 94–97. doi:10.1007/bf02646258
Return to citation in text:
[1]
Sangster, J.; Pelton, A. D. J. Phase Equilib.1997,18, 89–96. doi:10.1007/bf02646762
Return to citation in text:
[1]
[2]
Kulisch, J.; Sommer, H.; Brezesinski, T.; Janek, J. Phys. Chem. Chem. Phys.2014,16, 18765–18771. doi:10.1039/C4CP02220C
Return to citation in text:
[1]
[2]
Huang, J. P.; Yuan, D. D.; Zhang, H. Z.; Cao, Y. L.; Li, G. R.; Yang, H. X.; Gao, X. P. RSC Adv.2013,3, 12593–12597. doi:10.1039/c3ra42413h
Return to citation in text:
[1]
Brückner, J.; Thieme, S.; Grossmann, H. T.; Dörfler, S.; Althues, H.; Kaskel, S. J. Power Sources2014,268, 82–87. doi:10.1016/j.jpowsour.2014.05.143
Return to citation in text:
[1]
Doughty, D. H. Rechargeable Lithium Metal Batteries (Ambient Temperature). In Linden’s Handbook of Batteries, 4th ed.; Reddy, T. B., Ed.; McGraw-Hill: New York, 2011.
Return to citation in text:
[1]
Gordon, J.; Watkins, J. U.S. Patent US 20100239893 A1, Sept 23, 2010.
Return to citation in text:
[1]
Lu, X.; Kirby, B. W.; Xu, W.; Li, G.; Kim, J. Y.; Lemmon, J. P.; Sprenkle, V. L.; Yang, Z. Energy Environ. Sci.2013,6, 299–306. doi:10.1039/C2EE23606K
Return to citation in text:
[1]
Lu, X.; Li, G.; Kim, J. Y.; Mei, D.; Lemmon, J. P.; Sprenkle, V. L.; Liu, J. Nat. Commun.2014,5, 4578. doi:10.1038/ncomms5578
Return to citation in text:
[1]
Weddigen, G. J. Electrochem. Soc.1980,127, 1225–1227. doi:10.1149/1.2129860
Return to citation in text:
[1]
Ji, X.; Nazar, L. F. J. Mater. Chem.2010,20, 9821–9826. doi:10.1039/b925751a
Return to citation in text:
[1]
Etacheri, V.; Marom, R.; Elazari, R.; Salitra, G.; Aurbach, D. Energy Environ. Sci.2011,4, 3243–3262. doi:10.1039/c1ee01598b
Return to citation in text:
[1]
Barghamadi, M.; Kapoor, A.; Wen, C. J. Electrochem. Soc.2013,160, A1256–A1263. doi:10.1149/2.096308jes
Return to citation in text:
[1]
Manthiram, A.; Fu, Y.; Chung, S.-H.; Zu, C.; Su, Y.-S. Chem. Rev.2014,114, 11751–11787. doi:10.1021/cr500062v
Return to citation in text:
[1]
[2]
Wang, J.; Liu, L.; Ling, Z.; Yang, J.; Wan, C.; Jiang, C. Electrochim. Acta2003,48, 1861–1867. doi:10.1016/S0013-4686(03)00258-5
Return to citation in text:
[1]
Jayaprakash, N.; Shen, J.; Moganty, S. S.; Corona, A.; Archer, L. A. Angew. Chem.2011,123, 6026–6030. doi:10.1002/ange.201100637
Return to citation in text:
[1]
[2]
Cheon, S.-E.; Cho, J.-H.; Ko, K.-S.; Kwon, C.-W.; Chang, D.-R.; Kim, H.-T.; Kim, S.-W. J. Electrochem. Soc.2002,149, A1437–A1441. doi:10.1149/1.1511187
Return to citation in text:
[1]
Lacey, M. J.; Jeschull, F.; Edström, K.; Brandell, D. Chem. Commun.2013,49, 8531–8533. doi:10.1039/c3cc44772c
Return to citation in text:
[1]
Sun, J.; Huang, Y.; Wang, W.; Yu, Z.; Wang, A.; Yuan, K. Electrochim. Acta2008,53, 7084–7088. doi:10.1016/j.electacta.2008.05.022
Return to citation in text:
[1]
[2]
Wang, Q.; Wang, W.; Huang, Y.; Wang, F.; Zhang, H.; Yu, Z.; Wang, A.; Yuan, K. J. Electrochem. Soc.2011,158, A775–A779. doi:10.1149/1.3583375
Return to citation in text:
[1]
He, M.; Yuan, L.-X.; Zhang, W.-X.; Hu, X.-L.; Huang, Y.-H. J. Phys. Chem. C2011,115, 15703–15709. doi:10.1021/jp2043416
Return to citation in text:
[1]
Wang, J. L.; Yang, J.; Xie, J. Y.; Xu, N. X.; Li, Y. Electrochem. Commun.2002,4, 499–502. doi:10.1016/S1388-2481(02)00358-2
Return to citation in text:
[1]
Zhang, B.; Qin, X.; Li, G. R.; Gao, X. P. Energy Environ. Sci.2010,3, 1531–1537. doi:10.1039/c002639e
Return to citation in text:
[1]
[2]
Ye, H.; Yin, Y.-X.; Xin, S.; Guo, Y.-G. J. Mater. Chem. A2013,1, 6602–6608. doi:10.1039/c3ta10735c
Return to citation in text:
[1]
Greenwood, N. N.; Earnshaw, A. Chemistry of the Elements; Elsevier Science: Oxford, 1997.
Return to citation in text:
[1]
Xin, S.; Gu, L.; Zhao, N.-H.; Yin, Y.-X.; Zhou, L.-J.; Guo, Y.-G.; Wan, L.-J. J. Am. Chem. Soc.2012,134, 18510–18513. doi:10.1021/ja308170k
Return to citation in text:
[1]
[2]
[3]
Elazari, R.; Salitra, G.; Garsuch, A.; Panchenko, A.; Aurbach, D. Adv. Mater.2011,23, 5641–5644. doi:10.1002/adma.201103274
Return to citation in text:
[1]
[2]
[3]
[4]
Li, X.; Cao, Y.; Qi, W.; Saraf, L. V.; Xiao, J.; Nie, Z.; Mietek, J.; Zhang, J.-G.; Schwenzer, B.; Liu, J. J. Mater. Chem.2011,21, 16603–16610. doi:10.1039/C1JM12979A
Return to citation in text:
[1]
Ryu, H. S.; Park, J. W.; Park, J.; Ahn, J.-P.; Kim, K.-W.; Ahn, J.-H.; Nam, T.-H.; Wang, G.; Ahn, H.-J. J. Mater. Chem. A2013,1, 1573–1578. doi:10.1039/C2TA00056C
Return to citation in text:
[1]
Guo, J.; Xu, Y.; Wang, C. Nano Lett.2011,11, 4288–4294. doi:10.1021/nl202297p
Return to citation in text:
[1]
Zheng, G.; Yang, Y.; Cha, J. J.; Hong, S. S.; Cui, Y. Nano Lett.2011,11, 4462–4467. doi:10.1021/nl2027684
Return to citation in text:
[1]
Tachikawa, N.; Yamauchi, K.; Takashima, E.; Park, J.-W.; Dokko, K.; Watanabe, M. Chem. Commun.2011,47, 8157–8159. doi:10.1039/c1cc12415c
Return to citation in text:
[1]
Wang, H.; Yang, Y.; Liang, Y.; Robinson, J. T.; Li, Y.; Jackson, A.; Cui, Y.; Dai, H. Nano Lett.2011,11, 2644–2647. doi:10.1021/nl200658a
Return to citation in text:
[1]
Dörfler, S.; Hagen, M.; Althues, H.; Tübke, J.; Kaskel, S.; Hoffmann, M. J. Chem. Commun.2012,48, 4097–4099. doi:10.1039/c2cc17925c
Return to citation in text:
[1]
[2]
[3]
[4]
Hagen, M.; Dörfler, S.; Althues, H.; Tübke, J.; Hoffmann, M. J.; Kaskel, S.; Pinkwart, K. J. Power Sources2012,213, 239–248. doi:10.1016/j.jpowsour.2012.04.004
Return to citation in text:
[1]
Zhou, G.; Wang, D.-W.; Li, F.; Hou, P.-X.; Yin, L.; Liu, C.; Lu, G. Q. M.; Gentle, I. R.; Cheng, H.-M. Energy Environ. Sci.2012,5, 8901–8906. doi:10.1039/c2ee22294a
Return to citation in text:
[1]
[2]
Su, Y.-S.; Fu, Y.; Manthiram, A. Phys. Chem. Chem. Phys.2012,14, 14495–14499. doi:10.1039/c2cp42796f
Return to citation in text:
[1]
Yang, Y.; McDowell, M. T.; Jackson, A.; Cha, J. J.; Hong, S. S.; Cui, Y. Nano Lett.2010,10, 1486–1491. doi:10.1021/nl100504q
Return to citation in text:
[1]
[2]
[3]
[4]
[5]
Hassoun, J.; Scrosati, B. Angew. Chem., Int. Ed.2010,49, 2371–2374. doi:10.1002/anie.200907324
Return to citation in text:
[1]
[2]
Hassoun, J.; Kim, J.; Lee, D.-J.; Jung, H.-G.; Lee, S.-M.; Sun, Y.-K.; Scrosati, B. J. Power Sources2012,202, 308–313. doi:10.1016/j.jpowsour.2011.11.060
Return to citation in text:
[1]
[2]
Whittingham, S. U.S. Patent US4009052 A, Feb 22, 1977.
Return to citation in text:
[1]
Yang, Y.; Zheng, G.; Misra, S.; Nelson, J.; Toney, M.; Cui, Y. J. Am. Chem. Soc.2012,134, 15387–15394. doi:10.1021/ja3052206
Return to citation in text:
[1]
Cai, K.; Song, M.-K.; Cairns, E. J.; Zhang, Y. Nano Lett.2012,12, 6474–6479. doi:10.1021/nl303965a
Return to citation in text:
[1]
Zheng, S.; Chen, Y.; Xu, Y.; Yi, F.; Zhu, Y.; Liu, Y.; Yang, J.; Wang, C. ACS Nano2013,7, 10995–11003. doi:10.1021/nn404601h
Return to citation in text:
[1]
Yang, Z.; Guo, J.; Das, S. K.; Yu, Y.; Zhou, Z.; Abruña, H. D.; Archer, L. A. J. Mater. Chem. A2013,1, 1433–1440. doi:10.1039/C2TA00779G
Return to citation in text:
[1]
Guo, J.; Yang, Z.; Yu, Y.; Abruña, H. D.; Archer, L. A. J. Am. Chem. Soc.2012,135, 763–767. doi:10.1021/ja309435f
Return to citation in text:
[1]
Lin, Z.; Liu, Z.; Dudney, N. J.; Liang, C. ACS Nano2013,7, 2829–2833. doi:10.1021/nn400391h
Return to citation in text:
[1]
Chang, D.-R.; Lee, S.-H.; Kim, S.-W.; Kim, H.-T. J. Power Sources2002,112, 452–460. doi:10.1016/S0378-7753(02)00418-4
Return to citation in text:
[1]
[2]
[3]
Wang, W.; Wang, Y.; Huang, Y.; Huang, C.; Yu, Z.; Zhang, H.; Wang, A.; Yuan, K. J. Appl. Electrochem.2010,40, 321–325. doi:10.1007/s10800-009-9978-z
Return to citation in text:
[1]
Peled, E.; Sternberg, Y.; Gorenshtein, A.; Lavi, Y. J. Electrochem. Soc.1989,136, 1621–1625. doi:10.1149/1.2096981
Return to citation in text:
[1]
Shim, J.; Striebel, K. A.; Cairns, E. J. J. Electrochem. Soc.2002,149, A1321–A1325. doi:10.1149/1.1503076
Return to citation in text:
[1]
Gao, J.; Lowe, M. A.; Kiya, Y.; Abruña, H. D. J. Phys. Chem. C2011,115, 25132–25137. doi:10.1021/jp207714c
Return to citation in text:
[1]
[2]
[3]
[4]
[5]
Barchasz, C.; Leprêtre, J.-C.; Patoux, S.; Alloin, F. Electrochim. Acta2013,89, 737–743. doi:10.1016/j.electacta.2012.11.001
Return to citation in text:
[1]
Mikhaylik, Y. V.; Kovalev, I.; Schock, R.; Kumaresan, K.; Xu, J.; Affinito, J. ECS Trans.2010,25, 23–34. doi:10.1149/1.3414001
Return to citation in text:
[1]
Aurbach, D.; Pollak, E.; Elazari, R.; Salitra, G.; Kelley, C. S.; Affinito, J. J. Electrochem. Soc.2009,156, A694–A702. doi:10.1149/1.3148721
Return to citation in text:
[1]
[2]
Xiong, S.; Xie, K.; Diao, Y.; Hong, X. J. Power Sources2014,246, 840–845. doi:10.1016/j.jpowsour.2013.08.041
Return to citation in text:
[1]
Mikhaylik, Y. V. U.S. Patent US 7354680 B2, April 8, 2008; pp 1–18.
Return to citation in text:
[1]
Liang, X.; Wen, Z.; Liu, Y.; Zhang, H.; Huang, L.; Jin, J. J. Power Sources2011,196, 3655–3658. doi:10.1016/j.jpowsour.2010.12.052
Return to citation in text:
[1]
[2]
Gorkovenko, A. U.S. Patent US 7316868 B2, Jan 8, 2008.
Return to citation in text:
[1]
Suo, L.; Hu, Y.-S.; Li, H.; Armand, M.; Chen, L. Nat. Commun.2013,4, 1481. doi:10.1038/ncomms2513
Return to citation in text:
[1]
Cuisinier, M.; Cabelguen, P.-E.; Adams, B. D.; Garsuch, A.; Balasubramanian, M.; Nazar, L. F. Energy Environ. Sci.2014,7, 2697–2705. doi:10.1039/C4ee00372a
Return to citation in text:
[1]
Park, J.-W.; Yamauchi, K.; Takashima, E.; Tachikawa, N.; Ueno, K.; Dokko, K.; Watanabe, M. J. Phys. Chem. C2013,117, 4431–4440. doi:10.1021/jp400153m
Return to citation in text:
[1]
Marmorstein, D.; Yu, T. H.; Striebel, K. A.; McLarnon, F. R.; Hou, J.; Cairns, E. J. J. Power Sources2000,89, 219–226. doi:10.1016/S0378-7753(00)00432-8
Return to citation in text:
[1]
Visco, S.; Nimon, Y. Aqueous electrolyte lithium sulfur batteries. US Pat. 8,828,575 B2, Sept 9, 2014.
Return to citation in text:
[1]
[2]
Visco, S. J.; Nimon, V. Y.; Petrov, A.; Pridatko, K.; Goncharenko, N.; Nimon, E.; De Jonghe, L.; Volfkovich, Y. M.; Bograchev, D. A. J. Solid State Electrochem.2014,18, 1443–1456. doi:10.1007/s10008-014-2427-x
Return to citation in text:
[1]
[2]
Kim, H.; Jeong, G.; Kim, Y.-U.; Kim, J.-H.; Park, C.-M.; Sohn, H.-J. Chem. Soc. Rev.2013,42, 9011–9034. doi:10.1039/C3CS60177C
Return to citation in text:
[1]
Lee, Y. M.; Choi, N.-S.; Park, J. H.; Park, J.-K. J. Power Sources2003,119–121, 964–972. doi:10.1016/S0378-7753(03)00300-8
Return to citation in text:
[1]
Mikhaylik, Y. V. Electrolytes for lithium sulfur cells. U.S. Patent US 8828610 B2, Jan 6, 2004.
Return to citation in text:
[1]
Lin, Z.; Liu, Z.; Fu, W.; Dudney, N. J.; Liang, C. Adv. Funct. Mater.2013,23, 1064–1069. doi:10.1002/adfm.201200696
Return to citation in text:
[1]
Ding, F.; Xu, W.; Graff, G. L.; Zhang, J.; Sushko, M. L.; Chen, X.; Shao, Y.; Engelhard, M. H.; Nie, Z.; Xiao, J.; Liu, X.; Sushko, P. V.; Liu, J.; Zhang, J.-G. J. Am. Chem. Soc.2013,135, 4450–4456. doi:10.1021/ja312241y
Return to citation in text:
[1]
Liu, N.; Hu, L.; McDowell, M. T.; Jackson, A.; Cui, Y. ACS Nano2011,5, 6487–6493. doi:10.1021/nn2017167
Return to citation in text:
[1]
Magasinski, A.; Dixon, P.; Hertzberg, B.; Kvit, A.; Ayala, J.; Yushin, G. Nat. Mater.2010,9, 353–358. doi:10.1038/nmat2725
Return to citation in text:
[1]
Brückner, J.; Thieme, S.; Böttger-Hiller, F.; Bauer, I.; Grossmann, H. T.; Strubel, P.; Althues, H.; Spange, S.; Kaskel, S. Adv. Funct. Mater.2014,24, 1284–1289. doi:10.1002/adfm.201302169
Return to citation in text:
[1]
Barchasz, C.; Molton, F.; Duboc, C.; Leprêtre, J.-C.; Patoux, S.; Alloin, F. Anal. Chem.2012,84, 3973–3980. doi:10.1021/ac2032244
Return to citation in text:
[1]
[2]
Nelson, J.; Misra, S.; Yang, Y.; Jackson, A.; Liu, Y.; Wang, H.; Dai, H.; Andrews, J. C.; Cui, Y.; Toney, M. F. J. Am. Chem. Soc.2012,134, 6337–6343. doi:10.1021/ja2121926
Return to citation in text:
[1]
[2]
[3]
Cañas, N. A.; Wolf, S.; Wagner, N.; Friedrich, K. A. J. Power Sources2013,226, 313–319. doi:10.1016/j.jpowsour.2012.10.092
Return to citation in text:
[1]
[2]
[3]
Ryu, H. S.; Guo, Z.; Ahn, H. J.; Cho, G. B.; Liu, H. J. Power Sources2009,189, 1179–1183. doi:10.1016/j.jpowsour.2008.12.073
Return to citation in text:
[1]
Akridge, J. R.; Mikhaylik, Y. V.; White, N. Solid State Ionics2004,175, 243–245. doi:10.1016/j.ssi.2004.07.070
Return to citation in text:
[1]
Cheon, S.-E.; Ko, K.-S.; Cho, J.-H.; Kim, S.-W.; Chin, E.-Y.; Kim, H.-T. J. Electrochem. Soc.2003,150, A796–A799. doi:10.1149/1.1571532
Return to citation in text:
[1]
Ryu, H.-S.; Ahn, H.-J.; Kim, K.-W.; Ahn, J.-H.; Lee, J.-Y. J. Power Sources2006,153, 360–364. doi:10.1016/j.jpowsour.2005.05.037
Return to citation in text:
[1]
Patel, M. U. M.; Demir-Cakan, R.; Morcrette, M.; Tarascon, J.-M.; Gaberscek, M.; Dominko, R. ChemSusChem2013,6, 1177–1181. doi:10.1002/cssc.201300142
Return to citation in text:
[1]
Cuisinier, M.; Cabelguen, P.-E.; Evers, S.; He, G.; Kolbeck, M.; Garsuch, A.; Bolin, T.; Balasubramanian, M.; Nazar, L. F. J. Phys. Chem. Lett.2013,4, 3227–3232. doi:10.1021/jz401763d
Return to citation in text:
[1]
[2]
Visco, S. J.; Katz, B. D.; Nimon, Y. S.; De Jonghe, L. C. U.S. Patent US 8293398 B2, Oct 23, 2012.
Return to citation in text:
[1]
Jin, Z.; Xie, K.; Hong, X.; Hu, Z.; Liu, X. J. Power Sources2012,218, 163–167. doi:10.1016/j.jpowsour.2012.06.100
Return to citation in text:
[1]
Huang, J.-Q.; Zhang, Q.; Peng, H.-J.; Liu, X.-Y.; Qian, W.-Z.; Wei, F. Energy Environ. Sci.2014,7, 347–353. doi:10.1039/C3EE42223B
Return to citation in text:
[1]
[2]
Li, W.; Hicks-Garner, J.; Wang, J.; Liu, J.; Gross, A. F.; Sherman, E.; Graetz, J.; Vajo, J. J.; Liu, P. Chem. Mater.2014,26, 3403–3410. doi:10.1021/cm500575q
Return to citation in text:
[1]
Vizintin, A.; Patel, M. U. M.; Genorio, B.; Dominko, R. ChemElectroChem2014,1, 1040–1045. doi:10.1002/celc.201402039
Return to citation in text:
[1]
Kobayashi, T.; Imade, Y.; Shishihara, D.; Homma, K.; Nagao, M.; Watanabe, R.; Yokoi, T.; Yamada, A.; Kanno, R.; Tatsumi, T. J. Power Sources2008,182, 621–625. doi:10.1016/j.jpowsour.2008.03.030
Return to citation in text:
[1]
Hayashi, A.; Ohtomo, T.; Mizuno, F.; Tadanaga, K.; Tatsumisago, M. Electrochem. Commun.2003,5, 701–705. doi:10.1016/S1388-2481(03)00167-X
Return to citation in text:
[1]
Kanno, R.; Hata, T.; Kawamoto, Y.; Irie, M. Solid State Ionics2000,130, 97–104. doi:10.1016/S0167-2738(00)00277-0
Return to citation in text:
[1]
Kanno, R.; Murayama, M. J. Electrochem. Soc.2001,148, A742–A746. doi:10.1149/1.1379028
Return to citation in text:
[1]
Seino, Y.; Ota, T.; Takada, K.; Hayashi, A.; Tatsumisago, M. Energy Environ. Sci.2014,7, 627–631. doi:10.1039/c3ee41655k
Return to citation in text:
[1]
Kamaya, N.; Homma, K.; Yamakawa, Y.; Hirayama, M.; Kanno, R.; Yonemura, M.; Kamiyama, T.; Kato, Y.; Hama, S.; Kawamoto, K.; Mitsui, A. Nat. Mater.2011,10, 682–686. doi:10.1038/nmat3066
Return to citation in text:
[1]
Yu, X.; Manthiram, A. J. Phys. Chem. Lett.2014,5, 1943–1947. doi:10.1021/jz500848x
Return to citation in text:
[1]
[2]
[3]
[4]
Park, C.-W.; Ahn, J.-H.; Ryu, H.-S.; Kim, K.-W.; Ahn, H.-J. Electrochem. Solid-State Lett.2006,9, A123–A125. doi:10.1149/1.2164607
Return to citation in text:
[1]
[2]
Wang, J.; Yang, J.; Nuli, Y.; Holze, R. Electrochem. Commun.2007,9, 31–34. doi:10.1016/j.elecom.2006.08.029
Return to citation in text:
[1]
[2]
[3]
[4]
Kim, J.-S.; Ahn, H.-J.; Kim, I.-P.; Kim, K.-W.; Ahn, J.-H.; Park, C.-W.; Ryu, H.-S. J. Solid State Electrochem.2008,12, 861–865. doi:10.1007/s10008-008-0504-8
Return to citation in text:
[1]
[2]
Ryu, H.; Kim, T.; Kim, K.; Ahn, J.-H.; Nam, T.; Wang, G.; Ahn, H.-J. J. Power Sources2011,196, 5186–5190. doi:10.1016/j.jpowsour.2011.01.109
Return to citation in text:
[1]
[2]
[3]
Lee, D.-J.; Park, J.-W.; Hasa, I.; Sun, Y.-K.; Scrosati, B.; Hassoun, J. J. Mater. Chem. A2013,1, 5256–5261. doi:10.1039/c3ta10241f
Return to citation in text:
[1]
[2]
[3]
[4]
Wenzel, S.; Metelmann, H.; Raiß, C.; Dürr, A. K.; Janek, J.; Adelhelm, P. J. Power Sources2013,243, 758–765. doi:10.1016/j.jpowsour.2013.05.194
Return to citation in text:
[1]
[2]
[3]
Hwang, T. H.; Jung, D. S.; Kim, J.-S.; Kim, B. G.; Choi, J. W. Nano Lett.2013,13, 4532–4538. doi:10.1021/nl402513x
Return to citation in text:
[1]
[2]
[3]
Xin, S.; Yin, Y.-X.; Guo, Y.-G.; Wan, L.-J. Adv. Mater.2014,26, 1261–1265. doi:10.1002/adma.201304126
Return to citation in text:
[1]
[2]
Bauer, I.; Kohl, M.; Althues, H.; Kaskel, S. Chem. Commun.2014,50, 3208–3210. doi:10.1039/c4cc00161c
Return to citation in text:
[1]
[2]
Zheng, S.; Han, P.; Han, Z.; Li, P.; Zhang, H.; Yang, J. Adv. Energy Mater.2014,4, 1400226. doi:10.1002/aenm.201400226
Return to citation in text:
[1]
[2]
[3]
Park, C.-W.; Ryu, H.-S.; Kim, K.-W.; Ahn, J.-H.; Lee, J.-Y.; Ahn, H.-J. J. Power Sources2007,165, 450–454. doi:10.1016/j.jpowsour.2006.11.083
Return to citation in text:
[1]
Su, Y.-S.; Manthiram, A. Nat. Commun.2012,3, 1166. doi:10.1038/ncomms2163
Return to citation in text:
[1]
Zu, C.; Su, Y. S.; Fu, Y.; Manthiram, A. Phys. Chem. Chem. Phys.2013,15, 2291–2297. doi:10.1039/c2cp43394j
Return to citation in text:
[1]
Yim, T.; Park, M.-S.; Yu, J.-S.; Kim, K. J.; Im, K. Y.; Kim, J.-H.; Jeong, G.; Jo, Y. N.; Woo, S.-G.; Kang, K. S.; Lee, I.; Kim, Y.-J. Electrochim. Acta2013,107, 454–460. doi:10.1016/j.electacta.2013.06.039
Return to citation in text:
[1]
Hassoun, J.; Kim, J.; Lee, D.-J.; Jung, H.-G.; Lee, S.-M.; Sun, Y.-K.; Scrosati, B. J. Power Sources2012,202, 308–313. doi:10.1016/j.jpowsour.2011.11.060
195.
Cai, K.; Song, M.-K.; Cairns, E. J.; Zhang, Y. Nano Lett.2012,12, 6474–6479. doi:10.1021/nl303965a
Hassoun, J.; Kim, J.; Lee, D.-J.; Jung, H.-G.; Lee, S.-M.; Sun, Y.-K.; Scrosati, B. J. Power Sources2012,202, 308–313. doi:10.1016/j.jpowsour.2011.11.060
McCloskey, B. D.; Speidel, A.; Scheffler, R.; Miller, D. C.; Viswanathan, V.; Hummelshøj, J. S.; Nørskov, J. K.; Luntz, A. C. J. Phys. Chem. Lett.2012,3, 997–1001. doi:10.1021/jz300243r
McCloskey, B. D.; Garcia, J. M.; Luntz, A. C. J. Phys. Chem. Lett.2014,5, 1230–1235. doi:10.1021/jz500494s
78.
Hartmann, P.; Bender, C. L.; Sann, J.; Dürr, A. K.; Jansen, M.; Janek, J.; Adelhelm, P. Phys. Chem. Chem. Phys.2013,15, 11661–11672. doi:10.1039/c3cp50930c
79.
McCloskey, B. D.; Valery, A.; Luntz, A. C.; Gowda, S. R.; Wallraff, G. M.; Garcia, J. M.; Mori, T.; Krupp, L. E. J. Phys. Chem. Lett.2013,4, 2989–2993. doi:10.1021/jz401659f
Visco, S.; Nimon, Y. Aqueous electrolyte lithium sulfur batteries. US Pat. 8,828,575 B2, Sept 9, 2014.
222.
Visco, S. J.; Nimon, V. Y.; Petrov, A.; Pridatko, K.; Goncharenko, N.; Nimon, E.; De Jonghe, L.; Volfkovich, Y. M.; Bograchev, D. A. J. Solid State Electrochem.2014,18, 1443–1456. doi:10.1007/s10008-014-2427-x
Marmorstein, D.; Yu, T. H.; Striebel, K. A.; McLarnon, F. R.; Hou, J.; Cairns, E. J. J. Power Sources2000,89, 219–226. doi:10.1016/S0378-7753(00)00432-8
Lu, Y.-C.; Gallant, B. M.; Kwabi, D. G.; Harding, J. R.; Mitchell, R. R.; Whittingham, M. S.; Shao-Horn, Y. Energy Environ. Sci.2013,6, 750–768. doi:10.1039/c3ee23966g
87.
Adams, B. D.; Radtke, C.; Black, R.; Trudeau, M. L.; Zaghib, K.; Nazar, L. F. Energy Environ. Sci.2013,6, 1772–1778. doi:10.1039/c3ee40697k
Cuisinier, M.; Cabelguen, P.-E.; Adams, B. D.; Garsuch, A.; Balasubramanian, M.; Nazar, L. F. Energy Environ. Sci.2014,7, 2697–2705. doi:10.1039/C4ee00372a
Chase, G. V.; Zecevic, S.; Walker, W.; Uddin, J.; Sasaki, K. A.; Giordani, V.; Bryantsev, V. S.; Blanco, M.; Addison, D. U.S. Patent US2011/033821, Oct 27, 2011.
Viswanathan, V.; Thygesen, K. S.; Hummelshøj, J. S.; Nørskov, J. K.; Girishkumar, G.; McCloskey, B. D.; Luntz, A. C. J. Chem. Phys.2011,135, 214704. doi:10.1063/1.3663385
93.
Luntz, A. C.; Viswanathan, V.; Voss, J.; Varley, J. B.; Nørskov, J. K.; Scheffler, R.; Speidel, A. J. Phys. Chem. Lett.2013,4, 3494–3499. doi:10.1021/jz401926f
Lim, H.-D.; Song, H.; Kim, J.; Gwon, H.; Bae, Y.; Park, K.-Y.; Hong, J.; Kim, H.; Kim, T.; Kim, Y. H.; Lepró, X.; Ovalle-Robles, R.; Baughman, R. H.; Kang, K. Angew. Chem.2014,126, 4007–4012. doi:10.1002/ange.201400711
Lopez, N.; Graham, D. J.; McGuire, R., Jr.; Alliger, G. E.; Shao-Horn, Y.; Cummins, C. C.; Nocera, D. G. Science2012,335, 450–453. doi:10.1126/science.1212678
Lim, H.-D.; Song, H.; Kim, J.; Gwon, H.; Bae, Y.; Park, K.-Y.; Hong, J.; Kim, H.; Kim, T.; Kim, Y. H.; Lepró, X.; Ovalle-Robles, R.; Baughman, R. H.; Kang, K. Angew. Chem.2014,126, 4007–4012. doi:10.1002/ange.201400711
Doughty, D. H. Rechargeable Lithium Metal Batteries (Ambient Temperature). In Linden’s Handbook of Batteries, 4th ed.; Reddy, T. B., Ed.; McGraw-Hill: New York, 2011.
Kim, J.-S.; Ahn, H.-J.; Kim, I.-P.; Kim, K.-W.; Ahn, J.-H.; Park, C.-W.; Ryu, H.-S. J. Solid State Electrochem.2008,12, 861–865. doi:10.1007/s10008-008-0504-8
Ryu, H. S.; Park, J. W.; Park, J.; Ahn, J.-P.; Kim, K.-W.; Ahn, J.-H.; Nam, T.-H.; Wang, G.; Ahn, H.-J. J. Mater. Chem. A2013,1, 1573–1578. doi:10.1039/C2TA00056C
Gao, J.; Lowe, M. A.; Kiya, Y.; Abruña, H. D. J. Phys. Chem. C2011,115, 25132–25137. doi:10.1021/jp207714c
267.
Yim, T.; Park, M.-S.; Yu, J.-S.; Kim, K. J.; Im, K. Y.; Kim, J.-H.; Jeong, G.; Jo, Y. N.; Woo, S.-G.; Kang, K. S.; Lee, I.; Kim, Y.-J. Electrochim. Acta2013,107, 454–460. doi:10.1016/j.electacta.2013.06.039
Dörfler, S.; Hagen, M.; Althues, H.; Tübke, J.; Kaskel, S.; Hoffmann, M. J. Chem. Commun.2012,48, 4097–4099. doi:10.1039/c2cc17925c
186.
Hagen, M.; Dörfler, S.; Althues, H.; Tübke, J.; Hoffmann, M. J.; Kaskel, S.; Pinkwart, K. J. Power Sources2012,213, 239–248. doi:10.1016/j.jpowsour.2012.04.004
Cuisinier, M.; Cabelguen, P.-E.; Evers, S.; He, G.; Kolbeck, M.; Garsuch, A.; Bolin, T.; Balasubramanian, M.; Nazar, L. F. J. Phys. Chem. Lett.2013,4, 3227–3232. doi:10.1021/jz401763d
Cuisinier, M.; Cabelguen, P.-E.; Evers, S.; He, G.; Kolbeck, M.; Garsuch, A.; Bolin, T.; Balasubramanian, M.; Nazar, L. F. J. Phys. Chem. Lett.2013,4, 3227–3232. doi:10.1021/jz401763d
Kim, J.-S.; Ahn, H.-J.; Kim, I.-P.; Kim, K.-W.; Ahn, J.-H.; Park, C.-W.; Ryu, H.-S. J. Solid State Electrochem.2008,12, 861–865. doi:10.1007/s10008-008-0504-8
Hartmann, P.; Leichtweiss, T.; Busche, M. R.; Schneider, M.; Reich, M.; Sann, J.; Adelhelm, P.; Janek, J. J. Phys. Chem. C2013,117, 21064–21074. doi:10.1021/jp4051275
Wen, Z.; Cao, J.; Gu, Z.; Xu, X.; Zhang, F.; Lin, Z. Solid State Ionics2008,179, 1697–1701. doi:10.1016/j.ssi.2008.01.070
13.
Akhil, A. A.; Boyes, J. D.; Bulter, P. C.; Doughty, D. H. Batteries for electrical energy storage applications. In Linden’s Handbook of Batteries, 4th ed.; Reddy, T. B., Ed.; McGraw-Hill: New York, 2011.
14.
Hueso, K. B.; Armand, M.; Rojo, T. Energy Environ. Sci.2013,6, 734–749. doi:10.1039/c3ee24086j
Schneider, H.; Gollub, C.; Weiss, T.; Kulisch, J.; Leitner, K.; Schmidt, R.; Safont-Sempere, M. M.; Mikhaylik, Y.; Kelley, T.; Scordilis-Kelley, C.; Laramie, M.; Du, H. J. Electrochem. Soc.2014,161, A1399–A1406. doi:10.1149/2.0991409jes
McCloskey, B. D.; Scheffler, R.; Speidel, A.; Bethune, D. S.; Shelby, R. M.; Luntz, A. C. J. Am. Chem. Soc.2011,133, 18038–18041. doi:10.1021/ja207229n
Lu, J.; Lei, Y.; Lau, K. C.; Luo, X.; Du, P.; Wen, J.; Assary, R. S.; Das, U.; Miller, D. J.; Elam, J. W.; Albishri, H. M.; El-Hady, D. A.; Sun, Y.-K.; Curtiss, L. A.; Amine, K. Nat. Commun.2013,4, 2383. doi:10.1038/ncomms3383
McCloskey, B. D.; Scheffler, R.; Speidel, A.; Bethune, D. S.; Shelby, R. M.; Luntz, A. C. J. Am. Chem. Soc.2011,133, 18038–18041. doi:10.1021/ja207229n
Freunberger, S. A.; Chen, Y.; Peng, Z.; Griffin, J. M.; Hardwick, L. J.; Bardé, F.; Novák, P.; Bruce, P. G. J. Am. Chem. Soc.2011,133, 8040–8047. doi:10.1021/ja2021747
46.
McCloskey, B. D.; Bethune, D. S.; Shelby, R. M.; Girishkumar, G.; Luntz, A. C. J. Phys. Chem. Lett.2011,2, 1161–1166. doi:10.1021/jz200352v
47.
Veith, G. M.; Dudney, N. J.; Howe, J.; Nanda, J. J. Phys. Chem. C2011,115, 14325–14333. doi:10.1021/jp2043015
48.
Xu, W.; Viswanathan, V. V.; Wang, D.; Towne, S. A.; Xiao, J.; Nie, Z.; Hu, D.; Zhang, J.-G. J. Power Sources2011,196, 3894–3899. doi:10.1016/j.jpowsour.2010.12.065
Sharon, D.; Etacheri, V.; Garsuch, A.; Afri, M.; Frimer, A. A.; Aurbach, D. J. Phys. Chem. Lett.2013,4, 127–131. doi:10.1021/jz3017842
66.
Meini, S.; Tsiouvaras, N.; Schwenke, K. U.; Piana, M.; Beyer, H.; Lange, L.; Gasteiger, H. A. Phys. Chem. Chem. Phys.2013,15, 11478–11493. doi:10.1039/c3cp51112j
67.
McCloskey, B. D.; Garcia, J. M.; Luntz, A. C. J. Phys. Chem. Lett.2014,5, 1230–1235. doi:10.1021/jz500494s
68.
McCloskey, B. D.; Bethune, D. S.; Shelby, R. M.; Mori, T.; Scheffler, R.; Speidel, A.; Sherwood, M.; Luntz, A. C. J. Phys. Chem. Lett.2012,3, 3043–3047. doi:10.1021/jz301359t
69.
Freunberger, S. A.; Chen, Y.; Drewett, N. E.; Hardwick, L. J.; Bardé, F.; Bruce, P. G. Angew. Chem., Int. Ed. Engl.2011,50, 8609–8613. doi:10.1002/anie.201102357
McCloskey, B. D.; Scheffler, R.; Speidel, A.; Bethune, D. S.; Shelby, R. M.; Luntz, A. C. J. Am. Chem. Soc.2011,133, 18038–18041. doi:10.1021/ja207229n
60.
Chen, Y.; Freunberger, S. A.; Peng, Z.; Bardé, F.; Bruce, P. G. J. Am. Chem. Soc.2012,134, 7952–7957. doi:10.1021/ja302178w
66.
Meini, S.; Tsiouvaras, N.; Schwenke, K. U.; Piana, M.; Beyer, H.; Lange, L.; Gasteiger, H. A. Phys. Chem. Chem. Phys.2013,15, 11478–11493. doi:10.1039/c3cp51112j
68.
McCloskey, B. D.; Bethune, D. S.; Shelby, R. M.; Mori, T.; Scheffler, R.; Speidel, A.; Sherwood, M.; Luntz, A. C. J. Phys. Chem. Lett.2012,3, 3043–3047. doi:10.1021/jz301359t
74.
Tsiouvaras, N.; Meini, S.; Buchberger, I.; Gasteiger, H. A. J. Electrochem. Soc.2013,160, A471–A477. doi:10.1149/2.042303jes
McCloskey, B. D.; Scheffler, R.; Speidel, A.; Bethune, D. S.; Shelby, R. M.; Luntz, A. C. J. Am. Chem. Soc.2011,133, 18038–18041. doi:10.1021/ja207229n
McCloskey, B. D.; Bethune, D. S.; Shelby, R. M.; Girishkumar, G.; Luntz, A. C. J. Phys. Chem. Lett.2011,2, 1161–1166. doi:10.1021/jz200352v
72.
Xu, W.; Xu, K.; Viswanathan, V. V.; Towne, S. A.; Hardy, J. S.; Xiao, J.; Nie, Z.; Hu, D.; Wang, D.; Zhang, J.-G. J. Power Sources2011,196, 9631–9639. doi:10.1016/j.jpowsour.2011.06.099
73.
Walker, W.; Giordani, V.; Uddin, J.; Bryantsev, V. S.; Chase, G. V.; Addison, D. J. Am. Chem. Soc.2013,135, 2076–2079. doi:10.1021/ja311518s
74.
Tsiouvaras, N.; Meini, S.; Buchberger, I.; Gasteiger, H. A. J. Electrochem. Soc.2013,160, A471–A477. doi:10.1149/2.042303jes
75.
Novák, P.; Panitz, J.-C.; Joho, F.; Lanz, M.; Imhof, R.; Coluccia, M. J. Power Sources2000,90, 52–58. doi:10.1016/S0378-7753(00)00447-X
76.
Barile, C. J.; Gewirth, A. A. J. Electrochem. Soc.2013,160, A549–A552. doi:10.1149/2.033304jes
77.
Armstrong, A. R.; Holzapfel, M.; Novák, P.; Johnson, C. S.; Kang, S.-H.; Thackeray, M. M.; Bruce, P. G. J. Am. Chem. Soc.2006,128, 8694–8698. doi:10.1021/ja062027+
Adams, B. D.; Black, R.; Williams, Z.; Fernandes, R.; Cuisinier, M.; Berg, E. J.; Novak, P.; Murphy, G. K.; Nazar, L. F. Adv. Energy Mater.2015,5, 1400867. doi:10.1002/aenm.201400867
Visco, S. J.; Nimon, V. Y.; Petrov, A.; Pridatko, K.; Goncharenko, N.; Nimon, E.; De Jonghe, L.; Volfkovich, Y. M.; Bograchev, D. A. J. Solid State Electrochem.2014,18, 1443–1456. doi:10.1007/s10008-014-2427-x
Gallagher, K. G.; Goebel, S.; Greszler, T.; Mathias, M.; Oelerich, W.; Eroglu, D.; Srinivasan, V. Energy Environ. Sci.2014,7, 1555–1563. doi:10.1039/c3ee43870h
Visco, S. J.; Nimon, V. Y.; Petrov, A.; Pridatko, K.; Goncharenko, N.; Nimon, E.; De Jonghe, L.; Volfkovich, Y. M.; Bograchev, D. A. J. Solid State Electrochem.2014,18, 1443–1456. doi:10.1007/s10008-014-2427-x
Visco, S.; Nimon, Y. Aqueous electrolyte lithium sulfur batteries. US Pat. 8,828,575 B2, Sept 9, 2014.
222.
Visco, S. J.; Nimon, V. Y.; Petrov, A.; Pridatko, K.; Goncharenko, N.; Nimon, E.; De Jonghe, L.; Volfkovich, Y. M.; Bograchev, D. A. J. Solid State Electrochem.2014,18, 1443–1456. doi:10.1007/s10008-014-2427-x
Zhang, G. Q.; Zheng, J. P.; Liang, R.; Zhang, C.; Wang, B.; Au, M.; Hendrickson, M.; Plichta, E. J. J. Electrochem. Soc.2011,158, A822. doi:10.1149/1.3590736
Lu, J.; Lei, Y.; Lau, K. C.; Luo, X.; Du, P.; Wen, J.; Assary, R. S.; Das, U.; Miller, D. J.; Elam, J. W.; Albishri, H. M.; El-Hady, D. A.; Sun, Y.-K.; Curtiss, L. A.; Amine, K. Nat. Commun.2013,4, 2383. doi:10.1038/ncomms3383
Girishkumar, G.; McCloskey, B.; Luntz, A. C.; Swanson, S.; Wilcke, W. J. Phys. Chem. Lett.2010,1, 2193–2203. doi:10.1021/jz1005384
32.
Lu, Y.-C.; Gallant, B. M.; Kwabi, D. G.; Harding, J. R.; Mitchell, R. R.; Whittingham, M. S.; Shao-Horn, Y. Energy Environ. Sci.2013,6, 750–768. doi:10.1039/c3ee23966g

![[2190-4286-6-105-1]](/bjnano/content/figures/2190-4286-6-105-1.png?scale=2.4&max-width=1024&background=FFFFFF)
![[2190-4286-6-105-i1]](/bjnano/content/inline/2190-4286-6-105-i1.svg?max-width=590&scale=1.18182)
![[2190-4286-6-105-2]](/bjnano/content/figures/2190-4286-6-105-2.png?scale=2.0&max-width=1024&background=FFFFFF)
![[2190-4286-6-105-i2]](/bjnano/content/inline/2190-4286-6-105-i2.svg?max-width=590&scale=1.18182)
![[2190-4286-6-105-i3]](/bjnano/content/inline/2190-4286-6-105-i3.svg?max-width=590&scale=1.18182)
![[2190-4286-6-105-i4]](/bjnano/content/inline/2190-4286-6-105-i4.svg?max-width=590&scale=1.18182)
![[2190-4286-6-105-3]](/bjnano/content/figures/2190-4286-6-105-3.png?scale=2.0&max-width=1024&background=FFFFFF)
![[Graphic 1]](/bjnano/content/inline/2190-4286-6-105-i9.svg?max-width=637&scale=1.0)
![[Graphic 2]](/bjnano/content/inline/2190-4286-6-105-i10.svg?max-width=637&scale=1.0)
![[Graphic 3]](/bjnano/content/inline/2190-4286-6-105-i11.svg?max-width=637&scale=1.0)
![[Graphic 4]](/bjnano/content/inline/2190-4286-6-105-i12.svg?max-width=637&scale=1.0)
![[Graphic 5]](/bjnano/content/inline/2190-4286-6-105-i13.svg?max-width=637&scale=1.0)
![[Graphic 6]](/bjnano/content/inline/2190-4286-6-105-i14.svg?max-width=637&scale=1.0)
![[Graphic 7]](/bjnano/content/inline/2190-4286-6-105-i15.svg?max-width=637&scale=1.0)
![[2190-4286-6-105-4]](/bjnano/content/figures/2190-4286-6-105-4.png?scale=2.0&max-width=1024&background=FFFFFF)
![[2190-4286-6-105-5]](/bjnano/content/figures/2190-4286-6-105-5.png?scale=2.0&max-width=1024&background=FFFFFF)
![[Graphic 8]](/bjnano/content/inline/2190-4286-6-105-i16.svg?max-width=637&scale=1.18182) , “LiO2”) and (c) peroxide species (
, “LiO2”) and (c) peroxide species (![[Graphic 9]](/bjnano/content/inline/2190-4286-6-105-i17.svg?max-width=637&scale=1.18182) , Li2O2). The individual role of these different species in the decomposition reactions is still unclear. In a number of studies on different solvents have been made including ionic liquids [55-57], sulfoxides (DMSO) [58-60], amides [61,62], and others [62-64]. The ether-based glyme solvents with the general structure CH3–O–(CH2–CH2–O)n–CH3 with n = 1–4 are the current state-of-the-art solvents [65-69], although they are not entirely stable. A solvent with better performance still must be found. Adams et al. recently reported on a chemically modified monoglyme (DME), 2,3-dimethyl-2,3-dimethyoxybutane, as a promising solvent as it leads to a significantly lower CO2 evolution (see DEMS) and lower overpotentials for both discharge and charge [70]. Analogous to the lithium–sulfur batteries, the use of lithium nitrate (LiNO3) seems to improve the cyclability of Li/O2 cells as well. In publications by Liox Power Inc., it was shown that LiNO3 leads to an improved stability of the lithium electrode solid electrolyte interphase (SEI) formation [61]. Kang et al. showed that it also leads to an improved stability of carbon at the cathode [71].
, Li2O2). The individual role of these different species in the decomposition reactions is still unclear. In a number of studies on different solvents have been made including ionic liquids [55-57], sulfoxides (DMSO) [58-60], amides [61,62], and others [62-64]. The ether-based glyme solvents with the general structure CH3–O–(CH2–CH2–O)n–CH3 with n = 1–4 are the current state-of-the-art solvents [65-69], although they are not entirely stable. A solvent with better performance still must be found. Adams et al. recently reported on a chemically modified monoglyme (DME), 2,3-dimethyl-2,3-dimethyoxybutane, as a promising solvent as it leads to a significantly lower CO2 evolution (see DEMS) and lower overpotentials for both discharge and charge [70]. Analogous to the lithium–sulfur batteries, the use of lithium nitrate (LiNO3) seems to improve the cyclability of Li/O2 cells as well. In publications by Liox Power Inc., it was shown that LiNO3 leads to an improved stability of the lithium electrode solid electrolyte interphase (SEI) formation [61]. Kang et al. showed that it also leads to an improved stability of carbon at the cathode [71].![[2190-4286-6-105-6]](/bjnano/content/figures/2190-4286-6-105-6.png?scale=2.0&max-width=1024&background=FFFFFF)
![[2190-4286-6-105-7]](/bjnano/content/figures/2190-4286-6-105-7.png?scale=2.0&max-width=1024&background=FFFFFF)
![[2190-4286-6-105-8]](/bjnano/content/figures/2190-4286-6-105-8.png?scale=2.0&max-width=1024&background=FFFFFF)
![[2190-4286-6-105-9]](/bjnano/content/figures/2190-4286-6-105-9.png?scale=2.0&max-width=1024&background=FFFFFF)
![[2190-4286-6-105-10]](/bjnano/content/figures/2190-4286-6-105-10.png?scale=2.0&max-width=1024&background=FFFFFF)
![[2190-4286-6-105-11]](/bjnano/content/figures/2190-4286-6-105-11.png?scale=2.0&max-width=1024&background=FFFFFF)
![[2190-4286-6-105-12]](/bjnano/content/figures/2190-4286-6-105-12.png?scale=2.0&max-width=1024&background=FFFFFF)
![[2190-4286-6-105-13]](/bjnano/content/figures/2190-4286-6-105-13.png?scale=2.0&max-width=1024&background=FFFFFF)
![[2190-4286-6-105-14]](/bjnano/content/figures/2190-4286-6-105-14.png?scale=2.0&max-width=1024&background=FFFFFF)
![[2190-4286-6-105-15]](/bjnano/content/figures/2190-4286-6-105-15.png?scale=2.0&max-width=1024&background=FFFFFF)
![[Graphic 10]](/bjnano/content/inline/2190-4286-6-105-i18.svg?max-width=637&scale=1.18182) ), accounting for a quarter of the overall capacity. Further reduction leads to formation and precipitation of insoluble species leading to an overall two electron reduction of S with Li2S as end product. During the following charge, Li2S is reconverted to S8 via intermediate polysulfides, ideally. The characteristic minimum between the upper and the lower discharge plateau is attributed to the nucleation of solid products [126,127]. The exact position of the potentials also depends on the electrolyte solvent [128].
), accounting for a quarter of the overall capacity. Further reduction leads to formation and precipitation of insoluble species leading to an overall two electron reduction of S with Li2S as end product. During the following charge, Li2S is reconverted to S8 via intermediate polysulfides, ideally. The characteristic minimum between the upper and the lower discharge plateau is attributed to the nucleation of solid products [126,127]. The exact position of the potentials also depends on the electrolyte solvent [128].![[2190-4286-6-105-16]](/bjnano/content/figures/2190-4286-6-105-16.png?scale=2.0&max-width=1024&background=FFFFFF)
![[2190-4286-6-105-17]](/bjnano/content/figures/2190-4286-6-105-17.png?scale=2.0&max-width=1024&background=FFFFFF)
![[2190-4286-6-105-18]](/bjnano/content/figures/2190-4286-6-105-18.png?scale=2.0&max-width=1024&background=FFFFFF)
![[2190-4286-6-105-19]](/bjnano/content/figures/2190-4286-6-105-19.png?scale=2.0&max-width=1024&background=FFFFFF)
![[Graphic 11]](/bjnano/content/inline/2190-4286-6-105-i19.svg?max-width=637&scale=1.0)
![[Graphic 12]](/bjnano/content/inline/2190-4286-6-105-i20.svg?max-width=637&scale=1.0)
![[Graphic 13]](/bjnano/content/inline/2190-4286-6-105-i21.svg?max-width=637&scale=1.0)
![[Graphic 14]](/bjnano/content/inline/2190-4286-6-105-i22.svg?max-width=637&scale=1.0)
![[2190-4286-6-105-20]](/bjnano/content/figures/2190-4286-6-105-20.png?scale=2.0&max-width=1024&background=FFFFFF)
![[2190-4286-6-105-21]](/bjnano/content/figures/2190-4286-6-105-21.png?scale=2.0&max-width=1024&background=FFFFFF)
![[2190-4286-6-105-22]](/bjnano/content/figures/2190-4286-6-105-22.png?scale=2.0&max-width=1024&background=FFFFFF)
![[2190-4286-6-105-i5]](/bjnano/content/inline/2190-4286-6-105-i5.svg?max-width=590&scale=1.18182)
![[2190-4286-6-105-i6]](/bjnano/content/inline/2190-4286-6-105-i6.svg?max-width=590&scale=1.18182)
![[2190-4286-6-105-i7]](/bjnano/content/inline/2190-4286-6-105-i7.svg?max-width=590&scale=1.18182)
![[2190-4286-6-105-i8]](/bjnano/content/inline/2190-4286-6-105-i8.svg?max-width=590&scale=1.18182)
![[2190-4286-6-105-23]](/bjnano/content/figures/2190-4286-6-105-23.png?scale=2.0&max-width=1024&background=FFFFFF)
![[2190-4286-6-105-24]](/bjnano/content/figures/2190-4286-6-105-24.png?scale=2.0&max-width=1024&background=FFFFFF)
![[2190-4286-6-105-25]](/bjnano/content/figures/2190-4286-6-105-25.png?scale=2.0&max-width=1024&background=FFFFFF)
![[2190-4286-6-105-26]](/bjnano/content/figures/2190-4286-6-105-26.png?scale=2.0&max-width=1024&background=FFFFFF)
![[Graphic 15]](/bjnano/content/inline/2190-4286-6-105-i23.svg?max-width=637&scale=1.18182)