Supporting Information
Additional figure, showing SEM micrographs of the physical mixture of Si and C in different magnifications, and a table, summarizing the tap densities of the C:Si composites. Additional figure showing the CEs, EEs and VEs in the charge/discharge current experiments for the Si/C composites with a carbon to silicon ratio of 100:0 (a), 90:10 (b) and 80:20 (c).
| Supporting Information File 1: Supporting information. | ||
| Format: PDF | Size: 560.2 KB | Download |
Cite the Following Article
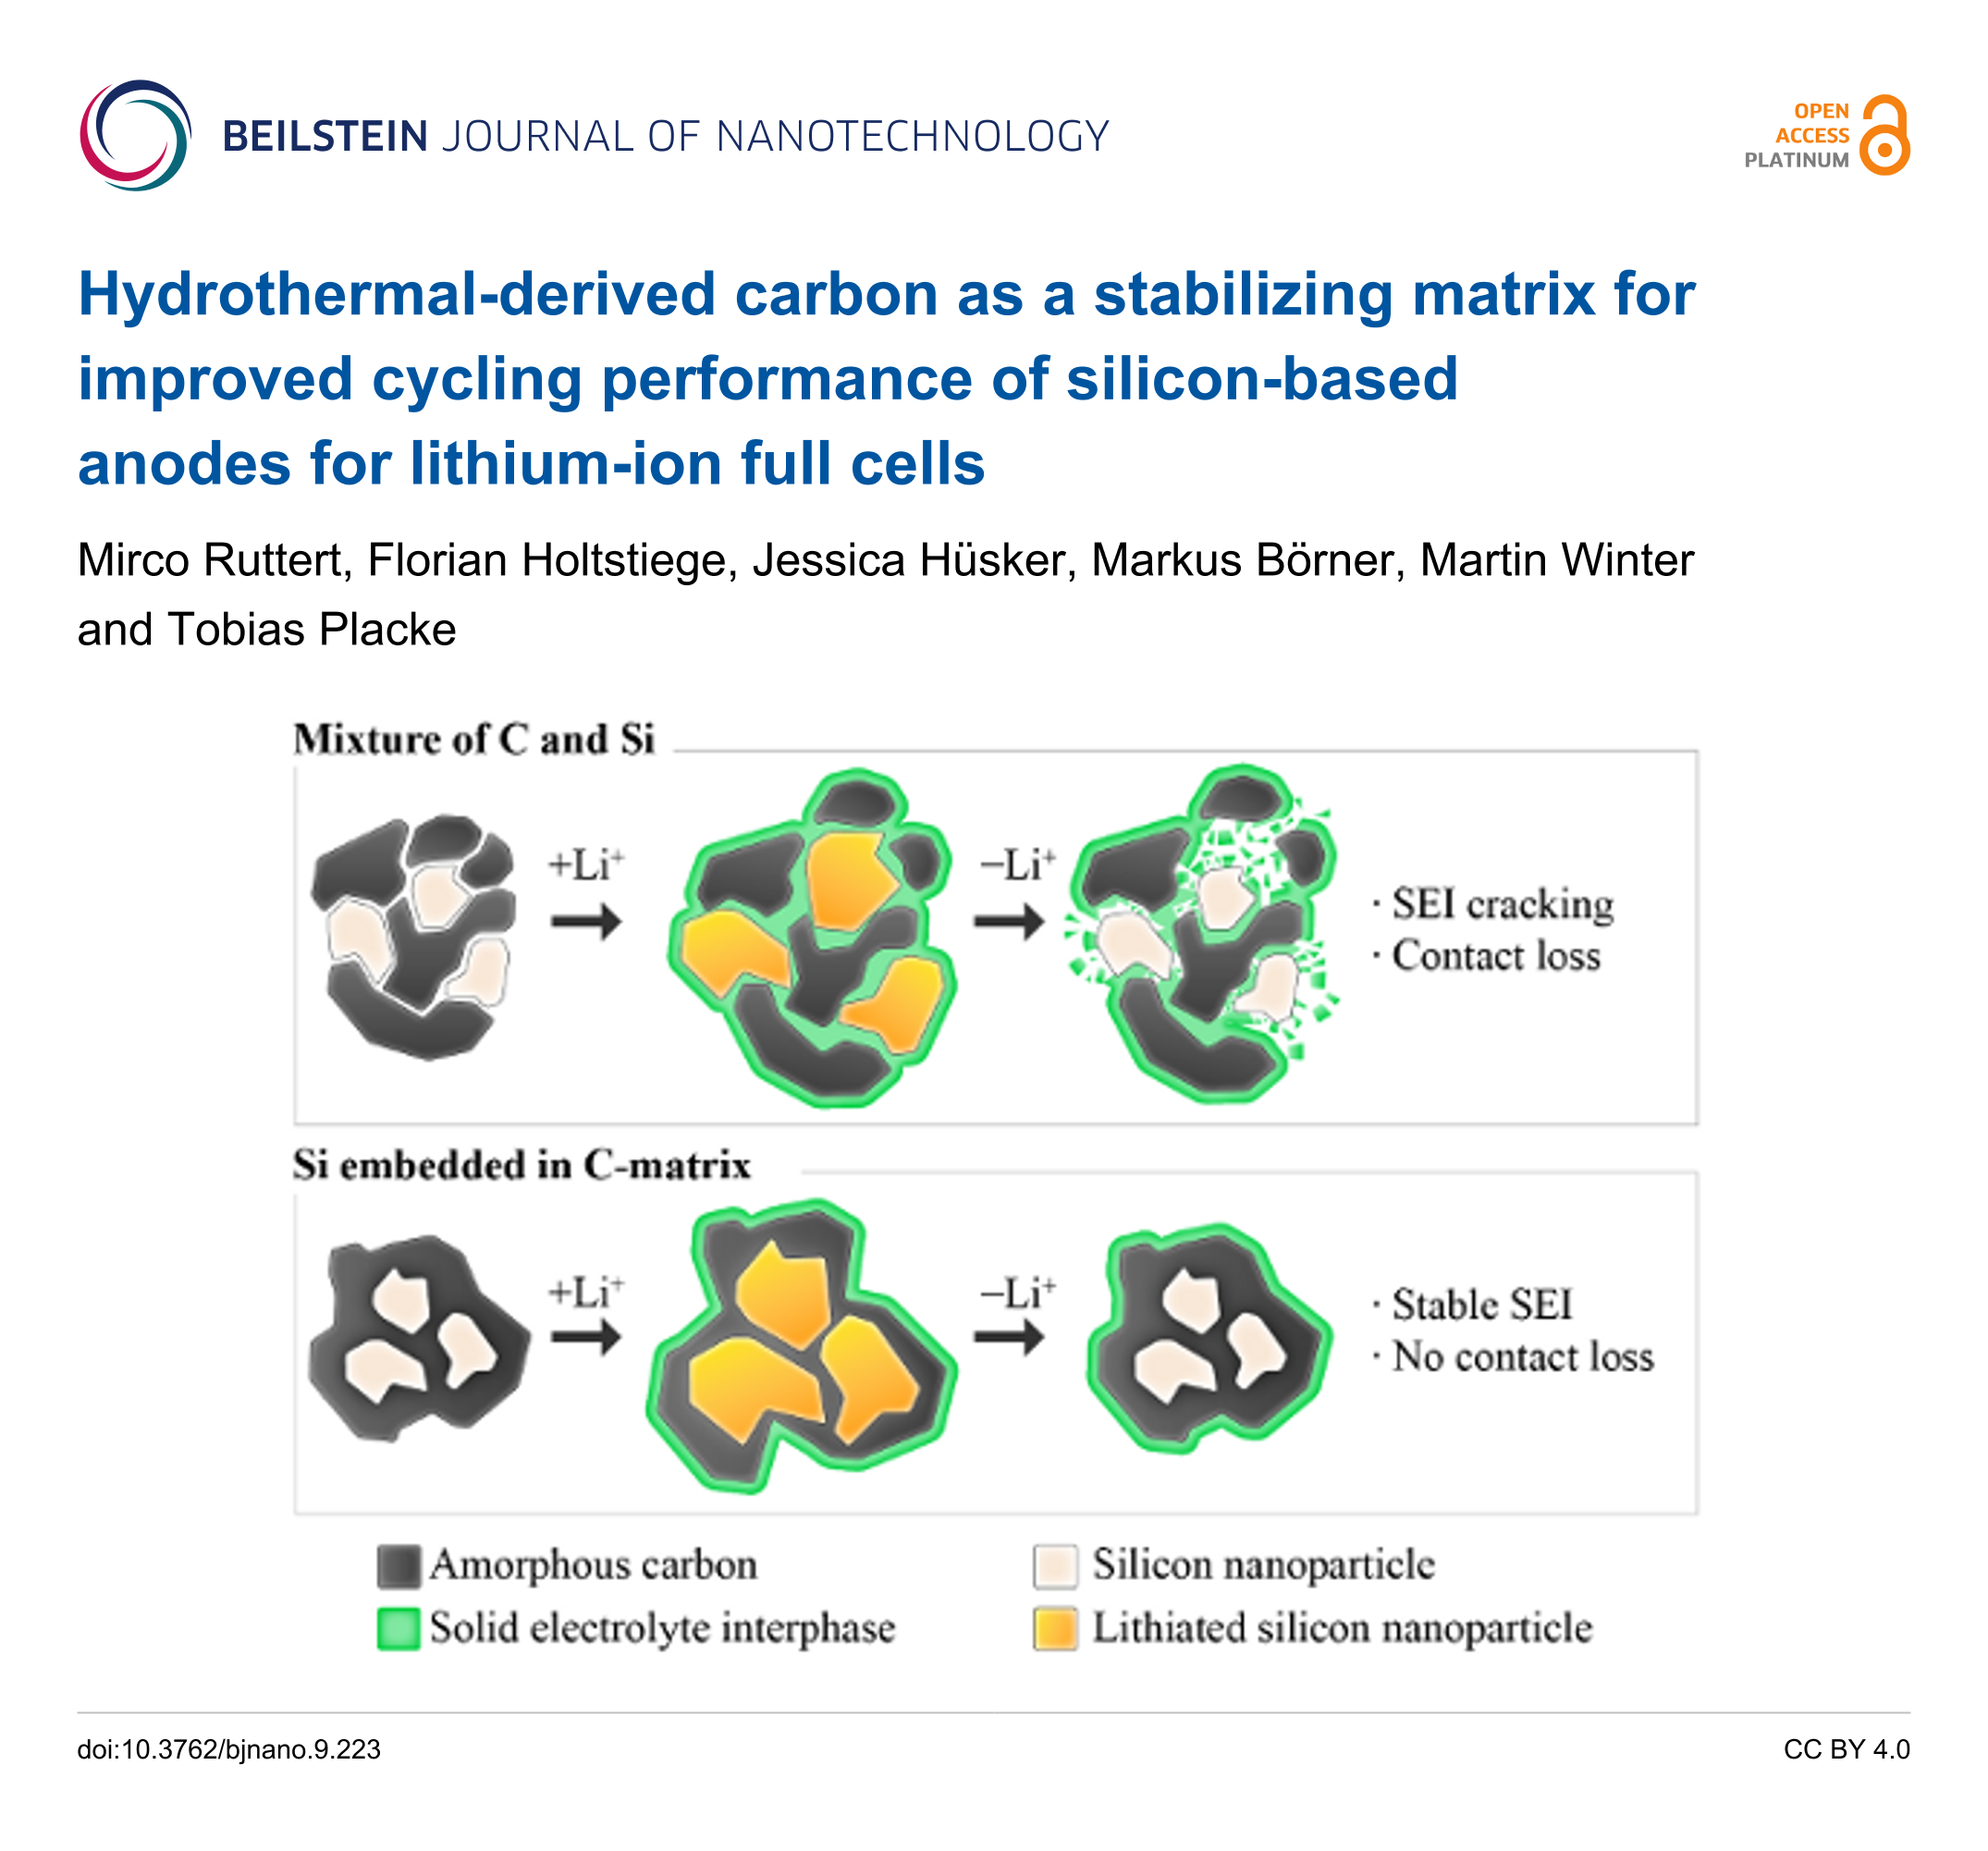
Hydrothermal-derived carbon as a stabilizing matrix for improved cycling performance of silicon-based anodes for lithium-ion full cells
Mirco Ruttert, Florian Holtstiege, Jessica Hüsker, Markus Börner, Martin Winter and Tobias Placke
Beilstein J. Nanotechnol. 2018, 9, 2381–2395.
https://doi.org/10.3762/bjnano.9.223
How to Cite
Ruttert, M.; Holtstiege, F.; Hüsker, J.; Börner, M.; Winter, M.; Placke, T. Beilstein J. Nanotechnol. 2018, 9, 2381–2395. doi:10.3762/bjnano.9.223
Download Citation
Citation data can be downloaded as file using the "Download" button or used for copy/paste from the text window
below.
Citation data in RIS format can be imported by all major citation management software, including EndNote,
ProCite, RefWorks, and Zotero.
Presentation Graphic
| Picture with graphical abstract, title and authors for social media postings and presentations. | ||
| Format: PNG | Size: 992.9 KB | Download |
Citations to This Article
Up to 20 of the most recent references are displayed here.
Scholarly Works
- Jang, J.; Kwon, T. Various Technologies to Mitigate Volume Expansion of Silicon Anode Materials in Lithium-Ion Batteries. Batteries 2025, 11, 346. doi:10.3390/batteries11090346
- Hu, Z.; Bian, L.; Li, H.; Zhang, X.; Gao, J.; Tian, R.; Xing, L.; An, S. Enhanced lithium-ion storage of silicon-carbon composite by homogeneous carbon coating and pore regulation for lithium-ion batteries. Ceramics International 2025, 51, 32522–32529. doi:10.1016/j.ceramint.2025.04.344
- Zhao, P.-Y.; Zhang, S.; Choy, K.-L.; Song, Y.; Zhang, S.; Guo, D.; Yang, C. Silicon negative electrodes for lithium-ion batteries: challenges, advances, and future prospects. Materials horizons 2025, 12, 6440–6484. doi:10.1039/d5mh00504c
- bian, l.; Hu, Z.; Li, H.; Zhang, X.; Gao, J.; Tian, R.; Xing, L.; An, S. Enhanced Lithium-Ion Storage of Silicon-Carbon Composite by Homogeneous Carbon Coating and Pore Regulation for Lithium-Ion Batteries. Elsevier BV 2025. doi:10.2139/ssrn.5163097
- Sun, C.; Pan, J.; Zhao, X.; Jiao, C.; Yao, W.; Wang, C.; Fu, X.; Ma, D.; Xue, H.; Liu, J.; Cui, L.; Li, M.; Du, A.; Wang, Q. Effective coating of Si@NiO nanoflowers with nitrogen-doped wheat protein-derived biochar for efficient lithium-ion and lithium-sulfur batteries anode materials. Journal of Alloys and Compounds 2023, 968, 171922. doi:10.1016/j.jallcom.2023.171922
- Tran Huu, H.; Nguyen, N. P.; Ngo, V. H.; Luc, H. H.; Le, M. K.; Nguyen, M. T.; Le, M. L. P.; Kim, H. R.; Kim, I. Y.; Kim, S. J.; Tran, V. M.; Vo, V. In situ magnesiothermic reduction synthesis of a Ge@C composite for high-performance lithium-ion batterie anodes. Beilstein journal of nanotechnology 2023, 14, 751–761. doi:10.3762/bjnano.14.62
- Sun, C.; Du, A.; Deng, G.; Zhao, X.; Pan, J.; Fu, X.; Liu, J.; Cui, L.; Wang, Q. Naturally nitrogen-doped self-encapsulated biochar materials based on mouldy wheat flour for silicon anode in lithium-ion batteries. Electrochimica Acta 2023, 450, 142269. doi:10.1016/j.electacta.2023.142269
- Haneke, L.; Pfeiffer, F.; Bärmann, P.; Wrogemann, J.; Peschel, C.; Neumann, J.; Kux, F.; Nowak, S.; Winter, M.; Placke, T. Insights into Electrolytic Pre-Lithiation: A Thorough Analysis Using Silicon Thin Film Anodes. Small (Weinheim an der Bergstrasse, Germany) 2022, 19, e2206092. doi:10.1002/smll.202206092
- Wu, T.; Ke, Q.; Lu, M.; Pan, P.; Zhou, Y.; Gu, Z.; Cui, G.; Lu, H. Recent Advances in Carbon-Silica Composites: Preparation, Properties, and Applications. Catalysts 2022, 12, 573. doi:10.3390/catal12050573
- Orthner, H.; Wiggers, H.; Loewenich, M.; Kilian, S.; Bade, S.; Lyubina, J. Direct gas phase synthesis of amorphous Si/C nanoparticles as anode material for lithium ion battery. Journal of Alloys and Compounds 2021, 870, 159315. doi:10.1016/j.jallcom.2021.159315
- Schmiegel, J.-P.; Nölle, R.; Henschel, J.; Quach, L.; Nowak, S.; Winter, M.; Glorius, F.; Placke, T. Case study of N-carboxyanhydrides in silicon-based lithium ion cells as a guideline for systematic electrolyte additive research. Cell Reports Physical Science 2021, 2, 100327. doi:10.1016/j.xcrp.2021.100327
- Hsu, Y.-C.; Hsieh, C.-C.; Liu, W.-R. Synthesis of double core-shell carbon/silicon/graphite composite anode materials for lithium-ion batteries. Surface and Coatings Technology 2020, 387, 125528. doi:10.1016/j.surfcoat.2020.125528
- Zhu, L.-h.; Chen, Y.; Wu, C.; Chu, R.; Zhang, J.; Jiang, H.; Zeng, Y.; Zhang, Y.; Guo, H. Double-carbon protected silicon anode for high performance lithium-ion batteries. Journal of Alloys and Compounds 2020, 812, 151848. doi:10.1016/j.jallcom.2019.151848
- Ruttert, M.; Siozios, V.; Winter, M.; Placke, T. Mechanochemical Synthesis of Fe–Si-Based Anode Materials for High-Energy Lithium Ion Full-Cells. ACS Applied Energy Materials 2019, 3, 743–758. doi:10.1021/acsaem.9b01926
- Nölle, R.; Schmiegel, J.-P.; Winter, M.; Placke, T. Tailoring Electrolyte Additives with Synergistic Functional Moieties for Silicon Negative Electrode-Based Lithium Ion Batteries: A Case Study on Lactic Acid O-Carboxyanhydride. Chemistry of Materials 2019, 32, 173–185. doi:10.1021/acs.chemmater.9b03173
- Mönig, H.; Schmid, M. Renewable energy conversion using nano- and microstructured materials. Beilstein journal of nanotechnology 2019, 10, 771–773. doi:10.3762/bjnano.10.76
- Zhao, S.; Yue, X.; Xian, X.; Liu, N.; Li, W. Fabrication of Porous Si@C Composites with Core-Shell Structure and Their Electrochemical Performance for Li-ion Batteries. Batteries 2019, 5, 27. doi:10.3390/batteries5010027
- Ruttert, M.; Siozios, V.; Winter, M.; Placke, T. Synthesis and Comparative Investigation of Silicon Transition Metal Silicide Composite Anodes for Lithium Ion Batteries. Zeitschrift für anorganische und allgemeine Chemie 2019, 645, 248–256. doi:10.1002/zaac.201800436