Nano- and microstructures for energy conversion: materials and devices

Prof. Martina Schmid, University of Duisburg-Essen, Germany
Dr. Harry Mönig, University of Münster, Germany
This thematic issue is a collection of contributions on novel developments and trends in the field of renewable energy conversion using nano- and microscale materials. The key topics include fundamental aspects of structural and chemical nanoscale characterization, new materials and especially device concepts and also cover strategies and ideas for future developments in this field.
- New material and device concepts (including metamaterials, organic/hybrid/quantum dot structures, thermoelectrics, various nano- and microscale approaches, advanced device concepts)
- Light and current management (ranging from photonics, light concentration, and charge carrier collection to interfaces and surfaces)
- Advanced analytical methods (related to chemical composition, structural characterization, optoelectronic properties)
Renewable energy conversion using nano- and microstructured materials
- Harry Mönig and
- Martina Schmid
Beilstein J. Nanotechnol. 2019, 10, 771–773, doi:10.3762/bjnano.10.76

Localized photodeposition of catalysts using nanophotonic resonances in silicon photocathodes
- Evgenia Kontoleta,
- Sven H. C. Askes,
- Lai-Hung Lai and
- Erik C. Garnett
Beilstein J. Nanotechnol. 2018, 9, 2097–2105, doi:10.3762/bjnano.9.198


Spin-coated planar Sb2S3 hybrid solar cells approaching 5% efficiency
- Pascal Kaienburg,
- Benjamin Klingebiel and
- Thomas Kirchartz
Beilstein J. Nanotechnol. 2018, 9, 2114–2124, doi:10.3762/bjnano.9.200


Lead-free hybrid perovskites for photovoltaics
- Oleksandr Stroyuk
Beilstein J. Nanotechnol. 2018, 9, 2209–2235, doi:10.3762/bjnano.9.207


Performance analysis of rigorous coupled-wave analysis and its integration in a coupled modeling approach for optical simulation of complete heterojunction silicon solar cells
- Ziga Lokar,
- Benjamin Lipovsek,
- Marko Topic and
- Janez Krc
Beilstein J. Nanotechnol. 2018, 9, 2315–2329, doi:10.3762/bjnano.9.216


Hydrothermal-derived carbon as a stabilizing matrix for improved cycling performance of silicon-based anodes for lithium-ion full cells
- Mirco Ruttert,
- Florian Holtstiege,
- Jessica Hüsker,
- Markus Börner,
- Martin Winter and
- Tobias Placke
Beilstein J. Nanotechnol. 2018, 9, 2381–2395, doi:10.3762/bjnano.9.223


Thickness-dependent photoelectrochemical properties of a semitransparent Co3O4 photocathode
- Malkeshkumar Patel and
- Joondong Kim
Beilstein J. Nanotechnol. 2018, 9, 2432–2442, doi:10.3762/bjnano.9.228


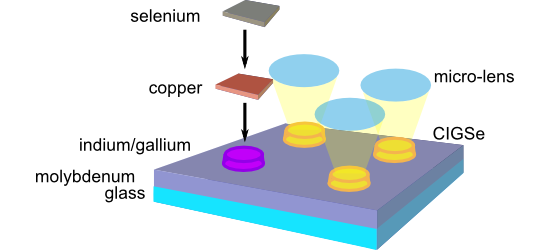
Femtosecond laser-assisted fabrication of chalcopyrite micro-concentrator photovoltaics
- Franziska Ringleb,
- Stefan Andree,
- Berit Heidmann,
- Jörn Bonse,
- Katharina Eylers,
- Owen Ernst,
- Torsten Boeck,
- Martina Schmid and
- Jörg Krüger
Beilstein J. Nanotechnol. 2018, 9, 3025–3038, doi:10.3762/bjnano.9.281


Geometrical optimisation of core–shell nanowire arrays for enhanced absorption in thin crystalline silicon heterojunction solar cells
- Robin Vismara,
- Olindo Isabella,
- Andrea Ingenito,
- Fai Tong Si and
- Miro Zeman
Beilstein J. Nanotechnol. 2019, 10, 322–331, doi:10.3762/bjnano.10.31


