

Search results
Search for "FTIR" in Full Text gives 342 result(s) in Beilstein Journal of Nanotechnology. Showing first 200.
Mn-doped ZnO nanopowders prepared by sol–gel and microwave-assisted sol–gel methods and their photocatalytic properties
Beilstein J. Nanotechnol. 2024, 15, 1283–1296, doi:10.3762/bjnano.15.104
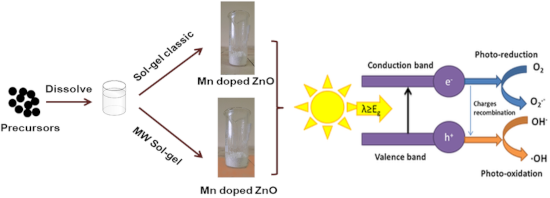
- methods. Fourier-transform infrared spectroscopy Figure 1 shows the FTIR spectra of as-prepared gels obtained by SG and MW. The broad band in the 3600–2500 cm−1 region can be assigned to overlapping characteristic vibrations of C–H, N–H, and O–H bonds. The small bands at 2972, 2866, and 2747 cm−1 are
- characteristic to vibrations of C–H bonds in CH2 and CH3 groups. The bands are shifted from their position in the spectrum of pure zinc acetate [42]. The asymmetric and symmetric stretchings of C=O in COO– groups occur in the FTIR spectra at 1580 and 1418 cm−1, respectively. The symmetric stretching of the C–O
- characteristic of Mn–O bond vibrations [44]. Based on the FTIR spectra, we can assume that during the gelation process a zinc-based gel with a structure similar to the one reported by Moezzi [46] was obtained. The primary distinction between the samples prepared by the two methods discussed in this article (SG


Enhanced catalytic reduction through in situ synthesized gold nanoparticles embedded in glucosamine/alginate nanocomposites
Beilstein J. Nanotechnol. 2024, 15, 1227–1237, doi:10.3762/bjnano.15.99
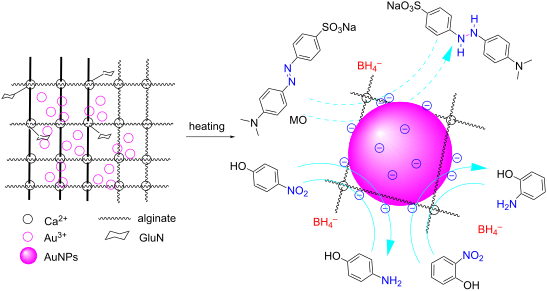
- synthesizing gold nanoparticles (AuNPs) within a glucosamine/alginate (GluN/Alg) nanocomposite via an ionotropic gelation mechanism in aqueous environment. The resulting nanocomposite, AuNPs@GluN/Alg, underwent thorough characterization using UV–vis, EDX, FTIR, SEM, TEM, SAED, and XRD analyses. The spherical
- 0 to 140 min. Physicochemical characterizations of AuNPs@GluN/Alg nanocomposite The samples synthesized under optimal conditions underwent physicochemical characterization and were used for the catalytic reduction of organic dyes. FTIR spectra of blank GluN/Alg and AuNPs@GluN/Alg were acquired using
- a Bruker Tensor 27 FTIR spectrophotometer, which scanned wavelengths from 500 to 4000 cm−1. KBr pellets were used for the measurements. For morphological investigations of the nanocomposites, scanning electron microscopy (SEM) was performed using a SEM-S4800 instrument; transmission electron



Synthesis, characterization and anticancer effect of doxorubicin-loaded dual stimuli-responsive smart nanopolymers
Beilstein J. Nanotechnol. 2024, 15, 1189–1196, doi:10.3762/bjnano.15.96
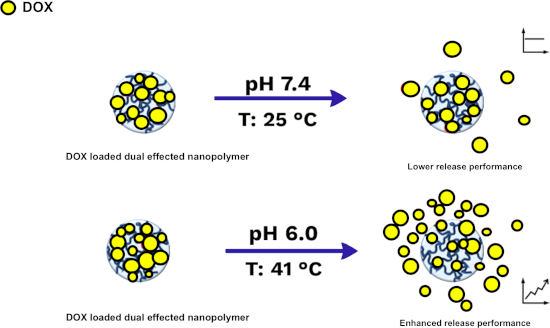
- are sensitive to two factors, such as pH and temperature, can be engineered to enhance targeting efficacy while minimizing systemic side effects [31][32]. Here, a strategy for the production and application of DOX-SNPs is proposed. FTIR, SEM, and zeta potential measurements were performed to
- Centrifugen, USA). The precipitated nanostructures were redispersed in distilled water utilizing a sonicator and dried with a lyophilizer. Then, the nanostructures were stored at 4 °C. Characterization studies Functional group analysis was carried out by Fourier-transform infrared (FTIR) spectroscopy
- nanostructures, and analyses of the characteristic peaks in the FTIR spectrum were performed. The FTIR spectra of SNPs and DOX-SNPs are given in Figure 2. From these spectra, the intensity of The FTIR spectra of SNPs and DOX-SNPs are given in Figure 2. The intensity of the OH peaks around 3370 cm−1 increased


Direct electron beam writing of silver using a β-diketonate precursor: first insights
Beilstein J. Nanotechnol. 2024, 15, 1117–1124, doi:10.3762/bjnano.15.90

- Raman or FTIR spectroscopy [5][8][37], to study the nature of the desorbed and incorporated molecular fragments ideally during the irradiation process. Up to now, only silver pentafluoropriopionate allowed for three-dimensional growth [30]. However, the use of this compound required relatively high


Facile synthesis of Fe-based metal–organic frameworks from Fe2O3 nanoparticles and their application for CO2/N2 separation
Beilstein J. Nanotechnol. 2024, 15, 897–908, doi:10.3762/bjnano.15.74
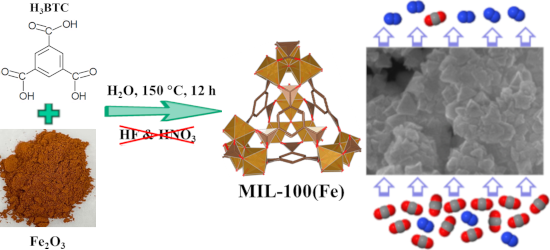
- and yield of the as-prepared MIL-100(Fe) materials, including thermogravimetric analysis (TGA), Fourier-transform infrared (FTIR) spectroscopy, powder X-ray diffraction (PXRD) measurements, determination of textural properties, scanning electron microscopy (SEM), and X-ray photoelectron spectroscopy
- -100Fe@Fe2O3 materials was collected using a field-emission scanning electron microscope Leo-Supra 55 (Carl Zeiss STM, Germany). An attenuated total reflectance (ATR) setup was adopted to record the Fourier-transform infrared (FTIR) spectra of all samples on a Frontier spectrometer (PerkinElmer, USA) in
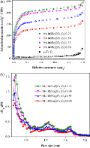
- MIL-100(Fe) crystals in the prepared M-100Fe@Fe2O3 samples increases in the following order: M-100Fe@Fe2O3#0.90 < M-100Fe@Fe2O3#1.35 < M-100Fe@Fe2O3#1.80 < M-100Fe@Fe2O3#2.25. This result aligns well with the XRD data shown in Figure 2. Figure 4 exhibits ATR-FTIR spectra of Fe2O3, MIL-100(Fe), and as





Electron-induced ligand loss from iron tetracarbonyl methyl acrylate
Beilstein J. Nanotechnol. 2024, 15, 797–807, doi:10.3762/bjnano.15.66
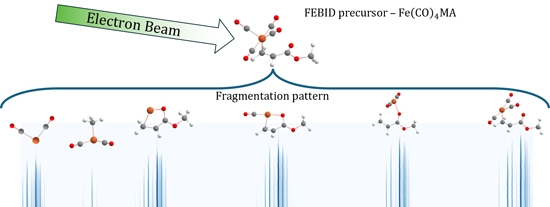
- use. 1H nuclear magnetic resonance spectra (NMR) were obtained on a Bruker 400 MHz spectrometer. IR spectra were obtained on a PerkinElmer Spectrum ONE FTIR spectrometer using a solution cell equipped with NaCl windows and a path length of 1.0 mm. Synthesis The compound was synthesized according to
- fragments from the reaction Fe(CO)4(η2-C4H6O2) + e−. Supporting Information Supporting Information contains details of the DFT calculation, ion yield curves for dissociative ionization, and FTIR, NMR and UV–vis spectra of the sample. Supporting Information File 16: Additional experimental data. Funding



Electrospun polysuccinimide scaffolds containing different salts as potential wound dressing material
Beilstein J. Nanotechnol. 2024, 15, 781–796, doi:10.3762/bjnano.15.65
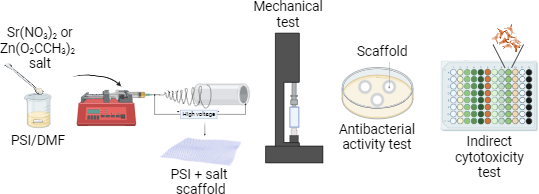
- scanning electron microscopy (SEM), Fourier-transform infrared spectroscopy (FTIR), mechanical tests, investigation of salt dissolution from the scaffolds, examination of their antibacterial activity against four different bacterial strains (Escherichia coli, Pseudomonas aeruginosa, Bacillus subtilis, and
- FTIR analysis, we used an energy-dispersive X-ray spectroscopy (EDX) detector during the SEM measurements to show the presence of salts in the fibers. The EDX spectra were taken at a voltage of 15 kV. Mechanical properties A mechanical testing machine (4952, Instron, USA) and the associated software
- in Table 1. The presence of Sr(NO3)2 changed the viscosity and conductivity properties of the solutions. In the case of 20 PSI + 5 Sr(NO3)2 and 20 PSI + 7.5 Sr(NO3)2, a higher voltage was necessary for fiber preparation based on the viscosity decrease. On the FTIR spectra (Figure 1B, Figure 1C), the



Green synthesis of biomass-derived carbon quantum dots for photocatalytic degradation of methylene blue
Beilstein J. Nanotechnol. 2024, 15, 755–766, doi:10.3762/bjnano.15.63
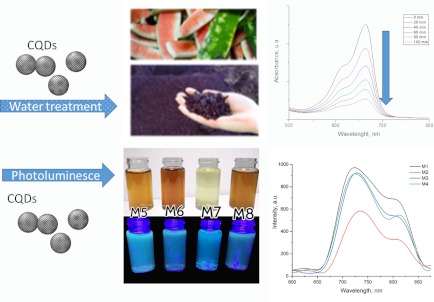
- catalytic activity in MB degradation, while those prepared with water as a solvent did not show significant catalytic activity. The samples were also characterized using UV–visible spectra, Fourier-transform infrared spectroscopy (FTIR), Raman spectroscopy, dynamic light scattering (DLS), and
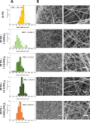
- underlines the influence of biomass source and synthesis parameters on the resulting CQD dimensions. Fourier-transform infrared spectroscopy The surface chemical groups of the samples were analyzed using FTIR spectroscopy. Figure 3a displays the FTIR spectrum of the CQDs synthesized with grape pomace. Since
- oxidation process enhances the solubility of CQDs in water. The spectrum also shows low-intensity signals in the range of 1800 to 2500 cm−1, which are characteristic of aromatic compounds [22][27]. In Figure 3b, the FTIR spectrum of the CQDs synthesized from watermelon peel is shown. Similar characteristics


Gold nanomakura: nanoarchitectonics and their photothermal response in association with carrageenan hydrogels
Beilstein J. Nanotechnol. 2024, 15, 678–693, doi:10.3762/bjnano.15.56

- diffraction (XRD), and FTIR, respectively, to establish physicochemical properties of the synthesized nanomaterials. Results Synthesis, optical spectroscopy, and zeta potential Anisotropic gold nanoparticles of makura shape were synthesized using seed-mediated approach as shown in Figure 1a. The Au seeds were
- shifted in the case of surfactant-capped gold nanoparticles when compared to the FTIR spectra of pure surfactants (CTAB, MTAB, and DTAB). Pure surfactants (CTAB, MTAB, and DTAB) generally show two bands at 719 and 731 cm−1, whereas surfactant-capped gold nanoparticles only show one band at 669 cm−1 as
- confirmed through FTIR spectroscopy. C–H scissoring vibrations of H3C–N+ and C–N+ stretching are relatively less intense and slightly shifted in surfactant-capped gold nanoparticles with an appearance of a single band at 669 cm−1 as shown in Figure 5a. This is clear proof of the containments that surfactant






Laser synthesis of nanoparticles in organic solvents – products, reactions, and perspectives
Beilstein J. Nanotechnol. 2024, 15, 638–663, doi:10.3762/bjnano.15.54
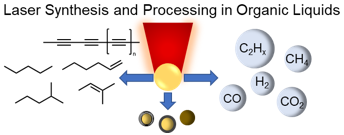
- tetrahydrofurane (THF) at a total energy input of 2250 J comparing fs-, ps-, and ns-pulsed lasers using FTIR spectroscopy. They found a significant decrease in the dominant C–O–C bond at 1070 cm−1 after ablation, which indicates cleavage of the C–O–C bonds in THF. C–H and C–C bonds were detected before and after





AFM-IR investigation of thin PECVD SiOx films on a polypropylene substrate in the surface-sensitive mode
Beilstein J. Nanotechnol. 2024, 15, 603–611, doi:10.3762/bjnano.15.51
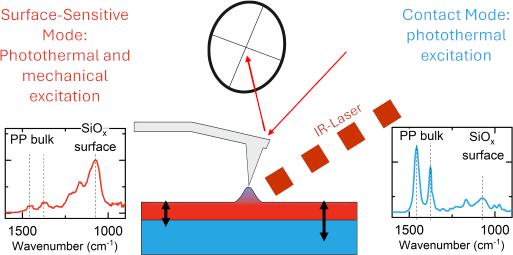
- correlation between the IR wavelength of the laser and the thermal expansion of the material enables the recording of IR absorption spectra with this technique which correspond to the spectra of bulk IR spectroscopy [2][3][4]. Compared to ATR-FTIR spectroscopy, AFM-IR provides a drastic improvement in terms


Radiofrequency enhances drug release from responsive nanoflowers for hepatocellular carcinoma therapy
Beilstein J. Nanotechnol. 2024, 15, 569–579, doi:10.3762/bjnano.15.49
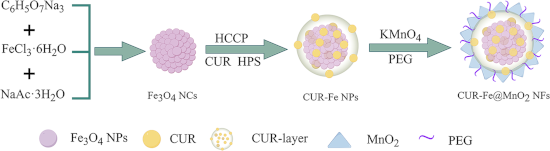
- hydrated state [31]. The DLS depicted size is the closest to that in vivo. The Fourier-transform infrared (FTIR) spectrum of CUR exhibited vibrational absorption peaks at 1207 cm−1 and 3330 cm−1 corresponding to C=O and –OH, respectively, in the phenolic hydroxy group (Figure 2f). Similarly, for bis(4
- ) molecule, while the peaks at 874 cm−1 and 1217.3 cm−1 resulted from the vibrations of P–N and P=N in HCCP. The FTIR spectrum of the CUR-Fe@MnO2 NFs revealed an absorption peak corresponding to the Fe–O bond in the Fe3O4 NCs at 584 cm−1. A new absorption peak at 963 cm−1 indicated the formation of P–O– CUR
- , respectively). f) FTIR spectra of HCCP, CUR, HPS, and the CUR-Fe@MnO2 NFs. g) XRD patterns of the Fe3O4 NCs, curcumin, CUR-Fe NPs, and CUR-Fe@MnO2 NFs. h) Hysteresis loop of the Fe3O4 NCs and CUR-Fe@MnO2 NFs, indicating that they were superparamagnetic. a) T1/T2-mapping MR imaging of CUR-Fe@MnO2 NFs at pH 5.0


Photocatalytic degradation of methylene blue under visible light by cobalt ferrite nanoparticles/graphene quantum dots
Beilstein J. Nanotechnol. 2024, 15, 475–489, doi:10.3762/bjnano.15.43
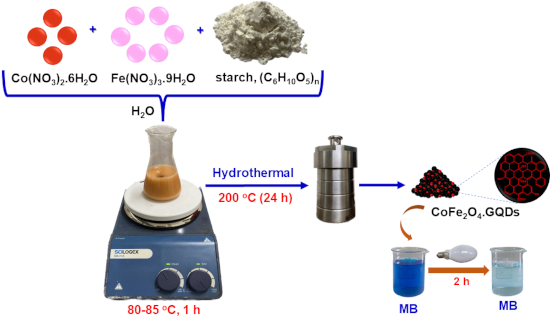
- infrared (FTIR) spectra were recorded on a IR-Prestige-21 (Shimadzu). Raman spectra were recorded on an Xplora Plus instrument (Horiba, Japan) in a frequency range from 200 to 2000 cm−1 and with an excitation wavelength of 785 nm. The nitrogen adsorption/desorption isotherms were recorded by using a
- of the solid part extracted from the suspension of CF/GQDs-200. The FTIR spectra of CF and CF/GQDs-200 are shown in Figure 3a. CF has two broad bands at 387 and 580 cm−1, attributed to the characteristic stretching vibrations of the iron and cobalt bonds at the tetrahedral and octahedral sites
- ) and ultraviolet light (254 nm, right); (b) photoluminescence excitation (PL) and photoluminescence emission spectra (PLE) of the GQDs; (c) XRD pattern of GQDs; (d) PL spectra of supernatants from prepared CF/GQD suspensions. (a) FTIR spectra of CF/GQDs and CoFe2O4; (b, c) Raman spectra; (d) TG/dTG




On the mechanism of piezoresistance in nanocrystalline graphite
Beilstein J. Nanotechnol. 2024, 15, 376–384, doi:10.3762/bjnano.15.34

- , and parameters were extracted. While the paper offers an overview of piezoresistance in NCG, a more in-depth study is imperative for a complete comprehension of the system’s complexity. In situ FTIR measurements could provide additional insights into changes in doping and defects with strain


Vinorelbine-loaded multifunctional magnetic nanoparticles as anticancer drug delivery systems: synthesis, characterization, and in vitro release study
Beilstein J. Nanotechnol. 2024, 15, 256–269, doi:10.3762/bjnano.15.24
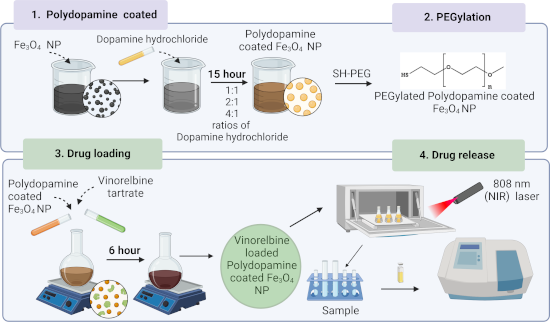
- Pro) using Cu Kα radiation (λ = 0.15418 nm) in a 2θ range of 10° to 90°. Fourier-transform infrared (FTIR, Thermo, Nicolet Is 10) spectra of the nanostructures were obtained in the range of 4000–400 cm−1. The amounts of released drug were obtained using a UV–vis spectrophotometer (Shimadzu Scientific
- °, 56.08°, 62.7°, and 73.92°. These peaks can be assigned to the corresponding crystallographic planes of magnetite Fe3O4: (220), (311), (400), (422), (511), (440), and (533), respectively. Fe3O4 NPs exhibit a peak consistent with the data obtained for the reference ICDD no. 19-629 [43]. The FTIR spectra
- thickness of 43 nm. In a similar vein, it can be observed from Figure 3c that the PDA/Fe3O4 NPs (4:1 ratio) exhibit an average size of 225 nm, corresponding to a coating thickness of 103.5 nm. The FTIR spectra of Fe3O4 NPs and PDA/Fe3O4 NPs (1:1, 2:1, and 4:1) are given in Figure 3d. The absorption peaks at


Nanocarrier systems loaded with IR780, iron oxide nanoparticles and chlorambucil for cancer theragnostics
Beilstein J. Nanotechnol. 2024, 15, 180–189, doi:10.3762/bjnano.15.17
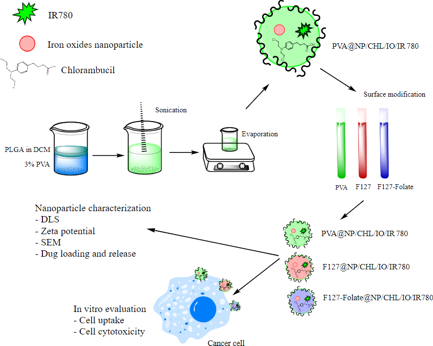
- (FTIR) results were displayed in the Supporting Information File 1 (Supplementary data 1) and Figure S1. Formulation of nanoparticles F127-folate@PLGA/IO/CHL/IR780 and others In 2 mL of DCM, 20 mg of PLGA, 40 μg of IO, 2 mg of CHL, and 0.1 mg of IR780 were mixed. The organic solvent was then added to


Modification of graphene oxide and its effect on properties of natural rubber/graphene oxide nanocomposites
Beilstein J. Nanotechnol. 2024, 15, 168–179, doi:10.3762/bjnano.15.16
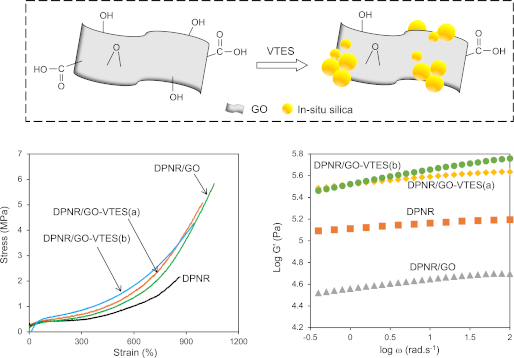
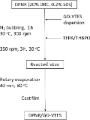
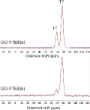
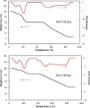
- conditions to determine the ideal condition to modify GO for grafting onto NR. The GO-VTES products were characterized using X-ray diffraction (XRD), contact angle, 29Si NMR, Fourier-transform infrared spectroscopy (FTIR), and morphology analysis. The GO-VTES was expected to improve the mechanical properties
- -VTES(a). Attenuated total reflection–Fourier-transform infrared spectroscopy results The attenuated total reflection–Fourier-transform infrared spectroscopy (ATR–FTIR) results of GO, GO-VTES(a), and GO-VTES(b) are shown in Figure 5. The absorption values ranging from 3100 to 3700 cm−1 corresponded to
- –OH and –COOH groups on the GO surfaces and –OH group on silica particle surfaces [33]. However, the intensities of these signals decreased in the FTIR spectra of GO-VTES(a) and GO-VTES(b). This may be attributed to a decrease in the number of –OH groups of GO due to the reaction with VTES and the






Assessing phytotoxicity and tolerance levels of ZnO nanoparticles on Raphanus sativus: implications for widespread adoptions
Beilstein J. Nanotechnol. 2024, 15, 115–125, doi:10.3762/bjnano.15.11
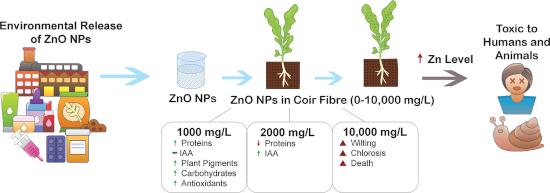
- on Raphanus sativus (R. sativus) concerning its tolerance levels, toxicity, and accumulation. ZnO NPs were synthesized by the wet chemical method and characterized by powder X-ray diffraction (PXRD), Fourier-transform infrared (FTIR) spectroscopy, ultraviolet–visible (UV–vis) spectroscopy, dynamic
- synthesized ZnO NPs were characterized via several techniques such as powder X-ray diffraction (PXRD), Fourier-transform infrared (FTIR) spectroscopy, solid-UV–vis spectroscopy, dynamic light scattering (DLS), and scanning electron microscopy (SEM). Then the potential phytotoxicity of the synthesized ZnO NPs
- to the reflection from (100), (002), (101), (102), (110), (103), (200), (112), and (201) crystal planes of ZnO NPs, respectively. The average size reported in the particle size analyzer for ZnO NPs was 122.4 nm, as shown in Figure 1b, with a polydispersity index of 0.332. The FTIR spectrum of ZnO NPs


Berberine-loaded polylactic acid nanofiber scaffold as a drug delivery system: The relationship between chemical characteristics, drug-release behavior, and antibacterial efficiency
Beilstein J. Nanotechnol. 2024, 15, 71–82, doi:10.3762/bjnano.15.7
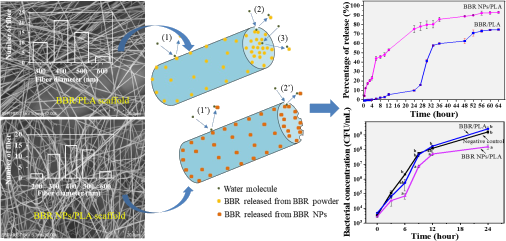
- bonds, Fourier transform infrared spectroscopy (FTIR) was used to examine the differences in chemical characteristics of BBR-loaded PLA nanofiber scaffolds (Figure 2A). The FTIR spectrum of PLA nanofiber scaffold shows the adsorption peaks at 1751 cm−1 resulting from the stretching vibrations of the C=O
- appeared at 1453 and 1358 cm−1. These aforementioned adsorption characteristics of PLA nanofiber scaffolds were also observed in the FTIR spectra of BBR/PLA and BBR NPs/PLA nanofiber scaffolds. However, there was the addition of an intense broadband at 3361 cm−1 in the FTIR spectrum of the BBR NPs/PLA
- the FTIR spectrum of the BBR NPs/PLA nanofiber scaffold. This is evidence that the chemical characteristics of BBR on the BBR NPs/PLA nanofibers were detected more clearly than that of the BBR/PLA nanofibers at the same amount of BBR incorporated into nanofibers, possibly due to the higher


Influence of conductive carbon and MnCo2O4 on morphological and electrical properties of hydrogels for electrochemical energy conversion
Beilstein J. Nanotechnol. 2024, 15, 57–70, doi:10.3762/bjnano.15.6
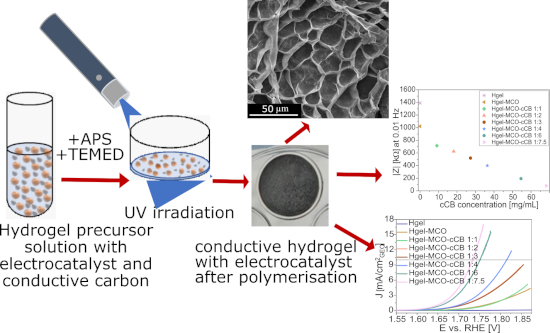
- MCO and cCB particles in the hydrogel precursor solution to obtain a more homogeneous distribution of these particles in the structure of the polymer matrix and on its surface. The Fourier-transform infrared spectroscopy (FTIR) results of the hydrogel compositions and their pure components are shown
- in Figure 3a. The spectra present the strongest characteristic transmittance peaks of PNIPAAm at 3430, 3284, and 3068 cm−1, which are assigned to the N−H stretching of the secondary amine. Peaks at 1637 and 1535 cm−1 can be ascribed to the stretching of the carbonyl group C=O [42][48]. In the FTIR
- spectrum of MnCo2O4, two transmittance bands at 620 and 478 cm−1, characteristic of M–O stretching and vibrations of the spinel structure, were visible (Figure 3b) [49][50]. In the case of super P Li conductive carbon black, no distinct peaks can be seen in the FTIR spectra. However, it is visible that


Curcumin-loaded albumin submicron particles with potential as a cancer therapy: an in vitro study
Beilstein J. Nanotechnol. 2023, 14, 1127–1140, doi:10.3762/bjnano.14.93
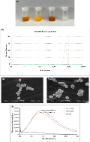
- from CUR within CUR-HSA-MPs. FTIR analyses were used to confirm the chemical binding of CUR to HSA (Figure 3A). The FTIR spectrum of CUR (blue line spectrum) demonstrated bands at 3501 cm−1 (broad, phenolic O–H stretching vibration), 1667 cm−1 (stretching vibrations of the benzene ring of CUR), 1513 cm
- . SEM images were obtained under high-vacuum conditions at an operation voltage of 15 kV. Fourier-transform infrared spectroscopy Chemical characteristics of CUR, HSA, HSA-MPs, and CUR-HSA-MPs were examined using Fourier-transform infrared spectroscopy (FTIR, Thermo Scientific, NICOLET IS5, Waltham, MA
- , USA). CUR was prepared in DMSO, while the particles were prepared by dilution in deionized water. The FTIR spectra were recorded in the range of 400–4000 cm−1 with a resolution of 4 cm−1. Circular dichroism measurements Circular dichroism (CD) spectra of HSA, HSA-MPs, and CUR- HSA-MPs were recorded




Isolation of cubic Si3P4 in the form of nanocrystals
Beilstein J. Nanotechnol. 2023, 14, 971–979, doi:10.3762/bjnano.14.80
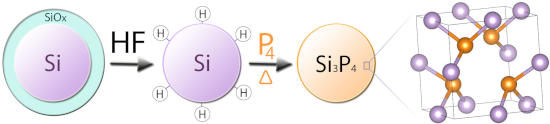
- nanoparticles with a defective zinc blende structure under mild conditions through thermal annealing of hydrogenated silicon nanoparticles with red phosphorus. The synthesized Si3P4 nanoparticles were analyzed using FTIR, XRD, electron diffraction, EDX, TEM, Raman spectroscopy, X-ray fluorescence spectrometry
- FTIR spectroscopy of the etching product are shown in Figure 1). The bands with the wavenumbers of 2105 and 2900 cm−1, and the broad signal at 3400 cm−1 were attributed to vibrations of Si–H, C–H, and O–H bonds, respectively [25]. The IR spectra of the unetched Si NPs display bands in a wavenumber
- was shown to be consistent with Si–H bond cleavage and hydrogen desorption from silicon surfaces [29] (including Si NPs [30]) with the bond completely disappearing at 700 °C as indicated by FTIR spectra [31][32][33]. A temperature of 900 °C was chosen to assess the probability of formation of another


Upscaling the urea method synthesis of CoAl layered double hydroxides
Beilstein J. Nanotechnol. 2023, 14, 927–938, doi:10.3762/bjnano.14.76
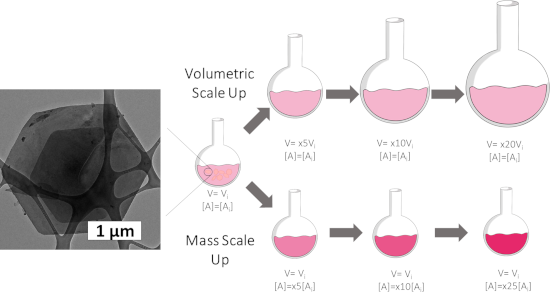
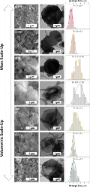
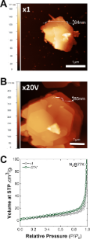
- spectroscopic techniques (ATR-FTIR, UV–vis, XPS, ICP-MS, and XANES-EXAFS). In the case of the volumetric scale-up, a reduction of 45% in the lateral dimensions of the crystals (from 3.7 to 2.0 µm) is observed as the reaction volume increases. This fact is related to modified heating processes affecting the
- and Figure S2, Supporting Information File 1). Table S1 summarizes the values of dBS and parameter a for all samples. Attenuated total reflectance Fourier-transform infrared spectroscopy (ATR-FTIR) provides valuable information about the nature of the layered hydroxide structure and the intercalated
- total reflectance Fourier-transform infrared spectroscopy (ATR-FTIR) spectra were collected on a Bruker alpha II FTIR spectrometer in the 4000–400 cm−1 range. X-ray photoelectron spectroscopy (XPS) measurements were recorded on a Thermo Scientific™ K-alpha X-ray photoelectron spectrometer. Al Kα


A wearable nanoscale heart sound sensor based on P(VDF-TrFE)/ZnO/GR and its application in cardiac disease detection
Beilstein J. Nanotechnol. 2023, 14, 819–833, doi:10.3762/bjnano.14.67
- generally associated with better piezoelectric performance of the material. To further validate the enhancement of the β phase, Fourier-transform infrared (FTIR) analysis was conducted (Figure 7a). The FTIR spectrum of the piezoelectric film exhibited distinct absorption bands. Peaks observed at 600, 763
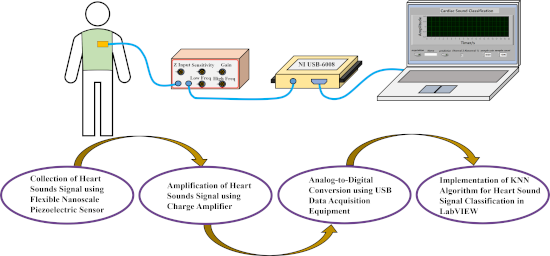
- sensor packaging. Actual sensor. Acoustic-electric conversion performance test platform. Block diagram of the heart sound acquisition and classification system. XRD patterns of the three composite piezoelectric nanofilms. (a) FTIR spectrum and (b) variation curve of β-phase content. (a) SEM image of the


Nanostructured lipid carriers containing benznidazole: physicochemical, biopharmaceutical and cellular in vitro studies
Beilstein J. Nanotechnol. 2023, 14, 804–818, doi:10.3762/bjnano.14.66
- 410 °C, and BNZ degradation occurred in the 190–300 °C range. Considering these processes, nanoparticle thermal behavior might be attributed first to lipid degradation, and second to poloxamer weight loss. The attenuated total reflection Fourier-transform infrared spectroscopy (ATR-FTIR) technique was
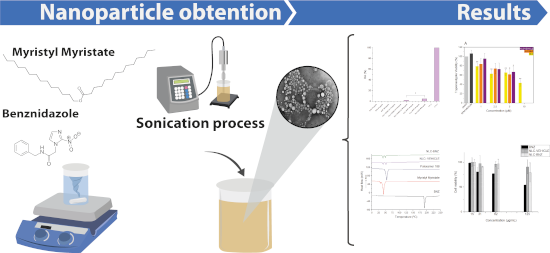
- tests. Statistical significance was set at p < 0.05. TEM image of NLC-BNZ. DSC thermograms of BNZ, myristyl myristate, poloxamer 188, NLC VEHICLE, and NLC-BNZ. Thermogravimetric (A) and derivative thermogravimetric (B) curves of BNZ, myristyl myristate, poloxamer 188, NLC-VEHICLE, and NLC-BNZ. ATR-FTIR