Search results
Search for "roughness" in Full Text gives 478 result(s) in Beilstein Journal of Nanotechnology. Showing first 200.
Influence of dielectric layer thickness and roughness on topographic effects in magnetic force microscopy
Beilstein J. Nanotechnol. 2019, 10, 1056–1064, doi:10.3762/bjnano.10.106

- roughness of dielectric films with increasing film thickness. Keywords: capacitive coupling; electrostatic effects; magnetic force microscopy; nanoparticles; superparamagnetic iron oxide nanoparticle (SPION); Introduction MFM has become an important tool for studying magnetic properties of surface
- . The theoretical model described in this paper also predicts decreasing topographic effects in MFM signals due to surface roughness of dielectric films with increasing film thickness. Theory Capacitive coupling effects in MFM on nanoparticles In our previous work we proposed a theory of a capacitive
- . Capacitive coupling effects in MFM on rough surfaces The considerations about capacitive coupling effects on nanoparticles can be generalized assuming rough surfaces depicted in Figure 4a. The distance changes between tip and substrate in the interleave mode due to the surface roughness (measured in the


![[Graphic 2]](/bjnano/content/inline/2190-4286-10-106-i7.svg?max-width=637&scale=1.18182) ; black line) and measured phase shift for single nanoparticles with 10 ± 2 nm diameter...
; black line) and measured phase shift for single nanoparticles with 10 ± 2 nm diameter...


Concurrent nanoscale surface etching and SnO2 loading of carbon fibers for vanadium ion redox enhancement
Beilstein J. Nanotechnol. 2019, 10, 985–992, doi:10.3762/bjnano.10.99

- spectra. The large carbon surface oxidation current observed for TGP-CSnPc-650Air implied the development of high surface roughness. Redox reactions of vanadium ions The CVs in the potential ranges corresponding to the positive and negative electrode reactions in an acidic electrolyte containing vanadium


In situ AFM visualization of Li–O2 battery discharge products during redox cycling in an atmospherically controlled sample cell
Beilstein J. Nanotechnol. 2019, 10, 930–940, doi:10.3762/bjnano.10.94

- 1 ppm [42]. Glassy carbon was laser cut into 12 mm diameter discs. The surface of the glassy carbon was polished [43] to an average root-mean-square roughness of less than 10 nm. Upon polishing, the glassy carbon was cleaned with isopropyl alcohol and deionized water and further dried in a vacuum


Rapid, ultraviolet-induced, reversibly switchable wettability of superhydrophobic/superhydrophilic surfaces
Beilstein J. Nanotechnol. 2019, 10, 866–873, doi:10.3762/bjnano.10.87

- MERLIN Compact SEM, operated at a 20 kV acceleration voltage, Carl Zeiss Jena, Germany), and the surface roughness was measured with a laser confocal microscope (LCM, OLS5000, Olympus, Japan). The chemical modification and the end group changes on the surfaces was studied by Fourier transform infrared


Novel reversibly switchable wettability of superhydrophobic–superhydrophilic surfaces induced by charge injection and heating
Beilstein J. Nanotechnol. 2019, 10, 840–847, doi:10.3762/bjnano.10.84

- Figure 2a and Figure 2b, respectively. It is obvious that after spraying, the glass-slide surface became rough with a large number of particles that formed irregular micro- and nanoscale composite structures, which increased the roughness of the coating surface and changed the wettability of the coating


Features and advantages of flexible silicon nanowires for SERS applications
Beilstein J. Nanotechnol. 2019, 10, 725–734, doi:10.3762/bjnano.10.72

- are predominantly the characteristic surface roughness and the chemical affinity. Generally, the hydrophilic substrate surface is desirable for hydrophilic molecules such as for example dextrose and albumin [41]. SERS sensing of 4-MPBA In order to determine the optimal Ag-sputtering time, we measured


Ultrathin hydrophobic films based on the metal organic framework UiO-66-COOH(Zr)
Beilstein J. Nanotechnol. 2019, 10, 654–665, doi:10.3762/bjnano.10.65

- position and cover MOF particles. Moreover, the presence of MOF particles significantly enhances the surface roughness and allows ultrathin, hydrophobic coverage to be obtained. Finally, it has been shown that the crystallinity and the porosity of the MOF remains almost unaltered in MOF/ODP films
- structure of the pure ODP films seems to be preserved in mixed MOF/ODP films and, in addition, MOF sMPs can be also observed. The presence of MOF particles significantly increases the roughness of the film (pure ODP LB film RMS values are close to 6 nm, while mixed films present RMS values between 40 and 60
- an almost vertical position, and MOF sMPs, covered by ODP molecules, distributed over the whole surface, providing an elevated roughness to the mixed films that significantly contributes to increase the value of the water contact angle. Moreover, the crystallinity of the MOF particles is preserved in


Topochemical engineering of composite hybrid fibers using layered double hydroxides and abietic acid
Beilstein J. Nanotechnol. 2019, 10, 589–605, doi:10.3762/bjnano.10.60

- increase the surface roughness of the fibers and yield good adhesion properties. Bleached and unbleached fibers, refined and unrefined, were used as starting materials to synthesize direct composites (AA + fiber), hybrid fibers (LDH + fiber) and composite hybrid fibers (AA + LDH + fiber). We expect that


Biomimetic synthesis of Ag-coated glasswing butterfly arrays as ultra-sensitive SERS substrates for efficient trace detection of pesticides
Beilstein J. Nanotechnol. 2019, 10, 578–588, doi:10.3762/bjnano.10.59

- successfully fabricated by magnetron sputtering. The thickness of the Ag nanofilms can be well controlled by adjusting the sputtering time. The Ag-G.b.-20 substrate with large-scale “hot spots” and an increased roughness shows the highest enhancement efficiency for CV molecules. The EF for Ag-G.b.-20 arrays is


Nanocomposite–parylene C thin films with high dielectric constant and low losses for future organic electronic devices
Beilstein J. Nanotechnol. 2019, 10, 428–441, doi:10.3762/bjnano.10.42

- modifies the film density as well as the degree of crystallinity and the size of parylene C crystallites. Moreover, silver is incorporated in the parylene matrix as an oxide phase. The average size of the Ag oxide nanoparticles is lower than 20 nm and influences the roughness of the NCPC films. Samples
- work [64]. The roughness of different NCPC samples was measured by AFM and displayed in Table 2. In the case of pure parylene films (samples K and O), the surface is relatively smooth and the roughness is around 10 nm. It has to be noted that the plasma-induced increase of the deposition rate does not
- change the film roughness. When Ag is incorporated in the parylene matrix, the films become increasingly rough with increasing Ag amount, the roughness increasing from 20–25 nm for samples A, B and D to more than 50 nm for samples C, E and F. Even if it has been previously shown that an increase in


Advanced scanning probe lithography using anatase-to-rutile transition to create localized TiO2 nanorods
Beilstein J. Nanotechnol. 2019, 10, 412–418, doi:10.3762/bjnano.10.40

- contrast, local light scattering, high-resolution surface roughness gradients or microchannels. This set of extensions for rutile TiO2 nanorod applications is a valuable toolkit for lab-on-a-chip devices [33][34][35]. Recently, we investigated the influence of rutile seed layers on the growth and shape of
- surface roughness of the anatase TiO2 film causes a dithering movement of the tip that broadens the line width. This effect disconnects the line width from the shape of the tip partly. The density of nanorods is controlled slightly with the number of repetitions. In Figure 4C, the density was increased


Biocompatible organic–inorganic hybrid materials based on nucleobases and titanium developed by molecular layer deposition
Beilstein J. Nanotechnol. 2019, 10, 399–411, doi:10.3762/bjnano.10.39

- for 15 minutes was measured by atomic force microscopy (AFM) (Figure 8). All as-deposited films exhibit high surface roughness; however, the roughness of the Ti-adenine film is caused by small islands appearing on an otherwise almost flat surface. After water treatment, the surface roughness decreases
- drastically for all three systems and leaves an almost flat surface, except for the Ti-uracil system, where holes with a distinct pattern were observed. This system was also studied more closely with SEM after water treatment (Figure 9a). This SEM image also shows a low surface roughness; however, there is no


Removal of toxic heavy metals from river water samples using a porous silica surface modified with a new β-ketoenolic host
Beilstein J. Nanotechnol. 2019, 10, 262–273, doi:10.3762/bjnano.10.25

- volume to 0.62 ± 0.01 cm3·g−1 for SiNL. The increase of SBET to 339.84 ± 2.01 m2·g−1 for SiNL is presumably due to the increasing surface roughness, as noticed by SEM imaging (Figure 2), or due to the pore plugging of the support by the ligand. Solid–liquid adsorption of metal ions by SiNL Effect of pH


Interaction of Te and Se interlayers with Ag or Au nanofilms in sandwich structures
Beilstein J. Nanotechnol. 2019, 10, 238–246, doi:10.3762/bjnano.10.22

- deposited with a Ge interlayer – they cannot be observed at angles greater than 2° for silver films and 4° for gold films. This indicates a much higher surface roughness than for the Ge-wetted films. Metal layers deposited on Se exhibit an even worse adhesion – there is almost no change in the grain size
- have segregated to the surface. The poor wetting (or even dewetting) of silver by Se and Te has one more attribute. The intensity of the modified Lorentz band [37] centered at 275–300 nm decreased while the intensity of the bands from 325 to 400 nm increased. The latter are connected to the roughness
- of the layer (so the intensity would naturally increase with increased roughness) [26], but also to the interband transitions at the L-point in the Brillouin zone, while the former is connected to the interband transitions at the X-point in the Brillouin zone [38][39]. As the carriers at the X-point


Sputtering of silicon nanopowders by an argon cluster ion beam
Beilstein J. Nanotechnol. 2019, 10, 135–143, doi:10.3762/bjnano.10.13

- target density. The energy dependence demonstrated an unusual non-monotonic behavior. At 17.3 keV a maximum of the sputtering yield was observed, which was more than forty times higher than that of the bulk Si. The surface roughness at low energy demonstrates a similar energy dependence with a maximum
- surface, with energy in the range of 10.4–69 keV and dose of 7.2 × 10¹⁴–2.3 × 10¹⁶ cluster/cm2 at room temperature. The sputtering depth and surface roughness RRMS (root mean squared roughness) were monitored by AFM with a Shimadzu SPM-9500 J3 device, operated in tapping mode with a measuring area of 7
- huge increase of the surface roughness after the bombardment, from an initial roughness RRMS = 6.7 nm up to a few hundreds of nanometers, which complicates the depth measurement by AFM. We explain the increase of the sputtering yield of the nanopowder sample, in comparison with the bulk Si, by the


Scanning probe microscopy for energy-related materials
Beilstein J. Nanotechnol. 2019, 10, 132–134, doi:10.3762/bjnano.10.12

- interfaces is therefore essential. Furthermore, these interface phenomena are strongly linked to material properties such as grain size, roughness, mechanical properties and work function. In an attempt to address the diversity of phenomena on the nanoscale, scanning probe microscopy (SPM) methods play an
Pull-off and friction forces of micropatterned elastomers on soft substrates: the effects of pattern length scale and stiffness
Beilstein J. Nanotechnol. 2019, 10, 79–94, doi:10.3762/bjnano.10.8

- . The decreased Eeff of a fibrillar geometry also leads to decreased contact stiffness [11] and higher conformability to substrate roughness [12]. The abovementioned effects of fibrillary geometries can be further enhanced with altering the pillar geometry. For example, Gorb et al. fabricated
- micropillars of 100 μm height and a stem diameter of 60 μm, terminated with a thin (2 μm) disc of 40 μm in diameter [11]. These so-called mushroom-shaped micropillars generated higher pull-off forces than flat-punch micropillars, a phenomenon attributed to a higher adaptability to substrate roughness due to
- microstructure is not considerably lower than that of coarser microstructure [14]. Greiner et al. found that with increasing aspect ratio of micropattern features, their compliance increases, resulting in a better conformability to substrate roughness [20]. Hierarchical geometries, that is, architectures with


A comparison of tarsal morphology and traction force in the two burying beetles Nicrophorus nepalensis and Nicrophorus vespilloides (Coleoptera, Silphidae)
Beilstein J. Nanotechnol. 2019, 10, 47–61, doi:10.3762/bjnano.10.5

- attachment with respect to various surface properties was investigated by using a 2 × 3 experimental design. Traction force was measured for two different surface energies (hydrophilic vs hydrophobic) varying in roughness from smooth to micro-rough to rough. Nanotribometric tests on single legs were also
- smooth and rough surfaces with clipped claws. Both species demonstrated poor traction forces on micro-rough surfaces. Results concerning the impact of surface polarity were inconclusive, whereas roughness more strongly affected the attachment performance in both species. Nanotribometric analyses of the
- . nepalensis, have recently been proposed as a potential reason for these observed differences, especially on smooth surfaces [3]. Surface roughness is known to affect attachment performance in insects, spiders and geckos [9][10][11][12][13][14], whereby often so-called critical roughness values have been


Zn/F-doped tin oxide nanoparticles synthesized by laser pyrolysis: structural and optical properties
Beilstein J. Nanotechnol. 2019, 10, 9–21, doi:10.3762/bjnano.10.2

- bandgap, grain size, oxygen deficiency, surface roughness, and impurity centers [21]. The direct bandgaps of the nanoparticles were determined from the Tauc relation [50][51][52] given by: where α is the absorption coefficient, A is a constant, hν is the photon energy, n is an index that can take


Contact splitting in dry adhesion and friction: reducing the influence of roughness
Beilstein J. Nanotechnol. 2019, 10, 1–8, doi:10.3762/bjnano.10.1

- , stronger adhesion, and a more uniform stress distribution with higher tolerance to defects. However, while it is widely believed that contact splitting helps to mitigate the negative effects of roughness on adhesion- and friction-based attachment, no decisive experimental validation of this hypothesis has
- been performed so far for thin-film-based adhesives. To this end, we report on the behavior of original and split, wall-shaped adhesive microstructures on different surfaces ranging across four orders of magnitude in roughness. Our results clearly demonstrate that the adhesion- and friction-driven
- attachment of the wall-shaped microstructure degrades, regardless of the surface waviness, when the surface roughness increases. Second, splitting the wall-shaped microstructure indeed helps to mitigate the negative effect of the increasing surface unevenness by allowing the split microstructure to adapt


Electrolyte tuning in dye-sensitized solar cells with N-heterocyclic carbene (NHC) iron(II) sensitizers
Beilstein J. Nanotechnol. 2018, 9, 3069–3078, doi:10.3762/bjnano.9.285

- electrolyte. The constant phase element was employed in this study because of the surface roughness [51][52]. We chose to focus on understanding the observations involving the MBI additive, and EIS studies were conducted for electrolytes E2b, E2c and E2e. Measurements and curve fitting were made for duplicate


Femtosecond laser-assisted fabrication of chalcopyrite micro-concentrator photovoltaics
Beilstein J. Nanotechnol. 2018, 9, 3025–3038, doi:10.3762/bjnano.9.281
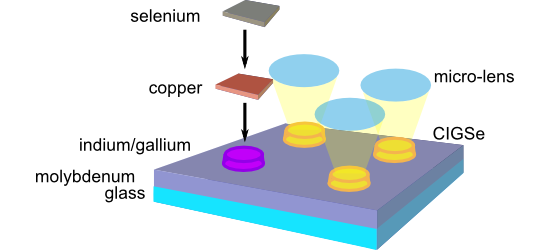
- indium accumulation occurs at the spot centers, which exhibit the highest roughness, indicates that the island growth is driven by the condensation of indium in the capillary-like structures. For the desired growth of flat and homogeneous indium islands, the data shows that a moderate roughening of the
- , left column, top) with a depth of about 300 nm in the center and a roughness Ra of about 25 nm averaged over the whole area (Figure 6, left column, bottom). In general, the diameter of indium islands, the geometrical aspect ratio and the nucleation density of indium islands all depend on the deposition


Ternary nanocomposites of reduced graphene oxide, polyaniline and hexaniobate: hierarchical architecture and high polaron formation
Beilstein J. Nanotechnol. 2018, 9, 2936–2946, doi:10.3762/bjnano.9.272

- shown in Figure 2. AFM images of the rGO-25 sample show particles of well-defined edges and size ranging from 5 to 25 μm. The height profile (Figure 2, right column) shows thickness of ca. 1.0 nm and a surface roughness (RMS) of 0.24 nm for the rGO flake. These results clearly indicate the presence of
- hand, this nanocomposite presents several creases and folds and, more interestingly, shows higher flake thickness and higher surface roughness (ca. 10 and ca. 4.0 nm, respectively). These results clearly indicate that the deposition of PANI on rGO flakes induces an increase of the surface heterogeneity
- . Analogously, the AFM images of rGO/PANI/hexNb also indicate the presence of large flakes in the nanocomposite and, as shown by the 5 μm scan-size image (and corresponding height profile), the flake thickness and surface roughness are ca. 19 and ca. 7.2 nm, respectively. These results clearly indicate that the


In situ characterization of nanoscale contaminations adsorbed in air using atomic force microscopy
Beilstein J. Nanotechnol. 2018, 9, 2925–2935, doi:10.3762/bjnano.9.271

- , about 1 nm mean roughness, see for example [47]). A few higher structures (3–4 nm height) can be recognized in the topographic images. Interestingly only one of these higher structures gives a contrast in the contact-potential image (Figure 2Ce, −90 mV as compared to +70 mV for the substrate), otherwise


Site-controlled formation of single Si nanocrystals in a buried SiO2 matrix using ion beam mixing
Beilstein J. Nanotechnol. 2018, 9, 2883–2892, doi:10.3762/bjnano.9.267

- fluence is too small (see Figure 3a), insufficient mixing occurs and consequently only poorly defined NCs are formed. A too high fluence, on the other hand, will result in Si NC formation, but the interface roughness increases (see Figure 3b). The phase separation process during post-irradiation thermal
- beam mixing conditions (170 Si+ nm−2 at 60 keV) a too small TB (1323 K, 30 s) results in incomplete (see Figure 3c) or no NC formation while a too high TB (1323 K, 240 s) will result in the decomposition of the earlier formed NCs and an increased interface roughness (see Figure 3d). Complete


