Search results
Search for "TEM" in Full Text gives 773 result(s) in Beilstein Journal of Nanotechnology. Showing first 200.
A comprehensive review on electrospun nanohybrid membranes for wastewater treatment
Beilstein J. Nanotechnol. 2022, 13, 137–159, doi:10.3762/bjnano.13.10


Theranostic potential of self-luminescent branched polyethyleneimine-coated superparamagnetic iron oxide nanoparticles
Beilstein J. Nanotechnol. 2022, 13, 82–95, doi:10.3762/bjnano.13.6

- synthesized luminescent SPION@bPEI was published by Unal et al. in 2018 [35]. The total organic content of the particles was determined to be 76% by TGA. The average crystal size of SPION@bPEI nanoparticles was measured from transmission electron microscopy (TEM) images to be approx. 6 nm (Figure 1a). The TEM
- images related to polymer-coated magnetic nanoparticles show that these nanoparticles seem to be agglomerated, which is due to the protruding of near particles under vacuum. It is difficult to see the PEI polymer coating around the crystal by TEM. However, it is possible to distinguish the polymer
- performed at magnetic mode indicated particles of approx. 20 nm in size, which suggests a slight particle aggregation (Figure 1b). According to the literature, it is usually not uncommon to obtain different results using AFM and TEM analysis. However, due to a higher resolution and material-related


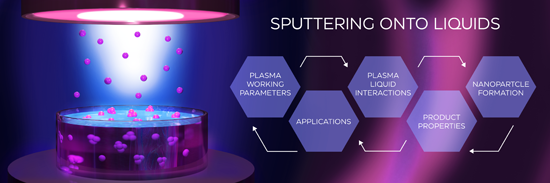
Sputtering onto liquids: a critical review
Beilstein J. Nanotechnol. 2022, 13, 10–53, doi:10.3762/bjnano.13.2
- electron microscopy (TEM), it was shown that the Au sol formation process consists of an induction period followed by a rapid increase in the number of particles, followed by a linear increase, followed by a rapid decrease in the growth rate. In other words, the typical kinetic curve has a sigmoidal S


Measurement of polarization effects in dual-phase ceria-based oxygen permeation membranes using Kelvin probe force microscopy
Beilstein J. Nanotechnol. 2021, 12, 1380–1391, doi:10.3762/bjnano.12.102

- -conductive phase and 40 vol % FeCo2O4 as electron-conductive phase was synthesized. TEM measurements showed a relatively pure dual-phase material with only minor amounts of a tertiary (Sm,Ce)(Fe,Co)O3 perovskite phase and isolated residues of a rock salt phase at the grain boundaries. The obtained material
- , KPFM measurements were started with an imaging velocity of 1 image per minute to measure the relaxation of the introduced gradient. Electron microscopy The TEM specimens were cut from 60CSO20-FC2O pellets by focused ion beam (FIB) milling using a FEI Strata400 system with Ga ion beam. Further thinning
- and cleaning were performed with an Ar ion beam in a Fischione Nanomill 1040 at 900 eV and 500 eV beam energy, respectively. TEM and energy-filtered TEM (EFTEM) imaging were performed with a FEI Tecnai F20 at 200 kV. High-resolution HAADF imaging and energy-dispersive X-ray (EDX) chemical mapping were


Chemical vapor deposition of germanium-rich CrGex nanowires
Beilstein J. Nanotechnol. 2021, 12, 1365–1371, doi:10.3762/bjnano.12.100

- nanoobjects were studied by transmission electron microscopy (TEM) performed on a Philips CM 120 (LaB6, 120 kV) equipped with a NanoMEGAS precession unit DigiStar, an Olympus SIS CCD camera Veleta (2048 × 2048 px), and a windowless detector Apollo XLTW for EDX measurements. Selected area electron diffraction


Biocompatibility and cytotoxicity in vitro of surface-functionalized drug-loaded spinel ferrite nanoparticles
Beilstein J. Nanotechnol. 2021, 12, 1339–1364, doi:10.3762/bjnano.12.99

- phase of the samples is consistent with the XRD results. The formation of spherical NPs was confirmed by transmission electron microscopy (TEM) (Figure 2a). The nanospheres are uniformally distributed throughout the surface of the samples. High-resolution transmission electron microscopy (HR-TEM) images


Plasmon-enhanced photoluminescence from TiO2 and TeO2 thin films doped by Eu3+ for optoelectronic applications
Beilstein J. Nanotechnol. 2021, 12, 1271–1278, doi:10.3762/bjnano.12.94

- investigated by SEM and TEM, while the composition of oxides film was analyzed by XPS. Luminescence properties were studied on the basis of excitation and emission spectra. The experiments show that the additional dielectric layer enhances the luminescence intensity. Such structures could be potential
- examined by SEM and TEM. The SEM image presented in Figure 2a shows a good uniformity of the prepared Au nanostructures. Nanoislands cover the whole substrate surface. Additionally, the HRTEM image of a cross section of a single nanoisland is shown in Figure 2b [25][26]. It can be seen, that the


Morphology-driven gas sensing by fabricated fractals: A review
Beilstein J. Nanotechnol. 2021, 12, 1187–1208, doi:10.3762/bjnano.12.88

- -assisted chemical etching was used by Qin et al. [79] to prepare a dendritic array of Si/WO3 NW composites, which was tested for the detection of NO2 gas at room temperature. Figure 17a–e SEM and high-resolution transmission electron microscopy (HR-TEM) images of Si/WO3 NWs. Figure 17f shows the XRD
- gas molecules to penetrate the sensor more easily. The response and recovery times for a small concentration of HCOOH (ca. 50 ppm) was reported to be ca. 27 s and 21 s at 260 °C, respectively. Figure 21a–e shows SEM, TEM and HR-TEM images of the CdS dendrites. The CdS dendrites were shown to have
- 2–3 µm length) by a hydrothermal method and calcined the fabricated nanostructure precursors in air [84]. Figure 23a–f shows SEM and TEM micrographs with selected-area electron diffraction (SAED) patterns of the Co3O4 nanostructures. Hydrogen peroxide (H2O2) was detected by an electrochemical sensor


pH-driven enhancement of anti-tubercular drug loading on iron oxide nanoparticles for drug delivery in macrophages
Beilstein J. Nanotechnol. 2021, 12, 1127–1139, doi:10.3762/bjnano.12.84

- File 1, Table S1). Characterization of uncoated iron oxide nanoparticles and NOR Uncoated iron oxide nanoparticles (UIONPs) exhibited a hydrodynamic diameter (from DLS) greater than 1000 nm, which was due to the aggregation of ≈10 nm individual UIONPs, as observed by TEM (Figure 2a,b). The size
- COOH, NH (quinolone), C=O, CH and NH (piperazine) vibrations, respectively [36]. Characterization of NOR-coated IONPs, coated at pH 5 NOR@IONP, coated at pH 5 (NOR@IONPpH5), exhibited a distribution size range of 45 to 110 nm (Figure 3a), which was confirmed by TEM, to be aggregates of 10–12 nm size
- . Characterization of NOR-coated iron oxide nanoparticle coated at pH 10 NOR@IONP coated at pH 10 (NOR@IONPpH10), had a size distribution ranging from 25 to 120 nm, as examined through DLS (Figure 4a). TEM further confirmed these to be aggregates of 10–13 nm sized individual nanoparticles (Figure 4b). The FWHM was


Assessment of the optical and electrical properties of light-emitting diodes containing carbon-based nanostructures and plasmonic nanoparticles: a review
Beilstein J. Nanotechnol. 2021, 12, 1078–1092, doi:10.3762/bjnano.12.80

- of 20 mA/cm2. Similarly, the roles of Ag-doped ZnO and pristine ZnO as EIL in the imidazole organic EML-based HyLED were compared [61]. The transmission electron microscopy (TEM) images of Figure 8 illustrate that the pristine ZnO NP are larger (≈50 nm) than the Ag-doped ZnO (≈15 nm). In addition
- on ITO glass. The inset shows the TEM image of AuNP with a particle size of 20 nm. (c) The electromagnetic field distribution around AuNP with 20 nm diameter simulated by finite-difference time-domain modelling. Figure 6a–c was adapted from [51] (© 2018 J. Feng et al., distributed under the terms of


Revealing the formation mechanism and band gap tuning of Sb2S3 nanoparticles
Beilstein J. Nanotechnol. 2021, 12, 1021–1033, doi:10.3762/bjnano.12.76

- different reaction time points were characterized by transmission electron microscopy (TEM, Figure 1a–c) and scanning electron microscopy (SEM, Figure 1d–f). The images show that small nanoparticles (type I) were formed about 2 min (Figure 1a) after injecting the antimony precursor Sb-EHA. The bright orange
- the shape, but no individual type I nanoparticles could be identified anymore in TEM at this stage. Also, the type II nanoparticles appeared to have formed superordinate structures (type III). Such multistep hierarchical growth mechanisms have already been observed for different materials, such as
- after 30 h within the measurement uncertainties (5.5 ± 1.9 µm and 5.4 ± 1.6 µm). Histograms of the length and width distribution of the crystalline particles obtained after 16 h, 18 h, and 30 h can be found in Figure S3 in Supporting Information File 1. TEM images of growing rods show layered structures


Progress and innovation of nanostructured sulfur cathodes and metal-free anodes for room-temperature Na–S batteries
Beilstein J. Nanotechnol. 2021, 12, 995–1020, doi:10.3762/bjnano.12.75


A Au/CuNiCoS4/p-Si photodiode: electrical and morphological characterization
Beilstein J. Nanotechnol. 2021, 12, 984–994, doi:10.3762/bjnano.12.74

- transmission electron microscopy (HR-TEM), and energy-dispersive X-ray spectroscopy (EDS). The XRD, EDS, and HR-TEM analyses confirmed the successful synthesis of CuNiCoS4. The obtained CuNiCoS4 thiospinel nanocrystals were tested for photodiode and capacitance applications as interfacial layer between Au and
- characteristics of the photodiode after inserting CuNiCoS4 nanocrystals as interlayer between Au metal and p-Si were investigated. The aim is to obtain more powerful photodiodes by using a new type of interlayer material. XRD, HR-TEM, and SEM analyses were carried out to characterize the thiospinel CuNiCoS4
- -Si. The interfacial layer might increase the barrier height between the Au and p-Si. Characterization XRD patterns of the thiospinel CuNiCoS4 nanocrystals were recorded with a Bruker D8 diffractometer, Cu Kα radiation (λ = 0.15418 nm). A FEI TALOS F200S tunneling electron microscope (TEM) was used to


Is the Ne operation of the helium ion microscope suitable for electron backscatter diffraction sample preparation?
Beilstein J. Nanotechnol. 2021, 12, 965–983, doi:10.3762/bjnano.12.73

- , defects such as interstitials or vacancies can be created [23]. This can induce a significant amount of crystal structure alterations in a sample and thus artefacts. While these artefacts are well recognized for transmission electron microscopy (TEM) lamella preparation, in which the lamella preparation
- steps are designed to reduce the thickness of the amorphous layer on each side of the TEM lamella and to minimize artefacts [24], procedures and induced artefacts for other techniques such as electron backscatter diffraction (EBSD) polishing are not well documented in the literature. The work presented
- species than Ga for EBSD sample preparation. Cu has been previously reported to phase transform under Ga FIB polishing and conventional Cu TEM grids are, therefore, used here as a test material and are polished using Ga and Ne ions of different energies, incident angles, and ion doses. Both normal and


The role of deep eutectic solvents and carrageenan in synthesizing biocompatible anisotropic metal nanoparticles
Beilstein J. Nanotechnol. 2021, 12, 924–938, doi:10.3762/bjnano.12.69

- toxic and considered biologically inert [44][57][58]. Numerous in vitro studies carried out using high-throughput techniques such as microscopic techniques, TEM, and ICP-MS revealed the fate of nanoparticles and their interaction at the interface between the metal surface and cell membrane. Electron
- distribution of nanoparticles. (B), (C) and (D) show TEM micrographs of the nanoparticles at different magnifications. (E) and (F) show the antitumor activity against MDA-MB-231 and HCT-116. Adapted from [32], © 2018 X. Chen et al., distributed under the terms of the Creative Commons Attribution 4.0


Modification of a SERS-active Ag surface to promote adsorption of charged analytes: effect of Cu2+ ions
Beilstein J. Nanotechnol. 2021, 12, 902–912, doi:10.3762/bjnano.12.67

- were analyzed from SEM and TEM images. To achieve a better resolution during SEM, we utilized a conductive silicon support and excluded the metal coating of the sample; Ag NPs were placed on the silicon surface by adsorptive immobilization to avoid aggregation during solvent evaporation. Figure 1 shows
- an SEM image of the NPs as well as the corresponding size distribution histogram. A similar TEM image (Figure S1, Supporting Information File 1) shows fewer nanoparticles and is therefore less reliable. Both methods give NP diameters in the interval of 30–35 nm. According to the SEM image, the NPs
- are mostly spherical with an average diameter of 33 nm. SEM and TEM images demonstrate a similar size distribution. Hence, we conclude that no NP size selection occurs during their adsorptive immobilization. The absorption spectrum of the Ag NPs (Figure S2, Supporting Information File 1) is in good


Silver nanoparticles nucleated in NaOH-treated halloysite: a potential antimicrobial material
Beilstein J. Nanotechnol. 2021, 12, 798–807, doi:10.3762/bjnano.12.63

- . Transmission electron microscopy (TEM) was performed in a Jeol JEM-1400 plus (480 keV), energy-dispersive X-ray spectroscopy (EDS) and scanning electron microscopy (SEM) in a Zeiss EVO MA15, and thermogravimetric analysis (TGA) and differential scanning calorimetry (DSC) in a simultaneous thermal analyzer
- , and HNT-8 were recorded with TEM, while sample HNT-8 was also measured with XRD. (XRD was also performed for HNT-0 and HNT-4 but omitted from this report because it did not show any significant difference from HNT-8). Silver nanoparticle synthesis To synthesize silver nanoparticles, 10 g of HNT (from
- metallic silver. They were then labelled Ag/HNT-0, Ag/HNT-4, and Ag/HNT-8 (according to the NaOH treatment), and characterized by TEM and EDS. Sample Ag/HNT-8 was also characterized by XRD. Ag-NPs nucleation analysis In order to study the nucleation of silver nanoparticles, 1 g of Ag/HNT-8 was used for TGA


Fate and transformation of silver nanoparticles in different biological conditions
Beilstein J. Nanotechnol. 2021, 12, 665–679, doi:10.3762/bjnano.12.53

- absorption spectroscopy (GF-AAS), nuclear magnetic resonance (NMR) spectroscopy, and transmission electron microscopy (TEM) experiments. Physicochemical characteristics of freshly prepared AgNPs Freshly prepared AgNPs coated with PVP, sodium bis(2-ethylhexyl)sulfosuccinate (AOT), and poly(ʟ-lysine) (PLL
- ) were dispersed in ultrapure water (UPW) and examined by TEM to confirm their original morphology. These coating agents were selected according to their relevance in biomedicine, as they are the most frequently used stabilization agents for AgNPs according to the Web of Science database [41]. Moreover
- regarded as an extension of our previous work [40]. In addition, liver tissues of control (untreated) and treated animals were prepared for TEM analysis, which revealed quite surprising observations. While TEM images obtained for control animals conformed to classical histological features of liver tissue


A review of defect engineering, ion implantation, and nanofabrication using the helium ion microscope
Beilstein J. Nanotechnol. 2021, 12, 633–664, doi:10.3762/bjnano.12.52

- beam milling that were inspected by transmission electron microscopy (TEM). In this way, the microstructural effect of increasing the helium ion-induced defect density was probed, and threshold doses for a series of structural changes, such as amorphization and subsurface swelling, were established
- function [30]. In several of these works, high-resolution scanning TEM (STEM) imaging has been performed to enable the analysis of the defects created on the atomic scale [26][29][30] (see, e.g., Figure 2c). Apart from 2D materials, thin-film samples have also been the subject of electronic property tuning
- modify the mechanical, electronic, and magnetic properties of these materials [73]. In this work, the focus was on characterizing the accumulation of defects and structural changes for increasing dose, using correlative Raman spectroscopy and TEM. The effect of sample thinning due to sputtering on the


Stability and activity of platinum nanoparticles in the oxygen electroreduction reaction: is size or uniformity of primary importance?
Beilstein J. Nanotechnol. 2021, 12, 593–606, doi:10.3762/bjnano.12.49

- distributions were also studied by transmission electron microscopy (TEM). The TEM images were obtained using a JEOL JEM F200 microscope (voltage 200 kV, current 12–15 μA, CFEG). To prepare a sample for measurements, 0.5 mg of the catalyst was placed into 1 mL of isopropanol and dispersed by ultrasound for 10
- were plotted to determine the size of at least 400 randomly selected particles in the TEM images in different regions of the sample. Electrochemical investigation Electrochemical measurements were performed in a three-electrode cell on a VersaSTAT3 potentiostat using a rotating disk electrode (RDE
- 2.6 nm (G30–G40). The difference in the sizes of nanoparticles (crystallites) determined from the results of X-ray diffractometry and TEM is typical for nanostructured Pt/C materials. It is due to several factors: some nanoparticles can consist of several crystallites, so they have a larger size [19


The preparation temperature influences the physicochemical nature and activity of nanoceria
Beilstein J. Nanotechnol. 2021, 12, 525–540, doi:10.3762/bjnano.12.43

- characterizations. Transmission electron microscopy (TEM) and high-angle annular dark-field scanning transmission electron microscopy (HAADF-STEM) were conducted of NM-212 dispersed in DI water, sonicated for 10 min in a bath, and captured on 300 mesh lacey carbon copper grids dipped into the dispersion for
- synthesized nanoceria was determined using the ferric reduction ability of serum assay (FRAS) as described in [46]. The materials were tested in triplicate, at a concentration of 1 m2 ENM/mL serum. Results Physicochemical characterization of NM-212 TEM, conducted at a higher resolution than previously
- 10 of [35]). EDS showed co-localization of not only cerium and oxygen for both NM-212 (Figure 1) and the solvothermally synthesized nanoceria (Figure 2 of [35]), but also carbon, as previously reported [7], and sodium (Figure 1) were found. Calcined nanoceria physicochemical characterization TEM


Surface-enhanced Raman scattering of water in aqueous dispersions of silver nanoparticles
Beilstein J. Nanotechnol. 2021, 12, 497–506, doi:10.3762/bjnano.12.40

- -resolution transmission electron microscopy (TEM) analysis was performed to estimate the size and identify the shape of the nanoparticles (see Figure 1). The nanoparticles in the AgNPs blue sample had a triangular prism shape with an estimated average size of 34 ± 14 nm, while in the AgNPs yellow sample, the
- molecules interacting directly with the surface of AgNPs was estimated based on the size and shape of AgNPs in the AgNPs blue sample, which was determined by TEM (Figure 1), and on the Ag concentration in the dispersion (17.96 µg/mL), which was determined by flame atomic absorption spectrometry (FAAS). It
- as the reference sample. The TEM images were obtained by using a Jeol ARM 200F high-resolution transmission electron microscope. The silver concentration in the AgNP dispersion was determined by FAAS using the GBC 932 plus instrument. The calibration was made using the silver standard solution


Boosting of photocatalytic hydrogen evolution via chlorine doping of polymeric carbon nitride
Beilstein J. Nanotechnol. 2021, 12, 473–484, doi:10.3762/bjnano.12.38

- the morphology of the prepared materials, presented in Figure 1, was performed by transmission electron microscopy (TEM). The images of pristine PCN demonstrate the layered structure with a tendency to fold and aggregate. They also show several stacking layers, indicating the planar graphitic-like
- using TEM (Tecnai F30) with an accelerating voltage of 200 kV. The FTIR spectra were recorded on a Nicolet 6700 FT-IR spectrometer. The chemical composition and relative atomic percentages on the surface of the samples were studied by XPS. The measurements were conducted using Mg Kα (hν = 1253.6 eV
- Ar as a carrier). Each catalyst was tested for 3 h. Every hour, 100 µL of gas was withdrawn from the reactor and injected into the gas chromatograph to measure the amount of H2 evolved. TEM images of PCN (a, b) and Cl-PCN (c, d). Scanning transmission electron microscopy image of Cl-PCN (e) and


Rapid controlled synthesis of gold–platinum nanorods with excellent photothermal properties under 808 nm excitation
Beilstein J. Nanotechnol. 2021, 12, 462–472, doi:10.3762/bjnano.12.37

- Synthesis and characterization of the AuNRs The synthesis of AuNRs was carried out by a seedless-growth method with some modifications of reagent volume in the reaction solution. Figure 1a shows the morphology and size of as-prepared AuNRs characterized by TEM. According to the statistical data obtained
- from TEM images, the average length of the prepared particles is 26.8 ± 3.2 nm, the average width is 6.8 ± 1.1 nm, and the aspect ratio is close to 3.9 (all dimensions in this paper were calculated by counting 100 nanoparticles from TEM images). AuNRs with this aspect ratio showed a longitudinal LSPR
- Au@Pt-1, Au@Pt-2, Au@Pt-3, and Au@Pt-4) were redshifted to 796, 836, 868, and 870 nm, respectively, as shown in Figure 2a. The obvious change of absorption spectra reveals non-negligible differences in the morphology of the different Au@Pt NRs. This hypothesis was further confirmed by TEM


A review on nanostructured silver as a basic ingredient in medicine: physicochemical parameters and characterization
Beilstein J. Nanotechnol. 2021, 12, 440–461, doi:10.3762/bjnano.12.36

- experimentally analyzed by UV–vis extinction spectra and transmission electron microscopy (TEM). The rate of photo-oxidation in spherical AgNPs was homogeneous and surprisingly inhomogeneous in the case of cubic AgNPs, which was attributed to the difference in morphology. The noticeable formation of small NPs
- (AgxO) around the spherical AgNPs after light exposure, observed in the TEM micrograph shown in Figure 4a, confirmed the quicker photo-oxidation process [52][58]. After 40 h of light irradiation, the level of oxidation in cubic AgNPs was about 30%, while it took only 9 h of light irradiation for the
- complete oxidation of spherical AgNPs, confirming that the oxidation process was much slower in the case of cubic AgNPs, as observed from the representative TEM micrographs depicted in Figure 4b. For a correct assessment, including all studies involving AgNPs at the chemical, pharmacological, biological


