Abstract
Mechanical stress leads to deformation of strands in polymer solids, including elongation of covalent bonds and widening of bond angles, which changes the infrared spectrum. Here, the infrared spectrum of solid polymer samples exposed to mechanical stress is simulated by density functional theory calculations. Mechanical stress is described with the external force explicitly included (EFEI) method. The uneven distribution of the external stress on individual polymer strands is accounted for by a convolution of simulated spectra with a realistic force distribution. N-Propylpropanamide and propyl propanoate are chosen as model molecules for polyamide and polyester, respectively. The effect of a specific force on the polymer backbone is a redshift of vibrational modes involving the C–N and C–O bonds in the backbone, while the free C–O stretching mode perpendicular to the backbone is largely unaffected. The convolution with a realistic force distribution shows that the dominant effect on the strongest infrared bands is not a shift of the peak position, but rather peak broadening and a characteristic change in the relative intensities of the strongest bands, which may serve for the identification and quantification of mechanical stress in polymer solids.
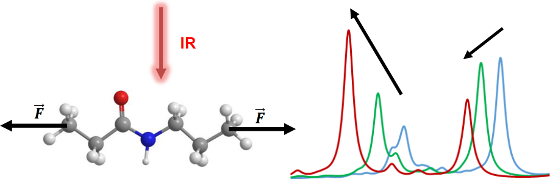
Graphical Abstract
Introduction
Mechanical stress on polymer solids leads to conformational changes, bond elongation and widening of bond angles on the molecular level [1-4]. If the local force on an individual polymer strand reaches values in the range of nN, rupture of covalent bonds becomes possible, leading to irreversible changes and the destruction of the molecule [5-8]. In addition, new minima on the potential energy surface (PES) might become available through relaxation due to the applied force [9]. Covalent bond rupture plays an important role in stress-induced aging of polymeric materials [1,10]. On the other hand, elegant routes have been established to harness this effect for the design of self-healing and stress-responsive materials [11-15]. The influence of an external force on the molecular structure of a polymer can be followed by recording infrared spectra [16-29]. External force modifies the force constants of vibrational modes [30]. Since structural deformation changes the charge distribution in the molecule, the transition dipole moment and thus the infrared intensity is influenced as well [30], resulting in the observed force-dependent shift of the infrared bands and changes in the intensity.
Computational chemistry has proven to be an indispensable tool in the analysis of mechanochemical phenomena of organic molecules, polymers and mechanophores [5,6,31-74]. A variety of theoretical approaches have been developed to model external force using methods of quantum chemistry [9,75,76], including constrained geometries simulate external force (COGEF) [4], external force is explicitly included (EFEI) [61,77] and force modified potential energy surface (FMPES) [45]. Within the EFEI method, force is applied along the direction defined by two atoms in the molecule, which modifies the potential energy surface, closely resembling FMPES. With EFEI, standard quantum chemical tasks like geometry optimization, reaction path following [54,56,68] and frequency calculations can be performed with minor modifications of standard packages. UV–vis, Raman and IR spectra of small model molecules exposed to mechanical stress have been calculated in this way [30,78,79]. Calculated vibrational frequencies have been employed in the theoretical modeling of force-dependent silyl ester hydrolysis rates [33]. The judgement of energy distribution (JEDI) tool developed by Stauch and Dreuw relies on the Hessian matrix in redundant internal coordinates under the influence of an external mechanical force [75,80].
So far, most studies on infrared spectroscopy of stressed polymers focused on polypropylene [30]. Lacking a pronounced infrared chromophore, however, the spectrum is relatively complicated, especially since a large number of C–H stretching, bending and wagging modes are more or less strongly coupled [30]. In the present study, we therefore focus on molecules with strong infrared chromophores, such as C–N and C–O groups. In particular, we choose N-propylpropanamide and propyl propanoate as model molecules for polyamide and polyester, respectively. To facilitate a comparison with future experimental studies, we convolute simulated infrared spectra with the exponential force distribution recently derived by Adhikari and Makarov for elastomeric polymer networks [81].
Results and Discussion
Amide
We investigate force-induced changes on an N-propylpropanamide molecule. By applying an external force to the terminal C-atoms of N-propylpropanamide, Scheme 1, the calculated distance between them increases from 7.43 to 8.33 Å when the force is increased from 0 nN to 4 nN in steps of 0.1 nN. Due to the vector property of the applied force, the change of the vibrational modes with increasing force depends on the orientation of the normal mode displacement of each atom relative to the force vector.
![[1860-5397-13-165-i1]](/bjoc/content/inline/1860-5397-13-165-i1.svg?scale=2.0&max-width=1024&background=FFFFFF)
Scheme 1: N-Propylpropanamide and characteristic infrared active vibrational modes. Modes are in order of lowest (left) to highest (right) vibrational frequency. Animations of the vibrations are given in Supporting Information File 1.
Scheme 1: N-Propylpropanamide and characteristic infrared active vibrational modes. Modes are in order of low...
To illustrate the molecular origin of the changes in the calculated infrared spectrum due to force, the four characteristic vibrational modes illustrated in Scheme 1 were chosen. Figure 1 shows their vibrational frequency as a function of force. The C–N stretching mode in the backbone, in which the carbon atom from the amide bond is involved, shows a significant redshift when external force is applied, shifting from 1212 cm−1 at 0 nN to 1080 cm−1 at 4 nN. This is explained by the elongation of the molecule, which weakens the bond and reduces the force constant. Since the influence of the external force is most pronounced in the backbone, the C–N stretching mode shows the strongest shift among the four characteristic vibrational modes. A weak backbone stretch coupled with twisting of the CH2 groups occurs between 1251 cm−1 and 1230 cm−1 and will be discussed exemplarily for the force influence on weaker C–H vibrations. It changes monotonically over the entire force range and experiences a moderate shift of −21 cm−1, compared to −132 cm−1 for the C–N stretching vibration. With increasing external force the coupling with neighboring CH2 groups decreases significantly (see animations in Supporting Information File 1). A second C–N stretching mode in the backbone, which is accompanied by an N–H wagging mode, again exhibits a strong negative force dependence, with the frequency shifting from 1549 to 1447 cm−1. The dominant motion of the free C–O stretching mode at 1793–1800 cm−1 is perpendicular to the external force, which explains the absence of a significant shift.
![[1860-5397-13-165-1]](/bjoc/content/figures/1860-5397-13-165-1.png?scale=2.0&max-width=1024&background=FFFFFF)
Figure 1: Force dependence of the modes shown in Scheme 1 in the fingerprint region from 800 to 2000 cm−1. C–N stretch of the amide bond (blue); backbone stretch combined with C–H2 twisting (green); N–H wagging (orange); free C–O stretch (purple).
Figure 1: Force dependence of the modes shown in Scheme 1 in the fingerprint region from 800 to 2000 cm−1. C–N stretc...
As shown before, vibrational modes involving the backbone exhibit a strong force dependence [30]. What is surprising, however, is the almost complete insensitivity of the free C–O stretch. One might expect that the deformation of the amide bond in the backbone changes the electron distribution, and that the weakening of the C–N bond in the backbone is compensated by a strengthening of the free C–O bond. This is obviously not the case as the bond seems to be completely unaffected by the external force, which is in line with a negligible change of the C–O bond length, from 1.22 to 1.21 Å.
The calculated spectra in the fingerprint area are given in Figure 2. Since the modes show different force dependences, spectral overlap and coupling of different modes can significantly influence the peak intensities. This leads to the significant change of the overall shape of the spectrum. While an external force does not influence the C–O stretching vibration, IR bands mainly attributed to modes including backbone vibrations show a considerable change in intensities. The intensity of the C–N stretching vibration in the range of 1000–1220 cm−1 continuously increases with increasing force due to a stronger dipole moment change resulting from interatomic bond elongation in the backbone.
![[1860-5397-13-165-2]](/bjoc/content/figures/1860-5397-13-165-2.png?scale=2.0&max-width=1024&background=FFFFFF)
Figure 2: Intensities in fingerprint region of the infrared spectrum obtained for N-propylpropanamide. Spectral lines are broadened with a Lorentzian (34 cm−1 at FWHM) and summed up, yielding the spectrum of a stretched molecule.
Figure 2: Intensities in fingerprint region of the infrared spectrum obtained for N-propylpropanamide. Spectr...
However, the spectra of molecules exposed to a specific force, shown in Figure 2, cannot be compared with experimental data. In a polymer solid, the individual polymer strands experience a broad distribution of forces. Adhikari and Makarov have recently shown for elastomeric polymer networks that an exponential distribution is an excellent approximation [81]. It is straightforward to calculate spectra as a convolution of the spectra at specific forces with the exponential force distribution. The result of this convolution is displayed in Figure 3 for mean forces of 0.1 to 1 nN. Since the most probable force is close to zero, the peak position does not change dramatically. The bands originating from strongly red shifting modes are only slightly red shifted, but significantly broadened. Moreover, the broadening leads to a significantly decreased peak height of the band around 1550 cm−1. The band around 1250 cm−1 is composed of several vibrational modes, and their different force dependence leads to seemingly erratic changes in peak shape. Interestingly, the change in the peak shape with increasing force resembles the experimentally observed difference between bulk and surface spectra reported by Vettegren and co-workers [27].
![[1860-5397-13-165-3]](/bjoc/content/figures/1860-5397-13-165-3.png?scale=2.0&max-width=1024&background=FFFFFF)
Figure 3: Fingerprint region of a simulated spectrum of an N-propylpropanamide solid sample at 0.1, 0.3, 0.5 and 1.0 nN mean force per polymer strand.
Figure 3: Fingerprint region of a simulated spectrum of an N-propylpropanamide solid sample at 0.1, 0.3, 0.5 ...
Since the peak of the C–O stretching vibration does not change with force, the relative intensity of the two strong bands around 1550 cm−1 and 1800 cm−1 may actually serve as a direct measurement of the mechanical stress experienced locally in a polymer solid.
Ester
Another technically relevant polymer is polyester, for which propyl pronanoate was chosen as model molecule. According to our EFEI geometry optimizations, the distance between terminal C-atoms in propyl propanoate increases from 7.42 to 8.19 Å when an external force of 4 nN is applied. This elongation of 0.77 Å is significantly smaller than for the previously discussed N-propylpropanamide with 0.90 Å.
For propyl propanoate, the three representative vibrational modes shown in Scheme 2 were selected in the fingerprint region and followed over the calculated force range of 0–4 nN, Figure 4. The C–O backbone-stretching mode exhibits the strongest negative force dependence, shifting from 1231 to 1046 cm−1, due to its strong alignment with the external force vector. If no force is applied, a CH2 wagging mode next to the ester group, combined with a stretching vibration in the backbone (orange) is present at 1381 cm−1. Upon increasing the external force to 4 nN, it shifts to 1298 cm−1. Again, the vibrational modes involving motion of atoms along the backbone experience a strong redshift. The C–O stretching vibration (pink) perpendicular to the applied force occurs at slightly higher wavenumbers than for the amide bond, in the range of 1830–1846 cm−1. It is basically independent of the force applied to the molecule.
![[1860-5397-13-165-i2]](/bjoc/content/inline/1860-5397-13-165-i2.svg?scale=2.0&max-width=1024&background=FFFFFF)
Scheme 2: Propyl propanoate and characteristic infrared active vibrational modes. Modes are in order of lowest (left) to highest (right) vibrational frequency. For the second mode bold arrows describe the main vibrational mode and plain arrows coupled modes. Animations of the vibrations are given in Supporting Information File 1.
Scheme 2: Propyl propanoate and characteristic infrared active vibrational modes. Modes are in order of lowes...
![[1860-5397-13-165-4]](/bjoc/content/figures/1860-5397-13-165-4.png?scale=2.0&max-width=1024&background=FFFFFF)
Figure 4: Force dependence of the modes shown in Scheme 2 in the fingerprint region from 800 to 2000 cm−1. C–O backbone stretch of the ester bond (blue); backbone stretch combined with C–H2 wagging (orange); free C-O stretch (purple).
Figure 4: Force dependence of the modes shown in Scheme 2 in the fingerprint region from 800 to 2000 cm−1. C–O backbo...
Simulated spectra in the fingerprint region of individual molecules exposed to a specific force are presented in Figure 5. As discussed above for N-propylpropanamide, the intensity of the stretching vibration of the C–O double bond of propyl propanoate is not affected by external force applied at the terminal C-atoms. Modes containing vibrations along the backbone, however, experience significant changes in intensity. The wagging mode of hydrogen adjacent to the ester bond decreases in intensity and almost vanishes at 4 nN. For the C–O-stretching mode in the backbone the intensity first increases similar to the C–N vibration in the amide, reaches a maximum around 2.2 nN and then decreases again. Peaks propagating from 1047 cm−1 at 0 nN to 858 cm−1 at 4 nN result from numerous overlapping C–H and backbone vibrations. Due to their complexity, as described in detail before for polypropylene [30], as well as the lower intensity compared to vibrations from strongly IR active functional groups, they do not seem to be a valuable reference for force-dependent evaluation of the resulting spectra. Moreover, the complex interplay of different modes generating these broad absorptions may be strongly affected by the limited length of the model molecule, while the behavior of the lines originating from the ester moiety should be robust.
![[1860-5397-13-165-5]](/bjoc/content/figures/1860-5397-13-165-5.png?scale=2.0&max-width=1024&background=FFFFFF)
Figure 5: Intensities in fingerprint region of the infrared spectrum obtained for propyl propanoate. Spectral lines are broadened with a Lorentzian (34 cm−1 at FWHM) and summed up, yielding the spectrum of a stretched molecule.
Figure 5: Intensities in fingerprint region of the infrared spectrum obtained for propyl propanoate. Spectral...
The weighted spectra, obtained again by convolution with an exponential force distribution [81], are given in Figure 6. As for the amide, the bands dominated by backbone vibrations show a significant decrease in intensity accompanied by a broadening towards smaller wavenumbers, while the free C–O stretching vibration remains unaffected.
![[1860-5397-13-165-6]](/bjoc/content/figures/1860-5397-13-165-6.png?scale=2.0&max-width=1024&background=FFFFFF)
Figure 6: Fingerprint region of a simulated spectrum of a propyl propanoate solid sample at 0.1, 0.3, 0.5 and 1.0 nN mean force per polymer strand.
Figure 6: Fingerprint region of a simulated spectrum of a propyl propanoate solid sample at 0.1, 0.3, 0.5 and...
Conclusion
Experimental studies on the IR spectra of mechanically stressed polymers mostly focused on possible shifts in the peak position of bands around 1000 cm−1. These shifts, however, are due to a complex interplay of overlapping backbone modes involving CH2 groups, and are difficult to interpret. For polymers with strong IR active modes, like polyamides or polyesters, we have shown here that the peak positions of real samples do not shift strongly. This is due to the exponential force distribution used for the modeling, which means that most functional polymer strands are exposed to very small forces, but a small number of groups experiences very high forces. This results in a significant broadening combined with a small redshift of bands involving backbone vibrations. The peak broadening also leads to a decrease of the absorption maximum. In contrast, both peak position and intensity of the free C–O stretching mode are completely unaffected in both studied molecules. Thus, for comparison with experimental results we propose using the free C–O stretching mode as a reference band to quantify the influence of external force on the remaining strong infrared modes.
Methods
DFT calculations were performed using the B3LYP functional along with Ahlrich’s SVP basis set. For computations, TURBOMOLE 7.0.2 was used [82,83] with a script implementing EFEI using numerical calculation of the second derivative after geometry optimization, as described by Pill et al. [30]. Initial optimization leads to a fairly consistent increase in the distance between pulling points, but includes structures with imaginary vibrational modes and abrupt conformational changes. Respective structures were re-calculated using the geometry obtained for the next higher force as starting structure (see Figure S3, Supporting Information File 1). All calculated structures represent local minima. No frequency scaling factor was applied. To validate the sufficiency of Ahlrich’s SVP basis set, calculations without applying external force were performed using the TZVP basis set. Furthermore, computations were carried out for 0 nN using numerical calculations as implemented in TURBOMOLE. See Supporting Information File 1 for details.
N-Propylpropanamide and propyl propanoate were used as model molecules for polyamides and polyesters, respectively. Since polymers consist of multiple repetition units, any vibrational modes specific to the polymer ends would be very weak. Therefore, hydrogen atoms from the terminal methyl groups were substituted with deuterium. The spectral lines originating from these CD3 groups were removed from the simulated spectra. To simulate the intensities of infrared bands in the fingerprint region at a given force, the remaining spectral lines were broadened using a Lorentzian with a full width at half maximum of 34 cm−1. To simulate spectra of polymer solids, the broadened spectra were convoluted with the probability distribution P(F) derived by Adhikari and Makarov [81], Equation 1, with the actual force acting on the polymer strand F and the mean force <F>.
![[1860-5397-13-165-i3]](/bjoc/content/inline/1860-5397-13-165-i3.svg?max-width=590&scale=1.18182)
Supporting Information
The Supporting information comprises a short description of steps taken to validate the accuracy of the methods used, the elongation of the respective model structures, animations of the vibrational modes in the fingerprint region, calculated infrared spectra and convoluted spectra over the entire frequency range. Additionally, the atomic coordinates calculated for the model molecules without external force are given.
| Supporting Information File 1: Additional material. | ||
| Format: DOCX | Size: 18.4 MB | Download |
Acknowledgements
The computational results presented have been achieved using the HPC infrastructure LEO of the University of Innsbruck. We thank Michael Pill and Alfred Kersch for sharing the EFEI script for Turbomole. M.O. acknowledges the support through the Lise Meitner Programme of the Austrian Science Fund (FWF) project No. M2001-NBL.
References
-
Dubinskaya, A. M. Russ. Chem. Rev. 1999, 68, 637–652. doi:10.1070/RC1999v068n08ABEH000435
Return to citation in text: [1] [2] -
Beyer, M. K.; Clausen-Schaumann, H. Chem. Rev. 2005, 105, 2921–2948. doi:10.1021/cr030697h
Return to citation in text: [1] -
Caruso, M. M.; Davis, D. A.; Shen, Q.; Odom, S. A.; Sottos, N. R.; White, S. R.; Moore, J. S. Chem. Rev. 2009, 109, 5755–5798. doi:10.1021/cr9001353
Return to citation in text: [1] -
Beyer, M. K. Mechanochemical Reactions of Polymers. In Encyclopedia Of Polymer Science and Technology; Mark, H. F., Ed.; John Wiley and Sons: Inc.: Hoboken, NJ, USA, 2014; pp 1–20. doi:10.1002/0471440264.pst630
Return to citation in text: [1] [2] -
Grandbois, M.; Beyer, M.; Rief, M.; Clausen-Schaumann, H.; Gaub, H. E. Science 1999, 283, 1727–1730. doi:10.1126/science.283.5408.1727
Return to citation in text: [1] [2] -
Beyer, M. K. J. Chem. Phys. 2000, 112, 7307–7312. doi:10.1063/1.481330
Return to citation in text: [1] [2] -
Zhurkov, S. N.; Korsukov, V. E. J. Polym. Sci., Polym. Phys. Ed. 1974, 12, 385–398. doi:10.1002/pol.1974.180120211
Return to citation in text: [1] -
Zhurkov, S. N. Int. J. Fract. 1984, 26, 295–307. doi:10.1007/BF00962961
Return to citation in text: [1] -
Ribas-Arino, J.; Marx, D. Chem. Rev. 2012, 112, 5412–5487. doi:10.1021/cr200399q
Return to citation in text: [1] [2] -
Popov, A. A.; Zaikov, G. E.; Semeriov, N. N. Int. J. Polym. Mater. 1992, 17, 143–149. doi:10.1080/00914039208041109
Return to citation in text: [1] -
Groote, R.; Jakobs, R. T. M.; Sijbesma, R. P. Polym. Chem. 2013, 4, 4846–4859. doi:10.1039/c3py00071k
Return to citation in text: [1] -
Blaiszik, B.; Kramer, S. L. B.; Olugebefola, S. C.; Moore, J. S.; Sottos, N. R.; White, S. R. Annu. Rev. Mater. Res. 2010, 40, 179–211. doi:10.1146/annurev-matsci-070909-104532
Return to citation in text: [1] -
Kean, Z. S.; Craig, S. L. Polymer 2012, 53, 1035–1048. doi:10.1016/j.polymer.2012.01.018
Return to citation in text: [1] -
Wilson, G. O.; Andersson, H. M.; White, S. R.; Sottos, N. R.; Moore, J. S.; Braun, P. V. Self-Healing Polymers. In Encyclopedia Of Polymer Science and Technology; Mark, H. F., Ed.; John Wiley and Sons: Inc.: Hoboken, NJ, USA, 2010. doi:10.1002/0471440264.pst469
Return to citation in text: [1] -
Black, A. L.; Lenhardt, J. M.; Craig, S. L. J. Mater. Chem. 2011, 21, 1655–1663. doi:10.1039/C0JM02636K
Return to citation in text: [1] -
Bretzlaff, R. S.; Wool, R. P. Macromolecules 1983, 16, 1907–1917. doi:10.1021/ma00246a019
Return to citation in text: [1] -
Wool, R. P. J. Polym. Sci., Polym. Phys. Ed. 1981, 19, 449–457. doi:10.1002/pol.1981.180190305
Return to citation in text: [1] -
Wool, R. P.; Boyd, R. H. J. Appl. Phys. 1980, 51, 5116–5124. doi:10.1063/1.327429
Return to citation in text: [1] -
Wool, R. P.; Statton, W. O. J. Polym. Sci., Polym. Phys. Ed. 1974, 12, 1575–1586. doi:10.1002/pol.1974.180120806
Return to citation in text: [1] -
Chalmers, J.; Mackenzie, M. W.; Willis, H. A.; Edwards, H. G. M.; Lees, J. S.; Long, D. A. Spectrochim. Acta, Part A 1991, 47, 1677–1683. doi:10.1016/0584-8539(91)80005-4
Return to citation in text: [1] -
Young, R. J. J. Text. Inst. 1995, 86, 360–381. doi:10.1080/00405009508631340
Return to citation in text: [1] -
Brownlow, S. R.; Moravsky, A. P.; Kalugin, N. G.; Majumdar, B. S. Compos. Sci. Technol. 2010, 70, 1460–1468. doi:10.1016/j.compscitech.2010.04.025
Return to citation in text: [1] -
Eichhorn, S. J.; Young, R. J. Compos. Sci. Technol. 2003, 63, 1225–1230. doi:10.1016/S0266-3538(03)00091-5
Return to citation in text: [1] -
Huang, Y.; Young, R. J. Carbon 1995, 33, 97–107. doi:10.1016/0008-6223(94)00109-D
Return to citation in text: [1] -
Vettegren, V. I.; Novak, I. I. J. Polym. Sci., Part A-2 1973, 11, 2135–2142. doi:10.1002/pol.1973.180111105
Return to citation in text: [1] -
Vettegren, V. I.; Novak, I. I.; Friedland, K. J. Int. J. Fract. 1975, 11, 789–801. doi:10.1007/BF00012897
Return to citation in text: [1] -
Vettegren, V. I.; Novak, I. I.; Kulik, V. B. Phys. Solid State 2005, 47, 920–926. doi:10.1134/1.1924856
Return to citation in text: [1] [2] -
Roylance, D. K.; DeVries, K. L. J. Polym. Sci., Part C: Polym. Lett. 1971, 9, 443–447. doi:10.1002/pol.1971.110090607
Return to citation in text: [1] -
Reynolds, J.; Sternstein, S. S. J. Chem. Phys. 1964, 41, 47–50. doi:10.1063/1.1725646
Return to citation in text: [1] -
Pill, M. F.; Kersch, A.; Clausen-Schaumann, H.; Beyer, M. K. Polym. Degrad. Stab. 2016, 128, 294–299. doi:10.1016/j.polymdegradstab.2016.03.025
Return to citation in text: [1] [2] [3] [4] [5] [6] [7] [8] -
Beyer, M. K. Angew. Chem., Int. Ed. 2003, 42, 4913–4915. doi:10.1002/anie.200351748
Return to citation in text: [1] -
Pill, M. F.; Holz, K.; Preußke, N.; Berger, F.; Clausen-Schaumann, H.; Lüning, U.; Beyer, M. K. Chem. – Eur. J. 2016, 22, 12034–12039. doi:10.1002/chem.201600866
Return to citation in text: [1] -
Pill, M. F.; Schmidt, S. W.; Beyer, M. K.; Clausen-Schaumann, H.; Kersch, A. J. Chem. Phys. 2014, 140, 044321. doi:10.1063/1.4862827
Return to citation in text: [1] [2] -
Schütze, D.; Holz, K.; Müller, J.; Beyer, M. K.; Lüning, U.; Hartke, B. Angew. Chem., Int. Ed. 2015, 54, 2556–2559. doi:10.1002/anie.201409691
Return to citation in text: [1] -
Ainavarapu, S. R. K.; Wiita, A. P.; Dougan, L.; Uggerud, E.; Fernández, J. M. J. Am. Chem. Soc. 2008, 130, 6479–6487. doi:10.1021/ja800180u
Return to citation in text: [1] -
Iozzi, M. F.; Helgaker, T.; Uggerud, E. Mol. Phys. 2009, 107, 2537–2546. doi:10.1080/00268970903401041
Return to citation in text: [1] -
Iozzi, M. F.; Helgaker, T.; Uggerud, E. J. Phys. Chem. A 2011, 115, 2308–2315. doi:10.1021/jp109428g
Return to citation in text: [1] -
Smalø, H. S.; Rybkin, V. V.; Klopper, W.; Helgaker, T.; Uggerud, E. J. Phys. Chem. A 2014, 118, 7683–7694. doi:10.1021/jp504959z
Return to citation in text: [1] -
Smalø, H. S.; Uggerud, E. Chem. Commun. 2012, 48, 10443–10445. doi:10.1039/c2cc34056a
Return to citation in text: [1] -
Smalø, H. S.; Uggerud, E. Mol. Phys. 2013, 111, 1563–1573. doi:10.1080/00268976.2013.811554
Return to citation in text: [1] -
Davis, D. A.; Hamilton, A.; Yang, J.; Cremar, L. D.; van Gough, D.; Potisek, S. L.; Ong, M. T.; Braun, P. V.; Martínez, T. J.; White, S. R.; Moore, J. S.; Sottos, N. R. Nature 2009, 459, 68–72. doi:10.1038/nature07970
Return to citation in text: [1] -
Kryger, M. J.; Ong, M. T.; Odom, S. A.; Sottos, N. R.; White, S. R.; Martínez, T. J.; Moore, J. S. J. Am. Chem. Soc. 2010, 132, 4558–4559. doi:10.1021/ja1008932
Return to citation in text: [1] -
Lenhardt, J. M.; Ogle, J. W.; Ong, M. T.; Choe, R.; Martínez, T. J.; Craig, S. L. J. Am. Chem. Soc. 2011, 133, 3222–3225. doi:10.1021/ja107645c
Return to citation in text: [1] -
Lenhardt, J. M.; Ong, M. T.; Choe, R.; Evenhuis, C. R.; Martínez, T. J.; Craig, S. L. Science 2010, 329, 1057–1060. doi:10.1126/science.1193412
Return to citation in text: [1] -
Ong, M. T.; Leiding, J.; Tao, H.; Virshup, A. M.; Martínez, T. J. J. Am. Chem. Soc. 2009, 131, 6377–6379. doi:10.1021/ja8095834
Return to citation in text: [1] [2] -
Silberstein, M. N.; Min, K.; Cremar, L. D.; Degen, C. M.; Martínez, T. J.; Aluru, N. R.; White, S. R.; Sottos, N. R. J. Appl. Phys. 2013, 114, 023504. doi:10.1063/1.4812581
Return to citation in text: [1] -
Wang, J.; Kouznetsova, T. B.; Niu, Z.; Ong, M. T.; Klukovich, H. M.; Rheingold, A. L.; Martínez, T. J.; Craig, S. L. Nat. Chem. 2015, 7, 323–327. doi:10.1038/nchem.2185
Return to citation in text: [1] -
Wang, J.; Kouznetsova, T. B.; Kean, Z. S.; Fan, L.; Mar, B. D.; Martínez, T. J.; Craig, S. L. J. Am. Chem. Soc. 2014, 136, 15162–15165. doi:10.1021/ja509585g
Return to citation in text: [1] -
Kean, Z. S.; Akbulatov, S.; Tian, Y.; Widenhoefer, R. A.; Boulatov, R.; Craig, S. L. Angew. Chem., Int. Ed. 2014, 53, 14508–14511. doi:10.1002/anie.201407494
Return to citation in text: [1] -
Kucharski, T. J.; Boulatov, R. J. Mater. Chem. 2011, 21, 8237–8255. doi:10.1039/c0jm04079g
Return to citation in text: [1] -
Kucharski, T. J.; Huang, Z.; Yang, Q.-Z.; Tian, Y.; Rubin, N. C.; Concepcion, C. D.; Boulatov, R. Angew. Chem., Int. Ed. 2009, 48, 7040–7043. doi:10.1002/anie.200901511
Return to citation in text: [1] -
Dopieralski, P.; Anjukandi, P.; Rückert, M.; Shiga, M.; Ribas-Arino, J.; Marx, D. J. Mater. Chem. 2011, 21, 8309–8316. doi:10.1039/c0jm03698f
Return to citation in text: [1] -
Dopieralski, P.; Ribas-Arino, J.; Marx, D. Angew. Chem., Int. Ed. 2011, 50, 7105–7108. doi:10.1002/anie.201100399
Return to citation in text: [1] -
Dopieralski, P.; Ribas-Arino, J.; Anjukandi, P.; Krupicka, M.; Kiss, J.; Marx, D. Nat. Chem. 2013, 5, 685–691. doi:10.1038/nchem.1676
Return to citation in text: [1] [2] -
Dopieralski, P.; Ribas-Arino, J.; Anjukandi, P.; Krupicka, M.; Marx, D. Angew. Chem., Int. Ed. 2016, 55, 1304–1308. doi:10.1002/anie.201508005
Return to citation in text: [1] -
Dopieralski, P.; Ribas-Arino, J.; Anjukandi, P.; Krupicka, M.; Marx, D. Nat. Chem. 2017, 9, 164–170. doi:10.1038/nchem.2632
Return to citation in text: [1] [2] -
Konôpka, M.; Rousseau, R.; Štich, I.; Marx, D. J. Am. Chem. Soc. 2004, 126, 12103–12111. doi:10.1021/ja047946j
Return to citation in text: [1] -
Konôpka, M.; Turanský, R.; Reichert, J.; Fuchs, H.; Marx, D.; Štich, I. Phys. Rev. Lett. 2008, 100, 115503. doi:10.1103/PhysRevLett.100.115503
Return to citation in text: [1] -
Konôpka, M.; Turanský, R.; Dubecký, M.; Marx, D.; Štich, I. J. Phys. Chem. C 2009, 113, 8878–8887. doi:10.1021/jp9017025
Return to citation in text: [1] -
Krüger, D.; Fuchs, H.; Rousseau, R.; Marx, D.; Parrinello, M. Phys. Rev. Lett. 2002, 89, 186402. doi:10.1103/PhysRevLett.89.186402
Return to citation in text: [1] -
Ribas-Arino, J.; Shiga, M.; Marx, D. Angew. Chem., Int. Ed. 2009, 48, 4190–4193. doi:10.1002/anie.200900673
Return to citation in text: [1] [2] -
Ribas-Arino, J.; Shiga, M.; Marx, D. Chem. – Eur. J. 2009, 15, 13331–13335. doi:10.1002/chem.200902573
Return to citation in text: [1] -
Ribas-Arino, J.; Shiga, M.; Marx, D. J. Am. Chem. Soc. 2010, 132, 10609–10614. doi:10.1021/ja104958e
Return to citation in text: [1] -
Seema, P.; Behler, J.; Marx, D. Phys. Chem. Chem. Phys. 2013, 15, 16001–16011. doi:10.1039/c3cp52181h
Return to citation in text: [1] -
Turanský, R.; Konôpka, M.; Doltsinis, N. L.; Štich, I.; Marx, D. ChemPhysChem 2010, 11, 345–348. doi:10.1002/cphc.200900690
Return to citation in text: [1] -
Zoloff Michoff, M. E.; Ribas-Arino, J.; Marx, D. Phys. Rev. Lett. 2015, 114, 075501. doi:10.1103/PhysRevLett.114.075501
Return to citation in text: [1] -
Avdoshenko, S. M.; Konda, S. S. M.; Makarov, D. E. J. Chem. Phys. 2014, 141, 134115. doi:10.1063/1.4896944
Return to citation in text: [1] -
Avdoshenko, S. M.; Makarov, D. E. J. Phys. Chem. B 2016, 120, 1537–1545. doi:10.1021/acs.jpcb.5b07613
Return to citation in text: [1] [2] -
Brantley, J. N.; Konda, S. S. M.; Makarov, D. E.; Bielawski, C. W. J. Am. Chem. Soc. 2012, 134, 9882–9885. doi:10.1021/ja303147a
Return to citation in text: [1] -
Konda, S. S. M.; Brantley, J. N.; Bielawski, C. W.; Makarov, D. E. J. Chem. Phys. 2011, 135, 164103. doi:10.1063/1.3656367
Return to citation in text: [1] -
Konda, S. S. M.; Brantley, J. N.; Varghese, B. T.; Wiggins, K. M.; Bielawski, C. W.; Makarov, D. E. J. Am. Chem. Soc. 2013, 135, 12722–12729. doi:10.1021/ja4051108
Return to citation in text: [1] -
Makarov, D. E. J. Chem. Phys. 2016, 144, 030901. doi:10.1063/1.4939791
Return to citation in text: [1] -
Bailey, A.; Mosey, N. J. J. Chem. Phys. 2012, 136, 044102. doi:10.1063/1.3678010
Return to citation in text: [1] -
Kochhar, G. S.; Mosey, N. J. Sci. Rep. 2016, 6, No. 23059. doi:10.1038/srep23059
Return to citation in text: [1] -
Stauch, T.; Dreuw, A. Chem. Rev. 2016, 116, 14137–14180. doi:10.1021/acs.chemrev.6b00458
Return to citation in text: [1] [2] -
Stauch, T.; Dreuw, A. Acc. Chem. Res. 2017, 50, 1041–1048. doi:10.1021/acs.accounts.7b00038
Return to citation in text: [1] -
Wolinski, K.; Baker, J. Mol. Phys. 2009, 107, 2403–2417. doi:10.1080/00268970903321348
Return to citation in text: [1] -
Stauch, T.; Dreuw, A. Angew. Chem., Int. Ed. 2014, 53, 2759–2761. doi:10.1002/anie.201309794
Return to citation in text: [1] -
Stauch, T.; Hoffmann, M. T.; Dreuw, A. ChemPhysChem 2016, 17, 1486–1492. doi:10.1002/cphc.201600016
Return to citation in text: [1] -
Stauch, T.; Dreuw, A. J. Chem. Phys. 2014, 140, 134107. doi:10.1063/1.4870334
Return to citation in text: [1] -
Adhikari, R.; Makarov, D. E. J. Phys. Chem. B 2017, 121, 2359–2365. doi:10.1021/acs.jpcb.6b12758
Return to citation in text: [1] [2] [3] [4] -
Ahlrichs, R.; Bär, M.; Häser, M.; Horn, H.; Kölmel, C. Chem. Phys. Lett. 1989, 162, 165–169. doi:10.1016/0009-2614(89)85118-8
Return to citation in text: [1] -
TURBOMOLE, V7.0.2; University of Karlsruhe and Forschungszentrum Karlsruhe GmbH, 2015.
Return to citation in text: [1]
| 81. | Adhikari, R.; Makarov, D. E. J. Phys. Chem. B 2017, 121, 2359–2365. doi:10.1021/acs.jpcb.6b12758 |
| 1. | Dubinskaya, A. M. Russ. Chem. Rev. 1999, 68, 637–652. doi:10.1070/RC1999v068n08ABEH000435 |
| 2. | Beyer, M. K.; Clausen-Schaumann, H. Chem. Rev. 2005, 105, 2921–2948. doi:10.1021/cr030697h |
| 3. | Caruso, M. M.; Davis, D. A.; Shen, Q.; Odom, S. A.; Sottos, N. R.; White, S. R.; Moore, J. S. Chem. Rev. 2009, 109, 5755–5798. doi:10.1021/cr9001353 |
| 4. | Beyer, M. K. Mechanochemical Reactions of Polymers. In Encyclopedia Of Polymer Science and Technology; Mark, H. F., Ed.; John Wiley and Sons: Inc.: Hoboken, NJ, USA, 2014; pp 1–20. doi:10.1002/0471440264.pst630 |
| 11. | Groote, R.; Jakobs, R. T. M.; Sijbesma, R. P. Polym. Chem. 2013, 4, 4846–4859. doi:10.1039/c3py00071k |
| 12. | Blaiszik, B.; Kramer, S. L. B.; Olugebefola, S. C.; Moore, J. S.; Sottos, N. R.; White, S. R. Annu. Rev. Mater. Res. 2010, 40, 179–211. doi:10.1146/annurev-matsci-070909-104532 |
| 13. | Kean, Z. S.; Craig, S. L. Polymer 2012, 53, 1035–1048. doi:10.1016/j.polymer.2012.01.018 |
| 14. | Wilson, G. O.; Andersson, H. M.; White, S. R.; Sottos, N. R.; Moore, J. S.; Braun, P. V. Self-Healing Polymers. In Encyclopedia Of Polymer Science and Technology; Mark, H. F., Ed.; John Wiley and Sons: Inc.: Hoboken, NJ, USA, 2010. doi:10.1002/0471440264.pst469 |
| 15. | Black, A. L.; Lenhardt, J. M.; Craig, S. L. J. Mater. Chem. 2011, 21, 1655–1663. doi:10.1039/C0JM02636K |
| 30. | Pill, M. F.; Kersch, A.; Clausen-Schaumann, H.; Beyer, M. K. Polym. Degrad. Stab. 2016, 128, 294–299. doi:10.1016/j.polymdegradstab.2016.03.025 |
| 78. | Stauch, T.; Dreuw, A. Angew. Chem., Int. Ed. 2014, 53, 2759–2761. doi:10.1002/anie.201309794 |
| 79. | Stauch, T.; Hoffmann, M. T.; Dreuw, A. ChemPhysChem 2016, 17, 1486–1492. doi:10.1002/cphc.201600016 |
| 1. | Dubinskaya, A. M. Russ. Chem. Rev. 1999, 68, 637–652. doi:10.1070/RC1999v068n08ABEH000435 |
| 10. | Popov, A. A.; Zaikov, G. E.; Semeriov, N. N. Int. J. Polym. Mater. 1992, 17, 143–149. doi:10.1080/00914039208041109 |
| 33. | Pill, M. F.; Schmidt, S. W.; Beyer, M. K.; Clausen-Schaumann, H.; Kersch, A. J. Chem. Phys. 2014, 140, 044321. doi:10.1063/1.4862827 |
| 9. | Ribas-Arino, J.; Marx, D. Chem. Rev. 2012, 112, 5412–5487. doi:10.1021/cr200399q |
| 45. | Ong, M. T.; Leiding, J.; Tao, H.; Virshup, A. M.; Martínez, T. J. J. Am. Chem. Soc. 2009, 131, 6377–6379. doi:10.1021/ja8095834 |
| 5. | Grandbois, M.; Beyer, M.; Rief, M.; Clausen-Schaumann, H.; Gaub, H. E. Science 1999, 283, 1727–1730. doi:10.1126/science.283.5408.1727 |
| 6. | Beyer, M. K. J. Chem. Phys. 2000, 112, 7307–7312. doi:10.1063/1.481330 |
| 7. | Zhurkov, S. N.; Korsukov, V. E. J. Polym. Sci., Polym. Phys. Ed. 1974, 12, 385–398. doi:10.1002/pol.1974.180120211 |
| 8. | Zhurkov, S. N. Int. J. Fract. 1984, 26, 295–307. doi:10.1007/BF00962961 |
| 54. | Dopieralski, P.; Ribas-Arino, J.; Anjukandi, P.; Krupicka, M.; Kiss, J.; Marx, D. Nat. Chem. 2013, 5, 685–691. doi:10.1038/nchem.1676 |
| 56. | Dopieralski, P.; Ribas-Arino, J.; Anjukandi, P.; Krupicka, M.; Marx, D. Nat. Chem. 2017, 9, 164–170. doi:10.1038/nchem.2632 |
| 68. | Avdoshenko, S. M.; Makarov, D. E. J. Phys. Chem. B 2016, 120, 1537–1545. doi:10.1021/acs.jpcb.5b07613 |
| 5. | Grandbois, M.; Beyer, M.; Rief, M.; Clausen-Schaumann, H.; Gaub, H. E. Science 1999, 283, 1727–1730. doi:10.1126/science.283.5408.1727 |
| 6. | Beyer, M. K. J. Chem. Phys. 2000, 112, 7307–7312. doi:10.1063/1.481330 |
| 31. | Beyer, M. K. Angew. Chem., Int. Ed. 2003, 42, 4913–4915. doi:10.1002/anie.200351748 |
| 32. | Pill, M. F.; Holz, K.; Preußke, N.; Berger, F.; Clausen-Schaumann, H.; Lüning, U.; Beyer, M. K. Chem. – Eur. J. 2016, 22, 12034–12039. doi:10.1002/chem.201600866 |
| 33. | Pill, M. F.; Schmidt, S. W.; Beyer, M. K.; Clausen-Schaumann, H.; Kersch, A. J. Chem. Phys. 2014, 140, 044321. doi:10.1063/1.4862827 |
| 34. | Schütze, D.; Holz, K.; Müller, J.; Beyer, M. K.; Lüning, U.; Hartke, B. Angew. Chem., Int. Ed. 2015, 54, 2556–2559. doi:10.1002/anie.201409691 |
| 35. | Ainavarapu, S. R. K.; Wiita, A. P.; Dougan, L.; Uggerud, E.; Fernández, J. M. J. Am. Chem. Soc. 2008, 130, 6479–6487. doi:10.1021/ja800180u |
| 36. | Iozzi, M. F.; Helgaker, T.; Uggerud, E. Mol. Phys. 2009, 107, 2537–2546. doi:10.1080/00268970903401041 |
| 37. | Iozzi, M. F.; Helgaker, T.; Uggerud, E. J. Phys. Chem. A 2011, 115, 2308–2315. doi:10.1021/jp109428g |
| 38. | Smalø, H. S.; Rybkin, V. V.; Klopper, W.; Helgaker, T.; Uggerud, E. J. Phys. Chem. A 2014, 118, 7683–7694. doi:10.1021/jp504959z |
| 39. | Smalø, H. S.; Uggerud, E. Chem. Commun. 2012, 48, 10443–10445. doi:10.1039/c2cc34056a |
| 40. | Smalø, H. S.; Uggerud, E. Mol. Phys. 2013, 111, 1563–1573. doi:10.1080/00268976.2013.811554 |
| 41. | Davis, D. A.; Hamilton, A.; Yang, J.; Cremar, L. D.; van Gough, D.; Potisek, S. L.; Ong, M. T.; Braun, P. V.; Martínez, T. J.; White, S. R.; Moore, J. S.; Sottos, N. R. Nature 2009, 459, 68–72. doi:10.1038/nature07970 |
| 42. | Kryger, M. J.; Ong, M. T.; Odom, S. A.; Sottos, N. R.; White, S. R.; Martínez, T. J.; Moore, J. S. J. Am. Chem. Soc. 2010, 132, 4558–4559. doi:10.1021/ja1008932 |
| 43. | Lenhardt, J. M.; Ogle, J. W.; Ong, M. T.; Choe, R.; Martínez, T. J.; Craig, S. L. J. Am. Chem. Soc. 2011, 133, 3222–3225. doi:10.1021/ja107645c |
| 44. | Lenhardt, J. M.; Ong, M. T.; Choe, R.; Evenhuis, C. R.; Martínez, T. J.; Craig, S. L. Science 2010, 329, 1057–1060. doi:10.1126/science.1193412 |
| 45. | Ong, M. T.; Leiding, J.; Tao, H.; Virshup, A. M.; Martínez, T. J. J. Am. Chem. Soc. 2009, 131, 6377–6379. doi:10.1021/ja8095834 |
| 46. | Silberstein, M. N.; Min, K.; Cremar, L. D.; Degen, C. M.; Martínez, T. J.; Aluru, N. R.; White, S. R.; Sottos, N. R. J. Appl. Phys. 2013, 114, 023504. doi:10.1063/1.4812581 |
| 47. | Wang, J.; Kouznetsova, T. B.; Niu, Z.; Ong, M. T.; Klukovich, H. M.; Rheingold, A. L.; Martínez, T. J.; Craig, S. L. Nat. Chem. 2015, 7, 323–327. doi:10.1038/nchem.2185 |
| 48. | Wang, J.; Kouznetsova, T. B.; Kean, Z. S.; Fan, L.; Mar, B. D.; Martínez, T. J.; Craig, S. L. J. Am. Chem. Soc. 2014, 136, 15162–15165. doi:10.1021/ja509585g |
| 49. | Kean, Z. S.; Akbulatov, S.; Tian, Y.; Widenhoefer, R. A.; Boulatov, R.; Craig, S. L. Angew. Chem., Int. Ed. 2014, 53, 14508–14511. doi:10.1002/anie.201407494 |
| 50. | Kucharski, T. J.; Boulatov, R. J. Mater. Chem. 2011, 21, 8237–8255. doi:10.1039/c0jm04079g |
| 51. | Kucharski, T. J.; Huang, Z.; Yang, Q.-Z.; Tian, Y.; Rubin, N. C.; Concepcion, C. D.; Boulatov, R. Angew. Chem., Int. Ed. 2009, 48, 7040–7043. doi:10.1002/anie.200901511 |
| 52. | Dopieralski, P.; Anjukandi, P.; Rückert, M.; Shiga, M.; Ribas-Arino, J.; Marx, D. J. Mater. Chem. 2011, 21, 8309–8316. doi:10.1039/c0jm03698f |
| 53. | Dopieralski, P.; Ribas-Arino, J.; Marx, D. Angew. Chem., Int. Ed. 2011, 50, 7105–7108. doi:10.1002/anie.201100399 |
| 54. | Dopieralski, P.; Ribas-Arino, J.; Anjukandi, P.; Krupicka, M.; Kiss, J.; Marx, D. Nat. Chem. 2013, 5, 685–691. doi:10.1038/nchem.1676 |
| 55. | Dopieralski, P.; Ribas-Arino, J.; Anjukandi, P.; Krupicka, M.; Marx, D. Angew. Chem., Int. Ed. 2016, 55, 1304–1308. doi:10.1002/anie.201508005 |
| 56. | Dopieralski, P.; Ribas-Arino, J.; Anjukandi, P.; Krupicka, M.; Marx, D. Nat. Chem. 2017, 9, 164–170. doi:10.1038/nchem.2632 |
| 57. | Konôpka, M.; Rousseau, R.; Štich, I.; Marx, D. J. Am. Chem. Soc. 2004, 126, 12103–12111. doi:10.1021/ja047946j |
| 58. | Konôpka, M.; Turanský, R.; Reichert, J.; Fuchs, H.; Marx, D.; Štich, I. Phys. Rev. Lett. 2008, 100, 115503. doi:10.1103/PhysRevLett.100.115503 |
| 59. | Konôpka, M.; Turanský, R.; Dubecký, M.; Marx, D.; Štich, I. J. Phys. Chem. C 2009, 113, 8878–8887. doi:10.1021/jp9017025 |
| 60. | Krüger, D.; Fuchs, H.; Rousseau, R.; Marx, D.; Parrinello, M. Phys. Rev. Lett. 2002, 89, 186402. doi:10.1103/PhysRevLett.89.186402 |
| 61. | Ribas-Arino, J.; Shiga, M.; Marx, D. Angew. Chem., Int. Ed. 2009, 48, 4190–4193. doi:10.1002/anie.200900673 |
| 62. | Ribas-Arino, J.; Shiga, M.; Marx, D. Chem. – Eur. J. 2009, 15, 13331–13335. doi:10.1002/chem.200902573 |
| 63. | Ribas-Arino, J.; Shiga, M.; Marx, D. J. Am. Chem. Soc. 2010, 132, 10609–10614. doi:10.1021/ja104958e |
| 64. | Seema, P.; Behler, J.; Marx, D. Phys. Chem. Chem. Phys. 2013, 15, 16001–16011. doi:10.1039/c3cp52181h |
| 65. | Turanský, R.; Konôpka, M.; Doltsinis, N. L.; Štich, I.; Marx, D. ChemPhysChem 2010, 11, 345–348. doi:10.1002/cphc.200900690 |
| 66. | Zoloff Michoff, M. E.; Ribas-Arino, J.; Marx, D. Phys. Rev. Lett. 2015, 114, 075501. doi:10.1103/PhysRevLett.114.075501 |
| 67. | Avdoshenko, S. M.; Konda, S. S. M.; Makarov, D. E. J. Chem. Phys. 2014, 141, 134115. doi:10.1063/1.4896944 |
| 68. | Avdoshenko, S. M.; Makarov, D. E. J. Phys. Chem. B 2016, 120, 1537–1545. doi:10.1021/acs.jpcb.5b07613 |
| 69. | Brantley, J. N.; Konda, S. S. M.; Makarov, D. E.; Bielawski, C. W. J. Am. Chem. Soc. 2012, 134, 9882–9885. doi:10.1021/ja303147a |
| 70. | Konda, S. S. M.; Brantley, J. N.; Bielawski, C. W.; Makarov, D. E. J. Chem. Phys. 2011, 135, 164103. doi:10.1063/1.3656367 |
| 71. | Konda, S. S. M.; Brantley, J. N.; Varghese, B. T.; Wiggins, K. M.; Bielawski, C. W.; Makarov, D. E. J. Am. Chem. Soc. 2013, 135, 12722–12729. doi:10.1021/ja4051108 |
| 72. | Makarov, D. E. J. Chem. Phys. 2016, 144, 030901. doi:10.1063/1.4939791 |
| 73. | Bailey, A.; Mosey, N. J. J. Chem. Phys. 2012, 136, 044102. doi:10.1063/1.3678010 |
| 74. | Kochhar, G. S.; Mosey, N. J. Sci. Rep. 2016, 6, No. 23059. doi:10.1038/srep23059 |
| 4. | Beyer, M. K. Mechanochemical Reactions of Polymers. In Encyclopedia Of Polymer Science and Technology; Mark, H. F., Ed.; John Wiley and Sons: Inc.: Hoboken, NJ, USA, 2014; pp 1–20. doi:10.1002/0471440264.pst630 |
| 30. | Pill, M. F.; Kersch, A.; Clausen-Schaumann, H.; Beyer, M. K. Polym. Degrad. Stab. 2016, 128, 294–299. doi:10.1016/j.polymdegradstab.2016.03.025 |
| 61. | Ribas-Arino, J.; Shiga, M.; Marx, D. Angew. Chem., Int. Ed. 2009, 48, 4190–4193. doi:10.1002/anie.200900673 |
| 77. | Wolinski, K.; Baker, J. Mol. Phys. 2009, 107, 2403–2417. doi:10.1080/00268970903321348 |
| 30. | Pill, M. F.; Kersch, A.; Clausen-Schaumann, H.; Beyer, M. K. Polym. Degrad. Stab. 2016, 128, 294–299. doi:10.1016/j.polymdegradstab.2016.03.025 |
| 16. | Bretzlaff, R. S.; Wool, R. P. Macromolecules 1983, 16, 1907–1917. doi:10.1021/ma00246a019 |
| 17. | Wool, R. P. J. Polym. Sci., Polym. Phys. Ed. 1981, 19, 449–457. doi:10.1002/pol.1981.180190305 |
| 18. | Wool, R. P.; Boyd, R. H. J. Appl. Phys. 1980, 51, 5116–5124. doi:10.1063/1.327429 |
| 19. | Wool, R. P.; Statton, W. O. J. Polym. Sci., Polym. Phys. Ed. 1974, 12, 1575–1586. doi:10.1002/pol.1974.180120806 |
| 20. | Chalmers, J.; Mackenzie, M. W.; Willis, H. A.; Edwards, H. G. M.; Lees, J. S.; Long, D. A. Spectrochim. Acta, Part A 1991, 47, 1677–1683. doi:10.1016/0584-8539(91)80005-4 |
| 21. | Young, R. J. J. Text. Inst. 1995, 86, 360–381. doi:10.1080/00405009508631340 |
| 22. | Brownlow, S. R.; Moravsky, A. P.; Kalugin, N. G.; Majumdar, B. S. Compos. Sci. Technol. 2010, 70, 1460–1468. doi:10.1016/j.compscitech.2010.04.025 |
| 23. | Eichhorn, S. J.; Young, R. J. Compos. Sci. Technol. 2003, 63, 1225–1230. doi:10.1016/S0266-3538(03)00091-5 |
| 24. | Huang, Y.; Young, R. J. Carbon 1995, 33, 97–107. doi:10.1016/0008-6223(94)00109-D |
| 25. | Vettegren, V. I.; Novak, I. I. J. Polym. Sci., Part A-2 1973, 11, 2135–2142. doi:10.1002/pol.1973.180111105 |
| 26. | Vettegren, V. I.; Novak, I. I.; Friedland, K. J. Int. J. Fract. 1975, 11, 789–801. doi:10.1007/BF00012897 |
| 27. | Vettegren, V. I.; Novak, I. I.; Kulik, V. B. Phys. Solid State 2005, 47, 920–926. doi:10.1134/1.1924856 |
| 28. | Roylance, D. K.; DeVries, K. L. J. Polym. Sci., Part C: Polym. Lett. 1971, 9, 443–447. doi:10.1002/pol.1971.110090607 |
| 29. | Reynolds, J.; Sternstein, S. S. J. Chem. Phys. 1964, 41, 47–50. doi:10.1063/1.1725646 |
| 9. | Ribas-Arino, J.; Marx, D. Chem. Rev. 2012, 112, 5412–5487. doi:10.1021/cr200399q |
| 75. | Stauch, T.; Dreuw, A. Chem. Rev. 2016, 116, 14137–14180. doi:10.1021/acs.chemrev.6b00458 |
| 76. | Stauch, T.; Dreuw, A. Acc. Chem. Res. 2017, 50, 1041–1048. doi:10.1021/acs.accounts.7b00038 |
| 30. | Pill, M. F.; Kersch, A.; Clausen-Schaumann, H.; Beyer, M. K. Polym. Degrad. Stab. 2016, 128, 294–299. doi:10.1016/j.polymdegradstab.2016.03.025 |
| 75. | Stauch, T.; Dreuw, A. Chem. Rev. 2016, 116, 14137–14180. doi:10.1021/acs.chemrev.6b00458 |
| 80. | Stauch, T.; Dreuw, A. J. Chem. Phys. 2014, 140, 134107. doi:10.1063/1.4870334 |
| 30. | Pill, M. F.; Kersch, A.; Clausen-Schaumann, H.; Beyer, M. K. Polym. Degrad. Stab. 2016, 128, 294–299. doi:10.1016/j.polymdegradstab.2016.03.025 |
| 82. | Ahlrichs, R.; Bär, M.; Häser, M.; Horn, H.; Kölmel, C. Chem. Phys. Lett. 1989, 162, 165–169. doi:10.1016/0009-2614(89)85118-8 |
| 83. | TURBOMOLE, V7.0.2; University of Karlsruhe and Forschungszentrum Karlsruhe GmbH, 2015. |
| 30. | Pill, M. F.; Kersch, A.; Clausen-Schaumann, H.; Beyer, M. K. Polym. Degrad. Stab. 2016, 128, 294–299. doi:10.1016/j.polymdegradstab.2016.03.025 |
| 30. | Pill, M. F.; Kersch, A.; Clausen-Schaumann, H.; Beyer, M. K. Polym. Degrad. Stab. 2016, 128, 294–299. doi:10.1016/j.polymdegradstab.2016.03.025 |
| 81. | Adhikari, R.; Makarov, D. E. J. Phys. Chem. B 2017, 121, 2359–2365. doi:10.1021/acs.jpcb.6b12758 |
| 81. | Adhikari, R.; Makarov, D. E. J. Phys. Chem. B 2017, 121, 2359–2365. doi:10.1021/acs.jpcb.6b12758 |
| 27. | Vettegren, V. I.; Novak, I. I.; Kulik, V. B. Phys. Solid State 2005, 47, 920–926. doi:10.1134/1.1924856 |
| 81. | Adhikari, R.; Makarov, D. E. J. Phys. Chem. B 2017, 121, 2359–2365. doi:10.1021/acs.jpcb.6b12758 |
| 30. | Pill, M. F.; Kersch, A.; Clausen-Schaumann, H.; Beyer, M. K. Polym. Degrad. Stab. 2016, 128, 294–299. doi:10.1016/j.polymdegradstab.2016.03.025 |
© 2017 Sammon et al.; licensee Beilstein-Institut.
This is an Open Access article under the terms of the Creative Commons Attribution License (http://creativecommons.org/licenses/by/4.0), which permits unrestricted use, distribution, and reproduction in any medium, provided the original work is properly cited.
The license is subject to the Beilstein Journal of Organic Chemistry terms and conditions: (http://www.beilstein-journals.org/bjoc)