Abstract
Carbon dioxide (CO2) emissions from industrial processes, power generation, and transportation contribute significantly to global warming and climate change. Carbon capture and storage (CCS) technologies are essential to reduce these emissions and mitigate the effects of climate change. Cyclodextrins (CDs), cyclic oligosaccharides, are studied as potential CO2 capture agents due to their unique molecular structures and high selectivity towards CO2. In this paper we have investigated binding efficiency of a number of cyclodextrins towards CO2. It is found that the crystal structure of α-cyclodextrin with CO2 has a 1:1 stoichioimetry and that a number of simple and modified cyclodextrins bind CO2 in water with a Kg of 0.18–1.2 bar−1 (7–35 M−1) with per-O-methyl α-cyclodextrin having the highest CO2 affinity.

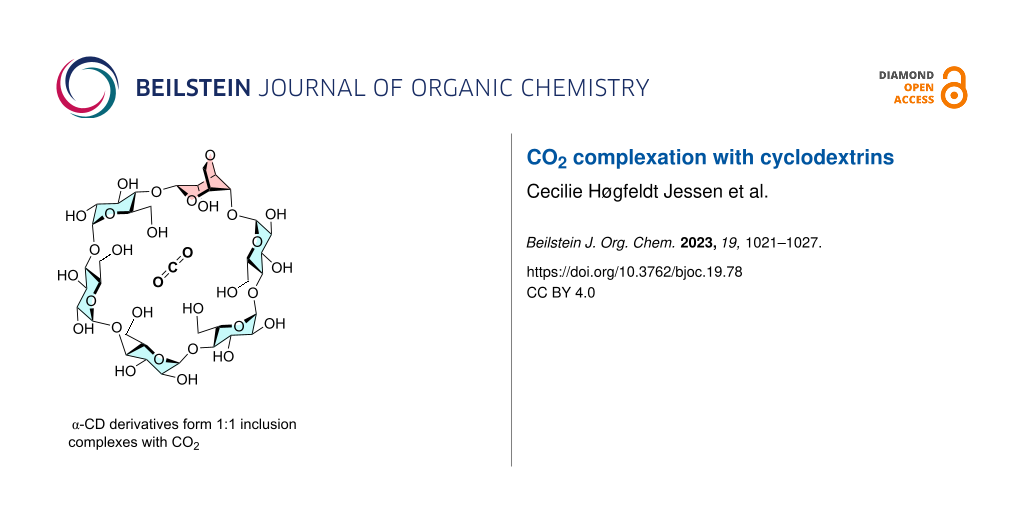
Graphical Abstract
Introduction
The concentration of carbon dioxide (CO2) in the Earth's atmosphere has increased significantly in recent decades [1,2] presumably due to human activity and the extensive burning of fossil fuels. With the ability of CO2 to absorb energy from sunlight [3], global warming and climate change is expected and serious consequences anticipated. To mitigate the effects of climate change, it is essential to reduce CO2 emissions from various sources, such as industrial processes, power generation, and transportation. Carbon capture and storage (CCS) technologies are crucial to achieving this goal. CCS technologies involve capturing CO2 from industrial processes or power plants, transporting it to a storage site, and storing it underground or consuming it by forming polymers [4] or fuels from CO2 [5,6]. However, the implementation of CCS technologies faces many challenges, including high costs, energy consumption, and the need for large-scale infrastructure. One of the characteristics of carbon capture technologies that use amines is the formation of a covalent bond to the CO2 molecule. This bond obviously has to be broken in order to regenerate the material with resulting energy cost [7]. It is therefore logical to explore capture alternatives where CO2 is captured by non-covalent binding.
Henglein and Cramer showed many years ago that α-cyclodextrin (1, Figure 1), when treated with CO2 under pressure for several days gave crystals with the gas trapped inside [8]. According to Cramer only 1 was able to form crystals, while larger cyclodextrins such as 2 and 3 and did not. Recently the solid complex of CO2 and 1 have been studied as a food product additive [9-11]. Anions of 1 in DMSO have been found to have a high capacity for capturing of CO2 [12]. Being cheap, biodegradable and eco-friendly these carbohydrates might form the basis in an economic CO2 capture technology. We have therefore studied the binding of CO2 to simple cyclodextrins to determine binding stoichiometry and affinity. It is found that the crystal structure of α-cyclodextrin with CO2 has 1:1 stoichioimetry and that a number of simple and modified cyclodextrins bind CO2 in water with a Kg of 0.18–1.2 bar−1 (7–35 M−1).
![[1860-5397-19-78-1]](/bjoc/content/figures/1860-5397-19-78-1.svg?scale=2.0&max-width=1024&background=FFFFFF)
Figure 1: Structure of cyclodextrins 1–6 studied in this work.
Figure 1: Structure of cyclodextrins 1–6 studied in this work.
Results and Discussion
When a saturated solution of 1 was treated with CO2 at a pressure from 6–20 bar in an autoclave for 1–19 days, crystals containing CO2 were obtained in 16–63% yield (Table 1). The most important factor for getting higher yields was sufficient time for the crystallization, while the pressure was found less important. From the binding constant measured below and the 1:1 stoichiometry (Kg = 0.18 bar−1, Table 2) we know that 1/2 to 3/4 of the cyclodextrin is filled with CO2 at the pressures used as shown in the 5th column of Table 1. As CO2 is in large excess high crystal yields can be obtained even though the CD cavity is only partially filled, because more CO2 is bound in solution as crystallization proceeds. When equilibrium is reached as in entries 1–3 (Table 1) the concentration of 1·CO2 is 0.04 M which must be the solubility of this complex in water. X-ray crystallography of the crystals showed a 1:1 complex of CO2 to α-CD with CO2 bound in the center of the wide, secondary rim of the α-CD cavity (Figure 2). Two of the hydroxymethyl side groups on the primary narrow rim are disordered. The disordering was modeled over two positions for each hydroxymethyl group with one of the positions leading to engagement in hydrogen bonding to water molecules bound at the narrow rim with a combined occupancy of 0.75. Additionally, five fully occupied water molecules are found in the structure one of which is best modeled as split over two positions yielding in total 5.75 mol of water per CO2. The hydration is similar to that of native α-CD [13] and that of the krypton inclusion complex which has 5.28 water/Kr [14]. The CO2 molecule refines with an optimal occupancy of 0.84 and linear geometry (178.2(6)o) with C–O bond lengths of 1.138(7) Å/1.146(5) Å. Refinement with full occupancy is also consistent with the diffraction data and yields realistic geometries.
Table 1: The results of crystallization of α-cyclodextrin from water in an atmosphere of CO2 carried out in a pressure autoclave. [CD]tot is the starting concentration of cyclodextrin. [CD·CO2]/[CD]tot is the calculated ratio of bound CO2 in solution using a Kg of 0.18 bar−1.
| Entry | CD | [CD]tot (M) | Pressure (bar) | [CD·CO2]/[CD]tot | Time (days) | Crystal yield |
| 1 | 1 | 0.15 | 6 | 52% | 19 | 48% |
| 2 | 1 | 0.15 | 7 | 56% | 3 | 50% |
| 3 | 1 | 0.15 | 10 | 64% | 2 | 63% |
| 4 | 1 | 0.15 | 17 | 75% | 1 | 17% |
| 5 | 1 | 0.15 | 20 | 78% | 1 | 16% |
![[1860-5397-19-78-2]](/bjoc/content/figures/1860-5397-19-78-2.png?scale=2.0&max-width=1024&background=FFFFFF)
Figure 2: X-ray crystal structure of CO2 bound to α-CD.
Figure 2: X-ray crystal structure of CO2 bound to α-CD.
When the crystals were treated with water, CO2 was released as bubbles as the crystals were dissolving, which was also very clearly observed under a microscope.
To get more information about the CO2 content in the crystal samples we also analyzed the crystals by thermogravimetric analysis. The crystal samples where heated to 26–200 °C at different rates and weight loss observed while the gas release was monitored by IR spectroscopy. Two distinguished weight decrease steps were seen in the TGA curve and very evident from the dTGA curve (Figure 3). The first weight decrease was seen around 50–75 °C and accounted for 5–6%, while the second weight decrease step normally was observed at 75–100 °C and accounte for 2–3%. IR analysis of the gas outlet showed both the characteristic water absorption at 3200–3600 cm−1 and the C=O band of CO2 at 2350 cm−1 during the both weigth losses but mainly CO2 at the first lump and predominantly water at the second loss. This also suggest a comparatively weak binding of the CO2.
![[1860-5397-19-78-3]](/bjoc/content/figures/1860-5397-19-78-3.png?scale=2.0&max-width=1024&background=FFFFFF)
Figure 3: TGA curve (blue) and dTGA curve (red) for CO2-1 crystals. Two lumps are seen with the former predominantly being CO2 and the second pre-dominantly water.
Figure 3: TGA curve (blue) and dTGA curve (red) for CO2-1 crystals. Two lumps are seen with the former predom...
We determined the binding constant for CO2 to cyclodextrins using a pressure cell and a UV–vis competition assay with an azo-dye (4-((4-hydroxyphenyl)azo)-1-naphthalenesulfonic acid (7) Figure 4) [15] as an indicator. The UV–vis spectrum of 7 changes on binding to cyclodextrins and we can thereby indirectly monitor the binding of CO2 to the CD by observing the change in spectrum of 7 provided 7 and CO2 compete for the binding site. To avoid problems with formation of hydrogencarbonate the experiments were conducted in a buffer at pH 3 where only a minor fraction of the carbonic acid (pKa1 = 3.6) is dissociated and since the hydration constant of CO2 is small (1.7 × 10⁻³) more than 99% of CO2 in solution is the dissolved gas at this pH. First the dissociation constants of 7–CD complexes at pH 3, were determined (Table 2). When a solution of 7 and excess cyclodextrin was subjected to a CO2 atmosphere at 2–8 bar in the pressure cell this gave, after equilibration for 2 hours, a change in the vis spectrum (Figure 4). The change was consistent with the displacement of 7 from the cavity by CO2 and change in the amount of azodye was used to calculate the amount of CO2 bound to the cyclodextrin. From the change in absorption at 370 nm as compared to the reference spectrum without cyclodextrin, we determined the gas binding constants from non-linear regression of bound CO2 versus CO2 pressure as shown for 1 in Figure 5. This gave the gas binding constant Kg = [CD·CO2]/[CD]PCO2 given in Table 2 in bar−1. This constant gives the fraction of CD bound CO2 in water under a partial pressure of CO2. Using a literature value of the solubility of CO2 in water at 1 bar (34 mM) and Henrys law the more traditional aqueous binding constant Ka = [CD·CO2]/[CD][CO2] in molar terms could be calculated (Table 2). For α-cyclodextrin (1) a Kg of 0.18 bar−1 was obtained – a small value, which means that even at a partial pressure of 5 bar less than 1/2 the CD cavity is filled. The rationale for the poor binding is probably the large discrepancy between the size of CO2 and the CD cavity. 1 has a cavity of 174 Å3 while CO2 is a very small molecule with kinetic diameter of 3.3 Å and a spherical volume of only 19 Å3.
![[1860-5397-19-78-4]](/bjoc/content/figures/1860-5397-19-78-4.svg?scale=2.0&max-width=1024&background=FFFFFF)
Figure 4: Cell used to measure vis spectra under pressure (left), structure of 7 (middle) and spectrum of 7 (40 μM) and 1 (2 mM) in citrate phospate buffer pH 3 (right) from 350–400 nm with 0 (blue), 2 (red), 4 (green), 6 (orange) and 8 (grey) bar of CO2.
Figure 4: Cell used to measure vis spectra under pressure (left), structure of 7 (middle) and spectrum of 7 (...
![[1860-5397-19-78-5]](/bjoc/content/figures/1860-5397-19-78-5.png?scale=2.0&max-width=1024&background=FFFFFF)
Figure 5: Binding of CO2 to 1 as a function of pressure.
Figure 5: Binding of CO2 to 1 as a function of pressure.
Table 2: Kd for binding of 7 and Ka for binding CO2 for cyclodextrin derivatives in citrate-phosphate buffer at pH 3.
| CD | Residuesa | Kd of 7 at pH 3 (M) | Kg for CO2 (bar−1) | Ka for CO2 (M−1)b | Cavity volumec |
| 1 (α-CD) | 6 | 4.51 (±1.42) × 10−4 | 0.18 ± 0.02 | 5.3 ± 0.6 | 174 Å3 |
| 2 (β-CD) | 7 | 7.36 (±3.16) × 10−4 | no binding | no binding | 262 Å3 |
| 3 (γ-CD) | 8 | 1.63 (±1.3) × 10−4 | no binding | no binding | 427 Å3 |
| 4 | 6 | 1.33 (±0.31) × 10−4 | 1.2 ± 0.14 | 35 ± 4.1 | 174 Å3 |
| 5 | 6 | 2.25 (±0.11) × 10−3 | 0.75 ± 0.08 | 22 ± 2.4 | 155 Å3 |
| 6 | 6 | 1.39 (±0.25) × 10−3 | 0.34 ± 0.06 | 9.8 ± 1.8 | 115 Å3 |
aNumber of monosaccharide residues. bCalculated from the value in bar−1 by dividing with solubility of CO2 at one bar. cCalculated as described by Szejtli [18].
The binding for 2 and 3 and for the three derivatives of 1, 4, 5 and 6 were also investigated and the binding curves for determination of Kg for these derivatives are shown in Supporting Information File 1 (Figures S1–S3). The rationale for these compounds were the following:
- β- (2) and γ-cyclodextrins (3) were also studied by Cramer, but gave no crystals although they might still bind CO2.
- Compound 4 (permethylated α-cyclodextrin) [16] is in terms of hydrogen bonding properties and polarity vastly different from 1 yet still water-soluble.
- Compounds 5 and 6 containing 3,6-anhydrides in the α-cyclodextrin structure were chosen because they have a smaller cavity according to modelling. In models the diameter of 5 was measured and it was 5.0 Å and that of 6 was 4.6 Å with an α-CD height of 7.9 Å to give the cavity volumes given in Table 2. These compounds were made by tosylation of the corresponding partially benzylated cyclodextrins, hydrogenolysis and base treatment (see Supporting Information File 1 for experimental details). Compounds 5 and 6 have previously been made by direct tosylation of α-cyclodextrin which is a shorter route [17]. However, in our hands the direct tosylations were difficult to handle and the protection–deprotection route proved a more reliable route to pure compounds.
For 2 and 3 we found no binding which is in line with the absence of gas-crystals from these cyclodextrins. The lack of binding must, in part, be linked to the very large cavities of these molecules (Table 2). The anhydrocyclodextrins 5 and 6 have a slightly stronger binding than 1, which on the other hand is due to these molecules having smaller cavities, although the less modified and larger monoanhydro derivative 5 was the stronger binder revealing that other factors are important. The permethylated cyclodextrin 4 was found to be the best CO2 binder, which presumably is related to its hydrophobic character. Compound 4 is known to bind little water in the crystal (1 or 0 molecules) and probably also in solution as witnessed by its reverse temperature dependence on solubility in water [16]. Therefore, binding of the unipolar CO2 molecule is expected to cause less water H-bond disruption in this host.
Conclusion
This work shows that CO2 is bound 1:1 by α-cyclodextrins and that the affinity can be improved with a smaller cavity and more lipophilic cyclodextrin derivative. It suggests that stronger CO2 binders can be found by improving on these two traits.
Experimental
Crystallization experiments. A cyclodextrin solution was prepared by dissolving 1 in Milli-Q water to the indicated concentration (Table 1) . The solution was then filtered, placed in an autoclave and pressurized with CO2 gas (pressure 6–20 bar) at 25 °C for 1–17 days. The resulting crystals were collected and filtered by suction filtration. The crystals were left to dry in a desiccator at normal pressure over CaCl2.
X-ray analysis. The x-ray crystallographic studies were carried out on single crystals, which were coated with mineral oil, mounted on kapton loops, and transferred to the nitrogen cold stream of the diffractometer. The single-crystal X-ray diffraction studies were performed at 100(2) K on a Bruker D8 VENTURE diffractometer equipped with a Mo Kα high-brilliance IμS radiation source (λ = 0.71073 Å), a multilayer X-ray mirror and a PHOTON 100 CMOS detector, and an Oxford Cryosystems low temperature device. The instrument was controlled with the APEX3 software package using SAINT (Bruker; Bruker AXS, Inc. SAINT, Version 7.68A; Bruker AXS: Madison, WI, 2009). Final cell constants were obtained from least squares fits of several thousand strong reflections. Intensity data were corrected for absorption using intensities of redundant reflections with the program SADABS (Sheldrick, G. version 2008/2; University of Göttingen: Germany, 2003). The structures were solved in Olex2 using SHELXT and refined using SHELXL (Table 3) [19]. There is some disorder in one water molecule, which was modelled over two positions and some disorder in at least two of the primary alcohol groups, which was modelled. The latter disorder is not uncommon in α-cyclodextrin structures [20]. In the reported structure, CO2 was refined with an occupancy of 0.84.
Table 3: Crystal data and structure refinement for α-CD•CO2•5.75 H2O.
| CCDC deposition number | CCDC 2266629 |
| empirical formula | C36.84H69.45O37.42 |
| formula weight | 1113.90 |
| T/K | 100(2) |
| crystal system | orthorhombic |
| space group | P212121 |
| a/Å | 9.3721(6) |
| b/Å | 14.3361(10) |
| c/Å | 37.100(2) |
| α/° | 90 |
| β/° | 90 |
| γ/° | 90 |
| volume/Å3 | 4984.8(6) |
| Z | 4 |
| ρcalcg/cm3 | 1.484 |
| μ/mm-1 | 0.135 |
| F(000) | 2365.0 |
| crystal size/mm3 | 0.244 × 0.42 × 0.28 |
| radiation | Mo Kα (λ = 0.71073) |
| 2Θ range for data collection/° | 4.35 to 61.996 |
| index ranges | −13 ≤ h ≤ 13, −20 ≤ k ≤ 20, −47 ≤ l ≤ 53 |
| reflections collected | 76519 |
| independent reflections | 15881 [Rint = 0.0370, Rsigma = 0.0321] |
| data/restraints/parameters | 15881/20/758 |
| goodness-of-fit on F2 | 0.993 |
| final R indexes [I>=2σ (I)] | R1 = 0.0396, wR2 = 0.0966 |
| final R indexes [all data] | R1 = 0.0477, wR2 = 0.1016 |
| largest diff. peak/hole / e Å−3 | 0.84/-0.53 |
| Flack parameter | 0.16(15) |
TGA measurements. These analyses were carried out on a Netzsch TG 209 F1 Libra fitted with a FTIR detector from Bruker. Samples were prepared by crushing the crystals before putting them in an aluminium crucible ensuring full coverage of the bottom. The analysis shown in Figure 3 was started at 28 °C, and was finished at a temperature of 150 °C with a heating rate of 5 °C/min.
Determination of dissociation constants between 7 and CD’s. Samples were prepared that consisted of citrate-phosphate buffer (pH 3, 50 mM), 7 (40 μM) and an increasing concentration of cyclodextrin (1–6; [CD] = 0 or 1.3–22 mM). For each sample the spectrum was recorded from λ = 350–600 nm. For each cyclodextrin a change in the vis spectrum of 7 was seen. From Benesi–Hildebrand plots at 380 nm the Kd values given in Table 2 were found.
Determination of association constants between CD’s and CO2. Samples were prepared that consisted of citrate-phosphate buffer (pH 3, 50 mM), 7 (40 μM) and a fixed concentration of cyclodextrin ([CD]o; 1–4 mM) and put into the pressure cell. The spectrum was recorded at 0, 2, 4 , 6 and/or 8 bar CO2 pressure over the liquid after a 2–4 hour gas–liquid equilibration period. The Kg was determined as follows: [CD(7)] (and [7]) was calculated at each pressure from the change in absorption at 370 nm. From this [CD] was determined from the equation Kd = [CD][7]/[CD(7)] and [CD(CO2)] was calculated as CDtot − [CD] − [CD(7)]. Now Kg was calculated by non-linear regression of [CD(CO2)] vs PCO2 as following the equation [CD(CO2)] = [CD]oPCO2/(PCO2+(1/Kg)) as shown for 1 in Figure 5 and for 4–6 in Supporting Information File 1 (Figures S1–S3). This gave the Kg values in Table 2.
Supporting Information
| Supporting Information File 1: Experimental and analytical data. | ||
| Format: PDF | Size: 2.4 MB | Download |
Funding
800 MHz NMR data was recorded at cOpenNMR an infrastructure facility funded by the Novo Nordisk Foundation (#NNF18OC0032996). We also thank the Novo Nordisk foundation for financial support through NMR infrastructure grant (NNF21OC0067315) and project grant (NNF21OC0071886), and the Carlsberg foundation for infrastructure grant CF21-0152.
References
-
Keeling, C. D. Annu. Rev. Energy Environ. 1998, 23, 25–82. doi:10.1146/annurev.energy.23.1.25
Return to citation in text: [1] -
Lüthi, D.; Le Floch, M.; Bereiter, B.; Blunier, T.; Barnola, J.-M.; Siegenthaler, U.; Raynaud, D.; Jouzel, J.; Fischer, H.; Kawamura, K.; Stocker, T. F. Nature 2008, 453, 379–382. doi:10.1038/nature06949
Return to citation in text: [1] -
Evans, J. Elements of a Sustainable World; Oxford University Press, 2020. doi:10.1093/oso/9780198827832.001.0001
Return to citation in text: [1] -
Klaus, S.; Lehenmeier, M. W.; Anderson, C. E.; Rieger, B. Coord. Chem. Rev. 2011, 255, 1460–1479. doi:10.1016/j.ccr.2010.12.002
Return to citation in text: [1] -
Ohno, H.; Ikhlayel, M.; Tamura, M.; Nakao, K.; Suzuki, K.; Morita, K.; Kato, Y.; Tomishige, K.; Fukushima, Y. Green Chem. 2021, 23, 457–469. doi:10.1039/d0gc03349a
Return to citation in text: [1] -
Albero, J.; Peng, Y.; García, H. ACS Catal. 2020, 10, 5734–5749. doi:10.1021/acscatal.0c00478
Return to citation in text: [1] -
Panja, P.; McPherson, B.; Deo, M. Carbon Capture Sci. Technol. 2022, 3, 100041. doi:10.1016/j.ccst.2022.100041
Return to citation in text: [1] -
Cramer, F.; Henglein, F. M. Chem. Ber. 1957, 90, 2572–2575. doi:10.1002/cber.19570901123
Return to citation in text: [1] -
Li, H.; Zhang, B.; Li, C.; Fu, X.; Wang, Z.; Huang, Q. Food Chem. 2019, 289, 145–151. doi:10.1016/j.foodchem.2019.03.037
Return to citation in text: [1] -
Ho, T. M.; Howes, T.; Bhandari, B. R. Food Chem. 2015, 187, 407–415. doi:10.1016/j.foodchem.2015.04.094
Return to citation in text: [1] -
Ho, T. M.; Howes, T.; Bhandari, B. R. J. Food Process. Preserv. 2018, 42, e13514. doi:10.1111/jfpp.13514
Return to citation in text: [1] -
Eftaiha, A. F.; Qaroush, A. K.; Alsoubani, F.; Pehl, T. M.; Troll, C.; Rieger, B.; Al-Maythalony, B. A.; Assaf, K. I. RSC Adv. 2018, 8, 37757–37764. doi:10.1039/c8ra08040b
Return to citation in text: [1] -
Manor, P. C.; Saenger, W. J. Am. Chem. Soc. 1974, 96, 3630–3639. doi:10.1021/ja00818a042
Return to citation in text: [1] -
Saenger, W.; Noltemeyer, M. Chem. Ber. 1976, 109, 503–517. doi:10.1002/cber.19761090214
Return to citation in text: [1] -
Cramer, F.; Saenger, W.; Spatz, H.-C. J. Am. Chem. Soc. 1967, 89, 14–20. doi:10.1021/ja00977a003
Return to citation in text: [1] -
Steiner, T.; Saenger, W. Carbohydr. Res. 1996, 282, 53–63. doi:10.1016/0008-6215(95)00364-9
Return to citation in text: [1] [2] -
Fujita, K.; Tahara, T.; Egashira, Y.; Yamamura, H.; Imoto, T.; Koga, T.; Fujioka, T.; Mihashi, K. Chem. Lett. 1988, 17, 705–708. doi:10.1246/cl.1988.705
Return to citation in text: [1] -
Szejtli, J. Chem. Rev. 1998, 98, 1743–1754. doi:10.1021/cr970022c
Return to citation in text: [1] -
Sheldrick, G. M. Acta Crystallogr., Sect. A: Found. Crystallogr. 2008, 64, 112–122. doi:10.1107/s0108767307043930
Return to citation in text: [1] -
Aree, T.; Jacob, J.; Saenger, W.; Hoier, H. Carbohydr. Res. 1998, 307, 191–197. doi:10.1016/s0008-6215(97)10109-4
Return to citation in text: [1]
| 20. | Aree, T.; Jacob, J.; Saenger, W.; Hoier, H. Carbohydr. Res. 1998, 307, 191–197. doi:10.1016/s0008-6215(97)10109-4 |
| 1. | Keeling, C. D. Annu. Rev. Energy Environ. 1998, 23, 25–82. doi:10.1146/annurev.energy.23.1.25 |
| 2. | Lüthi, D.; Le Floch, M.; Bereiter, B.; Blunier, T.; Barnola, J.-M.; Siegenthaler, U.; Raynaud, D.; Jouzel, J.; Fischer, H.; Kawamura, K.; Stocker, T. F. Nature 2008, 453, 379–382. doi:10.1038/nature06949 |
| 7. | Panja, P.; McPherson, B.; Deo, M. Carbon Capture Sci. Technol. 2022, 3, 100041. doi:10.1016/j.ccst.2022.100041 |
| 16. | Steiner, T.; Saenger, W. Carbohydr. Res. 1996, 282, 53–63. doi:10.1016/0008-6215(95)00364-9 |
| 5. | Ohno, H.; Ikhlayel, M.; Tamura, M.; Nakao, K.; Suzuki, K.; Morita, K.; Kato, Y.; Tomishige, K.; Fukushima, Y. Green Chem. 2021, 23, 457–469. doi:10.1039/d0gc03349a |
| 6. | Albero, J.; Peng, Y.; García, H. ACS Catal. 2020, 10, 5734–5749. doi:10.1021/acscatal.0c00478 |
| 19. | Sheldrick, G. M. Acta Crystallogr., Sect. A: Found. Crystallogr. 2008, 64, 112–122. doi:10.1107/s0108767307043930 |
| 4. | Klaus, S.; Lehenmeier, M. W.; Anderson, C. E.; Rieger, B. Coord. Chem. Rev. 2011, 255, 1460–1479. doi:10.1016/j.ccr.2010.12.002 |
| 16. | Steiner, T.; Saenger, W. Carbohydr. Res. 1996, 282, 53–63. doi:10.1016/0008-6215(95)00364-9 |
| 3. | Evans, J. Elements of a Sustainable World; Oxford University Press, 2020. doi:10.1093/oso/9780198827832.001.0001 |
| 17. | Fujita, K.; Tahara, T.; Egashira, Y.; Yamamura, H.; Imoto, T.; Koga, T.; Fujioka, T.; Mihashi, K. Chem. Lett. 1988, 17, 705–708. doi:10.1246/cl.1988.705 |
| 13. | Manor, P. C.; Saenger, W. J. Am. Chem. Soc. 1974, 96, 3630–3639. doi:10.1021/ja00818a042 |
| 15. | Cramer, F.; Saenger, W.; Spatz, H.-C. J. Am. Chem. Soc. 1967, 89, 14–20. doi:10.1021/ja00977a003 |
| 12. | Eftaiha, A. F.; Qaroush, A. K.; Alsoubani, F.; Pehl, T. M.; Troll, C.; Rieger, B.; Al-Maythalony, B. A.; Assaf, K. I. RSC Adv. 2018, 8, 37757–37764. doi:10.1039/c8ra08040b |
| 9. | Li, H.; Zhang, B.; Li, C.; Fu, X.; Wang, Z.; Huang, Q. Food Chem. 2019, 289, 145–151. doi:10.1016/j.foodchem.2019.03.037 |
| 10. | Ho, T. M.; Howes, T.; Bhandari, B. R. Food Chem. 2015, 187, 407–415. doi:10.1016/j.foodchem.2015.04.094 |
| 11. | Ho, T. M.; Howes, T.; Bhandari, B. R. J. Food Process. Preserv. 2018, 42, e13514. doi:10.1111/jfpp.13514 |
| 8. | Cramer, F.; Henglein, F. M. Chem. Ber. 1957, 90, 2572–2575. doi:10.1002/cber.19570901123 |
| 14. | Saenger, W.; Noltemeyer, M. Chem. Ber. 1976, 109, 503–517. doi:10.1002/cber.19761090214 |
© 2023 Jessen et al.; licensee Beilstein-Institut.
This is an open access article licensed under the terms of the Beilstein-Institut Open Access License Agreement (https://www.beilstein-journals.org/bjoc/terms), which is identical to the Creative Commons Attribution 4.0 International License (https://creativecommons.org/licenses/by/4.0). The reuse of material under this license requires that the author(s), source and license are credited. Third-party material in this article could be subject to other licenses (typically indicated in the credit line), and in this case, users are required to obtain permission from the license holder to reuse the material.