Abstract
The influence of the grain boundary (GB) specific area sGB on the appearance of ferromagnetism in Fe-doped ZnO has been analysed. A review of numerous research contributions from the literature on the origin of the ferromagnetic behaviour of Fe-doped ZnO is given. An empirical correlation has been found that the value of the specific grain boundary area sGB is the main factor controlling such behaviour. The Fe-doped ZnO becomes ferromagnetic only if it contains enough GBs, i.e., if sGB is higher than a certain threshold value sth = 5 × 10⁴ m2/m3. It corresponds to the effective grain size of about 40 μm assuming a full, dense material and equiaxial grains. Magnetic properties of ZnO dense nanograined thin films doped with iron (0 to 40 atom %) have been investigated. The films were deposited by using the wet chemistry “liquid ceramics” method. The samples demonstrate ferromagnetic behaviour with Js up to 0.10 emu/g (0.025 μB/f.u.ZnO) and coercivity Hc ≈ 0.03 T. Saturation magnetisation depends nonmonotonically on the Fe concentration. The dependence on Fe content can be explained by the changes in the structure and contiguity of a ferromagnetic “grain boundary foam” responsible for the magnetic properties of pure and doped ZnO.
Introduction
The possibility of ferromagnetism (FM) in oxides has been widely debated since 2000. In their theoretical work, Dietl et al. discussed the chances for oxides to possess saturation of magnetisation in an external magnetic field, coercivity, and a Curie temperature above room temperature (RT) [1]. According to their theory, FM could appear if one dopes the oxides (especially ZnO) with “magnetic” atoms such as Co, Mn, or Fe. Such transition-metal (TM) ions induce FM ordering into a magnetically polarized oxide lattice modified by doping. After publication of their paper [1] a lot of theoretical and experimental works were carried out in order to find the “promised” FM behaviour of zinc oxide (see [2-6] and references therein). However, the obtained results were quite contradictory. Several teams of experimentalists reported observations of weak but quite reproducible ferromagnetism. Other research groups never succeeded in synthesizing ferromagnetic ZnO. The huge interest in FM in ZnO is because it is a cheap semiconductor that is widely used in various devices and technologies. The FM behaviour, in addition to the attractive optical and semiconductor properties, could open the way for the future applications of FM ZnO in spintronics [2]. Recently we proposed an explanation for the contradictory results in the investigations of FM ZnO [6]. We observed, that FM behaviour does not appear in bulk ZnO (even doped by Mn or Co), but only in polycrystalline samples with very high specific area sGB of grain boundaries (GBs), i.e., the ratio of GB area to grain volume [6]. Only in the case where the specific area of grain boundaries in ZnO exceeds a certain threshold called sth, does the ferromagnetism appear. If sGB is high enough, even the doping by TM ions is not essential, and FM appears in pure, undoped ZnO. The viewpoint that GBs are the reason for FM in ZnO became generally accepted in the past few years [3,7-16]. Therefore, it is important to continue the investigations into the GB-induced ferromagnetic behaviour of TM-doped ZnO. We were able to observe the FM behaviour even in pure ZnO due to the extremely small grain size in our films deposited by the original method of so-called “liquid ceramics”, which is based on the application of organic acids for the solution of metallic ions for pure and Mn- and Co-doped ZnO [6,17,18].
The observed dependence of the saturation magnetization of Mn- and Co-doped ZnO on the Mn and Co concentration showed complicated nonmonotonic behaviour [17,18]. The concentration dependence for Co-doped ZnO films has one maximum [18], and the concentration dependence for Mn-doped ZnO films has two maxima [17]. The shape of the dependence of the saturation magnetization on the Mn and Co concentration is different for the Mn- and Co-doped nanograined ZnO manufactured by different methods. It is most probably controlled by the topology of the GB network (ferromagnetic GB foam) in the ZnO polycrystals. Our findings strongly suggest that GBs and related vacancies are the intrinsic origin of RT ferromagnetism. We can also suppose another reason for the fact that the concentration dependence of the saturation magnetization for Co-doped ZnO films has one maximum [18], and the concentration dependence for Mn-doped ZnO films has two maxima [17]. It is probably due to the fact that cobalt demonstrates only one oxidation state Co3+ whereas manganese can possess several oxidation states, namely +2, +3 and +4 [17,18]. Together with cobalt and manganese, iron is one of the most important dopants in ZnO. Similar to manganese, iron has different oxidation states (Fe2+ and Fe3+). This fact prompts us to check, whether the concentration dependence of the saturation magnetization for Fe-doped ZnO films has one or two maxima. Therefore, the goals of this work are to determine the threshold value sth of the specific GB area for Fe-doped zinc oxide and to analyse experimentally the influence of Fe on the saturation magnetization of ZnO in a broad interval of Fe concentrations.
Experimental
Pure and Fe-doped ZnO thin films consisting of dense equiaxial nanograins were produced by using the novel method of liquid ceramics [19]. Zinc(II) butanoate diluted in an organic solvent with zinc concentrations between 1 and 4 kg/m3 was used as a precursor for the preparation of pure ZnO films. For the ZnO films that were doped with 0.1, 5, 12, 20, 31, and 40 atom % Fe, zinc(II) butanoate solution was mixed with an iron(III) butanoate solution in suitable proportions. The butanoate precursor was deposited onto (102) single-crystalline sapphire substrates. Drying at 100 °C in air for about 30 min was followed by thermal pyrolysis in an electrical furnace in air at 550 °C. The Zn and Fe content in doped oxides was measured by atomic absorption spectroscopy in a Perkin-Elmer spectrometer and electron-probe microanalysis (EPMA). EPMA investigations were carried out in a Tescan Vega TS5130 MM microscope equipped by the LINK energy-dispersive spectrometer produced by Oxford Instruments. The presence of other magnetic impurities, such as Mn, Co, and Ni, was below 0.001 atom %. During the long preparation procedure all possible precautions were taken to exclude any additional FM contaminations (for example, nonmagnetic ceramic scissors and tweezers, etc., were used). It is known from the literature [20] that the effect of a contaminated substrate can completely conceal the ferromagnetic signal of ZnO itself. We carefully measured the magnetization curves for bare Al2O3 substrates and subtracted them from data for the substrates including ZnO films. The films were transparent and sometimes with a very slight greenish finish. The films had a thickness between 50 and 200 nm, determined using edge-on transmission electron microscopy (TEM) and EPMA. TEM investigations were carried out on a Jeol JEM–4000FX microscope at an accelerating voltage of 400 kV. X-ray diffraction (XRD) data were obtained on a Siemens diffractometer (Cu Kα radiation). Evaluation of the grain size D from the X-ray peak broadening was performed by using the Scherrer equation [21]. The magnetic properties were measured on a superconducting quantum interference device (Quantum Design MPMS-7 and MPMS-XL). The magnetic field was applied parallel to the sample plane (“in plane”). The diamagnetic background signals, generated by the sample holder and the substrate, were carefully subtracted, due to the small absolute magnetic moments measured in the range of 10−6 to 10−4 emu.
Results
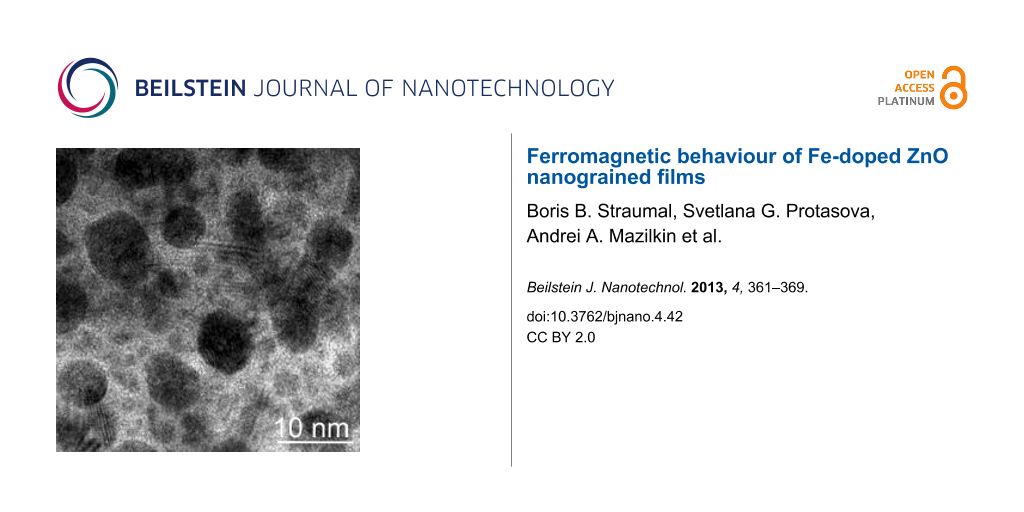
Using the method of liquid ceramics, we deposited nanograined (the size of equiaxial grains was 10 to 30 nm) and poreless pure and Fe-doped ZnO thin films (see micrographs in Figure 1a). In the samples with 0.1, 5, 12, and 20 atom % Fe only pure quartzite grains are present, according to the studies with selected area diffraction (Figure 1b), TEM and XRD. These methods reveal the presence of ternary cubic zinc–iron oxide ZnFe2O4 in samples with 31 and 40 atom % Fe. No visible texture can be observed in the deposited thin films, namely the diffraction rings shown in Figure 1b are uniform without any preferred orientations of ZnO grains.
![[2190-4286-4-42-1]](/bjnano/content/figures/2190-4286-4-42-1.jpg?scale=2.0&max-width=1024&background=FFFFFF)
Figure 1: (a) Bright-field TEM micrograph of the nanograined pure ZnO thin film deposited on a sapphire substrate by the novel liquid ceramics method. Electron diffraction pattern (b) shows only rings from the ZnO wurtzite structure; no texture is visible. Bright spots originate from the sapphire substrate.
Figure 1: (a) Bright-field TEM micrograph of the nanograined pure ZnO thin film deposited on a sapphire subst...
The observed FM behaviour in doped nanocrystalline as well as in dense ZnO films with 0.1 atom % Fe is depicted in Figure 2. Shown is the pronounced FM indicated by the saturation of magnetization (Js ≈ 0.10 emu/g or 0.025 μB/f.u.ZnO (units of Bohr magnetons per formula unit of ZnO) above the applied field ≈1.5 T) and hysteretic behaviour with coercivity Hc ≈ 0.03 T (see the inset). These magnetization and coercivity values are close to those obtained by other methods for the Fe-doped samples [22-47].
![[2190-4286-4-42-2]](/bjnano/content/figures/2190-4286-4-42-2.png?scale=1.8&max-width=1024&background=FFFFFF)
Figure 2: Magnetization (calibrated in units of Bohr magnetons per formula unit of ZnO) at RT for ZnO thin films doped with 0.1 atom % Fe deposited on the sapphire substrate. The curve was obtained after subtracting the magnetic contribution from the substrate and the sample holder. The inset shows the magnified central part of the magnetisation curve.
Figure 2: Magnetization (calibrated in units of Bohr magnetons per formula unit of ZnO) at RT for ZnO thin fi...
The saturation magnetization depends nonmonotonically on the Fe concentration (Figure 3). It increases more than ten times upon increase of the Fe content from 0 to 0.1 atom %. The magnetization drops down on further increase in Fe concentration and becomes almost indistinguishable from the background at around 20 atom % Fe. Above a concentration of 20 atom % Fe the magnetization increases again and reaches a value of about 0.09 emu/g (0.022 μB/f.u.ZnO) at 40 atom % Fe.
![[2190-4286-4-42-3]](/bjnano/content/figures/2190-4286-4-42-3.png?scale=1.8&max-width=1024&background=FFFFFF)
Figure 3: Dependence of the saturation magnetization Js (magnetic moment in units of Bohr magnetons per ZnO formula units) on the Fe concentration in ZnO nanograined polycrystals obtained by the “liquid ceramics” method.
Figure 3: Dependence of the saturation magnetization Js (magnetic moment in units of Bohr magnetons per ZnO f...
Discussion
We critically analysed the published papers on the search for possible ferromagnetic behaviour in the Fe-doped ZnO [22-66]. The results are summarized in Figure 4 in a T–sGB plot (here T represents the annealing or synthesis temperature). They can be divided into three groups, depending on the sGB value. First, the samples obtained by the magnetron and ion-beam sputter deposition or pulsed laser deposition (PLD) having small and very small grains are almost always ferromagnetic [22-47]. The respective (filled) points are grouping in the right part of the diagram in Figure 4. Second, the coarse-grained samples synthesised by the conventional powder sintering method, bulk single crystals or single-crystalline films are always diamagnetic or paramagnetic [48-55]. They are positioned in the left part of the diagram in Figure 4. In between one finds the third group of the data, namely obtained for the samples produced by chemical vapour deposition (CVD), solution combustion or wet chemistry methods. They have intermediate properties and can be either paramagnetic or FM [56-66].
![[2190-4286-4-42-4]](/bjnano/content/figures/2190-4286-4-42-4.png?scale=1.8&max-width=1024&background=FFFFFF)
Figure 4: FM (full symbols) and para- or diamagnetic (open symbols) behaviour of Fe-doped ZnO in dependence on the specific GB area, sGB, the ratio of GB area to volume, at different preparation temperatures T. A vertical line marks the estimated threshold value sth. The enlarged symbol indicates the experimental data obtained by the authors’ own investigations (for symbols and references see the text).
Figure 4: FM (full symbols) and para- or diamagnetic (open symbols) behaviour of Fe-doped ZnO in dependence o...
We used different approaches in order to determine the value sGB, the ratio of grain boundary area to volume, basing on the published data [22-66]. Quite frequently the grain size has been carefully measured in published works (using TEM micrographs or XRD peak broadening) and directly quoted in the text. For other works we estimated the grain size ourselves basing again on the published TEM micrographs or XRD spectra. In such cases the points in Figure 4 have substantial error bars. The single crystals and single crystalline films [26,49] have no GBs, and formally the sGB value is zero for them. We choose the value of sGB = 4 × 10² m2/m3 in order to indicate such data in Figure 4 (open squares). If the samples studied in the literature were poreless and contain equiaxial grains with mean grain size D, we calculated the sGB as sGB = 1.65/D. This formula is true for the space optimally filled with tetrakaidecahedrons (i.e., polyhedrons with 14 faces) [6]. It was used for the samples obtained by sintering of conventional [30,37,44,48-52,54,55,58,64] or nanopowders [24,29,32,41,42,46,53,56,59,65,66], or for films obtained by sol–gel method, pyrolysis, CVD or PLD [22,23,25,27,28,45]. If the samples mentioned in the analysed papers were not poreless, such as in the partly sintered powders (open and filled diamonds) [29,32,37,44,50,52,53,56,59,62,65], nanorods, or nanowires (open and filled down-triangles) [34,43,57,61], we introduced the additional porosity coefficient, p, for the sGB. p varies from 0 for nonsintered powders to 1 for the fully compacted polycrystals. We estimated p values using the published micrographs. In many cases the samples were poreless; however, the grains were not equiaxial but elongated [31,33,38-40,60] or flattened [35,36,45,47,66] (open and filled up-triangles). In these cases sGB = 1.65a/D, D is the mean grain width and a is the aspect ratio (ratio of grain width to grain height). For the flattened grains a > 1, for the elongated ones a < 1.
The results for Fe-doped ZnO are summarized in Figure 4 in a T-sGB plot. Indeed, the results clearly reveal a dependence of the FM behaviour on sGB. The samples are FM only for a certain threshold value sth. For the Fe-doped ZnO sth = 5 × 10⁴ m2/m3. For pure ZnO sth = 5.3 × 10⁷ m2/m3 [6], for Mn-doped ZnO sth = 2.4 × 10⁵ m2/m3 [6], and for Co-doped ZnO sth = 1.5 × 10⁶ m2/m3 [18]. This means that the addition of “magnetic” TM atoms to the pure ZnO did indeed drastically improve the FM properties of pure ZnO, as originally supposed in [1]. Moreover, Fe improved the FM properties of pure zinc oxide more effectively than Co and Mn. For the transition from paramagnetic to FM behaviour in the Fe-doped ZnO one needs many times fewer GBs than in the Co- and Mn-doped ZnO. The reason for the sth difference for the pure ZnO and ZnO doped by Fe, Mn and Co could be also the strong segregation of Fe, Mn and Co in ZnO GBs. According to the estimations made in [4,5], the GB concentration of Mn or Co in the ferromagnetic nanograined samples can be several times higher than in the bulk. Our samples (large filled circle in the right part of the Figure 4) have very fine grains (10–30 nm). The grains are almost the smallest among the Fe-doped ZnO samples reported in the literature [22-66]. This means that the minimum in the concentration dependence Js(cFe) (Figure 3) or the minima in the equivalent dependences Js(cCo) [18] and Js(cMn) [17] for Co- and Mn-doped ZnO cannot be attributed to the fact that the sGB value is larger than sth. On the other hand, it follows from Figure 3 that the sth value could be different for different Fe concentrations. In other words, sth = sth(cFe) is generally concentration-dependent. For example for pure ZnO sth = 5.3 × 10⁷ m2/m3. This means that the value sth = 5 × 10⁴ m2/m3 (Figure 4) should be considered actually as the minimum possible one for the iron-doped ZnO.
In Figure 4 only the synthesis temperature and specific area of GBs are taken into account. However, the saturation magnetization Js of the doped ZnO depends on the dopant concentration in a nontrivial manner (see for example [17]). In the case of Co-doped ZnO we also observed a strong increase of Js for small amounts of Co added to pure ZnO [18]. The saturation magnetization decreased again above 5 atom % Fe. The presence of only one maximum in Co-doped ZnO [18] in comparison with Mn-doped ZnO [17] can be explained by the fact that the valence of Mn-ions changes from +2 to +3 and +4 with increasing Mn content and in the Co-doped ZnO Co always remains trivalent. Fe in ZnO can also change the valence from +2 to +3 [42,47,64,65]. Indeed, we observe a similar strong increase of Js for small amounts of Fe added to pure ZnO (Figure 3). Js increases more than ten times by the increase of Fe content from 0 to 0.1 atom %. The magnetization drops down at further increase in Fe concentration and becomes almost indistinguishable from the background at around 20 atom % Fe. The magnetization increases again above 20 atom % Fe and reaches a value above 0.09 emu/g (0.022 μB/f.u.ZnO) at 40 atom % Fe. However, we do not observe a second drop of Js with increasing Fe content (as took place in Mn-doped ZnO). This means that the concentration dependence of Js in Fe-doped ZnO (Fe can be either di- or trivalent) is indeed, as we supposed in the Introduction, in a certain sense intermediate between the dependences for Co- (always trivalent) and Mn-doped ZnO (the valence of Mn-ions changes from +2 to +3 and +4 with increasing Mn content).
A strong increase of Js by the addition of the first portions of “magnetic” TM atoms to the pure ZnO appears to be a general phenomenon, as reported in [17,18] and this work. At least, we observed it in all three cases of Mn-, Co- and Fe-doping. This means that the arguments of seminal work [1] are quite reasonable. However, the important difference is that Dietl et al. [1] predicted the transition to TM behaviour in bulk ZnO and, as we can see from the Figure 4 and respective plots in [6] and [18], the bulk ZnO (single crystals or coarse-grained polycrystals) remains non-FM even after the strong doping. The presence of grain boundaries is critically important for the FM behaviour of the zinc oxide. Moreover, it is specifically the grain boundaries and not the free surfaces that are crucial for FM behaviour. For example, it has been observed that the nonsintered ZnO nanoparticles doped with 16 atom % Co obtained by forced hydrolysis were not ferromagnetic [67]. This was despite the fact that their grain size of 40 nm was well below the threshold value of 1 μm for the Co-doped ZnO [18]. However, the same powder becomes FM after annealing at 400 °C. The TEM investigations revealed that the annealing leads to the partial sintering of nanoparticles [67]. In other words, the annealing formed the grain boundaries and they, in turn, caused the ferromagnetism.
In [4,5] we compared the adsorption of Co and Mn in GBs and at free surfaces of zinc oxide. It has been observed that the presence of GBs and free surfaces drastically increases the total solubility of Co and Mn in ZnO. For example, the second bulk phase (Co2O3 or Mn3O4) appears at 550 °C in single-crystalline or coarse-grained ZnO if the concentration of Co exceeds 2 atom % [4] and that of Mn exceeds 12 atom % [5]. In fine-grained poreless ZnO films (D < 20 nm) the total solubility of Co at 550 °C exceeds 33 atom % [4] and that of Mn exceeds 30 atom % [5]. In the fine-grained (D < 20 nm) powders only free surfaces and almost no GBs are present. The solubility of Co and Mn in such powders also increases but to a much lower extent (up to about 8 atom % Co and 20 atom % Mn) [4,5]. Similar investigations of the grain size influence on the total solubility of Fe-doped ZnO are now in progress; they give comparable results and will be published elsewhere. Simple calculations performed in [4,5] showed that the drastic increase of the total solubility of Co and Mn with decreasing grain size is due to the multilayer adsorption of dopants in GBs (up to 10 monolayers) and free surfaces (2–4 monolayers). From this point of view, the doped ZnO differs a lot from the metallic alloys where such a multilayer adsorption was not observed and the grain-size effect on the total solubility is much weaker [68-70]. Moreover, it has been observed in the Cu–Bi alloys that the Bi segregation in free surfaces is much stronger than that in GBs [70]. Therefore, it seems that the internal porosity in pure and doped ZnO cannot bring a significant input into FM behaviour.
The drop of Js at a few percent of Co, Mn or Fe also seems to be a general feature of ZnO doped by the “magnetic” TM atoms. We supposed in our first paper on Mn-doped ZnO that the first minimum in the Js(cMn) dependence is caused by the valence change from Mn2+ to Mn3+ and further to Mn4+ [17]. However, later we observed that Js in Co-doped ZnO also drops down between 10 and 15 atom % Co after it reached a maximum at 1.2 atom % Co [18]. This happens despite of the fact that the valence of Co ions in ZnO is constant at Co2+. This means that the reason for the “first decrease” of Js at a few per cent of “magnetic” TM atoms is not the valence change with increasing cTM. Most probably, the change of valence is responsible for the Js(cTM) behaviour at higher concentrations of TM atoms (above 10 atom % TM). As we can see, Mn has three different valence states (Mn2+, Mn3+ and Mn4+) and the respective Js(cMn) curve has three minima and two maxima [17]. Fe has two different valence states (Fe2+ and Fe3+) and the respective Js(cFe) curve has two minima and two maxima (Figure 4 in this work). The curve Js(cCo) for Co has only one maximum and two minima [18]. Therefore, we suppose that the “first minimum” between 1 atom % and 5–6 atom % of TM can be explained by the redistribution of doping atoms in the network of grain boundaries in TM-doped ZnO.
The nonmonotonic dependence of Js on the Fe concentration has been observed in this work (Figure 3). A strong increase of Js with the addition of small proportions of Fe atoms has been observed also in thin films with nanograined columnar structure deposited by magnetron sputtering (Figure 5, filled triangles) [38-40,63] and in samples synthesized by the conventional solid-state reaction having rather large (>10 μm) equiaxial grains [59]. If the ZnO films are deposited by magnetron sputtering, their Js decreases above 5–8 atom % Fe with increasing iron content [39,63]. The ZnO samples obtained by mechanical alloying behave in a different way [64]. They demonstrate a very weak dependence of Js on Fe content (see Figure 5, open circles).
![[2190-4286-4-42-5]](/bjnano/content/figures/2190-4286-4-42-5.png?scale=1.6&max-width=1024&background=FFFFFF)
Figure 5: Dependence of the saturation magnetization (magnetic moment per iron atom in units of Bohr magnetons) on the Fe concentration in ZnO obtained by other methods such as magnetron sputtering (filled right- [38], up- [39], down- [40] and left-triangles [63]), solid-state reaction (filled squares [58]) and mechanical alloying (open circles [64]).
Figure 5: Dependence of the saturation magnetization (magnetic moment per iron atom in units of Bohr magneton...
The plot in Figure 4 and respective plots in [6,18] demonstrate that the presence of a certain amount of GBs is needed to transform non-FM zinc oxide into a FM state. The comparison between Figure 3 and Figure 5 shows that not only the specific area of GBs but also their character distribution (i.e., the spectrum of GB misorientations and inclinations) influences the Js value. We observed previously that the texture or the amount of intergranular amorphous phase in the nanograined pure ZnO films drastically influences the FM properties even at the same grain size [68-70]. The GB structure also changes with increasing dopant content [71]. Moreover, by varying the synthesis conditions one can tailor the thickness of the amorphous intergranular layer and, thus, increase or decrease the Js value [70]. It is well known that GBs with different character possess different adsorption ability [72,73]. If the GB networks have different topology, the GBs having various adsorption ability will be connected with each other in a different way. For example, the ZnO samples synthesized by the liquid ceramics method possess the uniform, equiaxial grains without visible pores inside [6,17,18,72-74]. The films deposited by the magnetron sputtering are also poreless and have columnar grains aligned perpendicular to the substrate [31,33,38-40,63]. Such samples, as well as sintered powders with equiaxial grains [58], have at low cFe the most similar Js(cTM) dependences (Figure 5) to our samples (Figure 3). The same is true also for the Mn- and Co-doped ZnO films [17,18]. If the contiguity of the GB network becomes weaker, as for example, in the samples composed of equiaxed nanograined balls, which in turn are loosely packed with each other (see Refs 25–29 in [17]), the first maximum in the Js(cTM) dependence becomes lower in comparison with the second one [17]. By further decrease of contiguity, such as in poreless samples with flattened grains (see Refs 24, 26, 28, and 92 in [18]), the Js(cTM) dependences becomes “stretched” along the cTM axis, and the first maximum becomes shifted from 1 to about 10 atom % Co [18]. The continuous increase of Js with increasing Co content in samples obtained by autocombustion or partly sintered nanorods (Refs 94 and 101 in [18]) can be considered as further “stretching” of the generic dependence shown in Figure 3. In other words, if the contiguity of the GB network (of “FM foam”) becomes low, the “first maximum” is not reached even at cTM = 20–25 atom % [18]. In the samples obtained by mechanical alloying the Js(cFe) dependence is very weak [64].
Thus, if we compare the Js(cTM) dependences for the Co-, Mn- and Fe-doped ZnO films having a dense, poreless structure with equiaxial grains, on the one hand, with samples having lower contiguity of the GB network (porosity, flattened grains, etc.) on the other hand, we can suppose that there is a kind of “generic” Js(cTM) dependence. This can be observed in the poreless, dense samples with equiaxial grains. This “generic” Js(cTM) dependence becomes “stretched” in the cTM direction if the contiguity of the GB network decreases. As a result, the first Js maximum moves from 1 atom % to 5–10 atom % and then disappears above 20–25 atom %. As a result, in the samples with low contiguity of the GB network only a weak increase of Js with increasing cTM remains.
Conclusion
The influence of the specific area of grain boundaries sGB on the presence or absence of ferromagnetism in Fe-doped ZnO has been analysed based on a review of numerous research contributions from the literature on the origin of the ferromagnetic behaviour of Fe-doped ZnO. An empirical correlation has been found that the value of the specific grain boundary area sGB is the controlling factor for such behaviour. The Fe-doped ZnO becomes ferromagnetic only if it contains enough GBs, i.e., if sGB is higher than a certain threshold value sth = 5 × 10⁴ m2/m3. It corresponds to the effective grain size of about 40 μm, assuming a full, dense material and equiaxial grains. The value of sth = 5 × 10⁴ m2/m3 is lower than that for pure ZnO sth = 5.3 × 10⁷ m2/m3, that for Mn-doped ZnO sth = 2.4 × 10⁵ m2/m3 and that for Co-doped ZnO sth = 1.5 × 10⁶ m2/m3. This means that the addition of “magnetic” TM atoms to the pure ZnO did indeed drastically improve the FM properties of pure ZnO. Moreover, Fe improved the FM properties of pure zinc oxide more effectively than Co and Mn. We experimentally investigated the magnetic properties of Fe-doped ZnO thin films. The Fe concentration varies from 0 to 40 atom %. The thin films were deposited by using the wet-chemistry “liquid ceramics” method onto a sapphire substrate. The dense nanograined samples demonstrate ferromagnetic behaviour with Js up to 0.10 emu/g (0.025 μB/f.u.ZnO) and coercivity Hc ≈ 0.03 T. Saturation magnetisation depends nonmonotonically on the Fe concentration. It increases more than tenfold by the increase of Fe content from 0 to 0.1 atom %. The magnetization drops down at a further increase in Fe concentration and becomes almost indistinguishable from the background at around 20 atom % Fe. Above 20 atom % Fe the magnetization increases again and reaches a value of about 0.09 emu/g (0.022 μB/f.u.ZnO) at 40 atom % Fe. In other published papers similar nonmonotonous dependences were observed in nanostructured films with elongated grains deposited by magnetron sputtering. These differences can be explained by the changes in the structure and contiguity of a ferromagnetic “grain boundary foam” responsible for the magnetic properties of pure and doped ZnO.
References
-
Dietl, T.; Ohno, H.; Matsukura, F.; Cibert, J.; Ferrand, D. Science 2000, 287, 1019–1022. doi:10.1126/science.287.5455.1019
Return to citation in text: [1] [2] [3] [4] [5] -
Sato, K.; Katayama-Yoshida, H. Semicond. Sci. Technol. 2002, 17, 367. doi:10.1088/0268-1242/17/4/309
Return to citation in text: [1] [2] -
Dietl, T. Nat. Mater. 2010, 9, 965–974. doi:10.1038/NMAT2898
Return to citation in text: [1] [2] -
Straumal, B. B.; Mazilkin, A. A.; Protasova, S. G.; Myatiev, A. A.; Straumal, P. B.; Baretzky, B. Acta Mater. 2008, 56, 6246–6256. doi:10.1016/j.actamat.2008.08.032
Return to citation in text: [1] [2] [3] [4] [5] [6] [7] -
Straumal, B.; Baretzky, B.; Mazilkin, A.; Protasova, S.; Myatiev, A.; Straumal, P. J. Eur. Ceram. Soc. 2009, 29, 1963–1970. doi:10.1016/j.jeurceramsoc.2009.01.005
Return to citation in text: [1] [2] [3] [4] [5] [6] [7] -
Straumal, B. B.; Mazilkin, A. A.; Protasova, S. G.; Myatiev, A. A.; Straumal, P. B.; Schütz, G.; van Aken, P. A.; Goering, E.; Baretzky, B. Phys. Rev. B 2009, 79, 205206. doi:10.1103/PhysRevB.79.205206
Return to citation in text: [1] [2] [3] [4] [5] [6] [7] [8] [9] [10] -
Karmakar, R.; Neogi, S. K.; Banerjee, A.; Bandyopadhyay, S. Appl. Surf. Sci. 2012, 263, 671–677. doi:10.1016/j.apsusc.2012.09.133
Return to citation in text: [1] -
Hsu, C. Y. Appl. Phys. Lett. 2012, 101, 062416. doi:10.1063/1.4745845
Return to citation in text: [1] -
Mohanty, P.; Mishra, N. C.; Choudhary, R. J.; Banerjee, A.; Shripathi, T.; Lalla, N. P.; Annapoorni, S.; Rath, C. J. Phys. D 2012, 45, 325301. doi:10.1088/0022-3727/45/32/325301
Return to citation in text: [1] -
Zou, W. Q.; Ge, C. N.; Venkataiah, G.; Su, H. L.; Hsu, H. S.; Huang, J. C. A.; Liu, X. C.; Zhang, F. M.; Du, Y. W. J. Appl. Phys. 2012, 111, 113704. doi:10.1063/1.4720381
Return to citation in text: [1] -
Burova, L. I.; Perov, N. S.; Semisalova, A. S.; Kulbachinskii, V. A.; Kytin, V. G.; Roddatis, V. V.; Vasiliev, A. L.; Kaul, A. R. Thin Solid Films 2012, 520, 4580–4585. doi:10.1016/j.tsf.2011.10.198
Return to citation in text: [1] -
Chakrabarty, A.; Patterson, C. H. Phys. Rev. B 2011, 84, 054441. doi:10.1103/PhysRevB.84.054441
Return to citation in text: [1] -
Liu, W.; Li, W.; Hu, Z.; Tang, Z.; Tang, X. J. Appl. Phys. 2011, 110, 013901. doi:10.1063/1.3601107
Return to citation in text: [1] -
Potzger, K.; Osten, J.; Levin, A. A.; Shalimov, A.; Talut, G.; Reuther, H.; Arpaci, S.; Bürger, D.; Schmidt, H.; Nestler, T.; Meyer, D. C. J. Magn. Magn. Mater. 2011, 323, 1551–1562. doi:10.1016/j.jmmm.2011.01.018
Return to citation in text: [1] -
Lin, M. N.; Hsu, H. S.; Lai, J. Y.; Guo, M. C.; Lin, C. Y.; Li, G. Y.; Chen, F. Y.; Huang, J. J.; Chen, S. F.; Liu, C. P.; Huang, J. C. A. Appl. Phys. Lett. 2011, 98, 212509. doi:10.1063/1.3593384
Return to citation in text: [1] -
Zippel, J.; Lorenz, M.; Setzer, A.; Wagner, G.; Sobolev, N.; Esquinazi, P.; Grundmann, M. Phys. Rev. B 2010, 82, 125209. doi:10.1103/PhysRevB.82.125209
Return to citation in text: [1] -
Straumal, B. B.; Protasova, S. G.; Mazilkin, A. A.; Myatiev, A. A.; Straumal, P. B.; Schütz, G.; Goering, E.; Baretzky, B. J. Appl. Phys. 2010, 108, 073923. doi:10.1063/1.3486044
Return to citation in text: [1] [2] [3] [4] [5] [6] [7] [8] [9] [10] [11] [12] [13] [14] [15] -
Straumal, B. B.; Mazilkin, A. A.; Protasova, S. G.; Straumal, P. B.; Myatiev, A. A.; Schütz, G.; Goering, E.; Tietze, T.; Baretzky, B. Philos. Mag. 2013, 93, 1371–1383. doi:10.1080/14786435.2012.736693
Return to citation in text: [1] [2] [3] [4] [5] [6] [7] [8] [9] [10] [11] [12] [13] [14] [15] [16] [17] [18] [19] [20] [21] -
Straumal, B.; Mazilkin, A.; Straumal, P.; Myatiev, A. Int. J. Nanomanuf. 2008, 2, 253–270. doi:10.1504/IJNM.2008.018948
Return to citation in text: [1] -
Belghazi, Y.; Schmerber, G.; Colis, S.; Rehspringer, J. L.; Dinia, A.; Berrada, A. Appl. Phys. Lett. 2006, 89, 122504. doi:10.1063/1.2355462
Return to citation in text: [1] -
Lábár, J. L. Microsc. Microanal. 2008, 14, 287–295. doi:10.1017/S1431927608080380
Return to citation in text: [1] -
Shinagawa, T.; Izaki, M.; Inui, H.; Murase, K.; Awakura, Y. Phys. Status Solidi A 2006, 203, 2760–2764. doi:10.1002/pssa.200669600
Return to citation in text: [1] [2] [3] [4] [5] [6] -
Dorneles, L. S.; O’Mahony, D.; Fitzgerald, C. B.; McGee, F.; Venkatesan, M.; Stanca, I.; Lunney, J. G.; Coey, J. M. D. Appl. Surf. Sci. 2005, 248, 406–410. doi:10.1016/j.apsusc.2005.03.044
Return to citation in text: [1] [2] [3] [4] [5] [6] -
Liu, H.; Yang, J.; Zhang, Y.; Wang, Y.; Wei, M. Mater. Chem. Phys. 2008, 112, 1021–1023. doi:10.1016/j.matchemphys.2008.07.004
Return to citation in text: [1] [2] [3] [4] [5] [6] -
Feng, Q. J.; Shen, D. Z.; Zhang, J. Y.; Li, B. H.; Zhang, Z. Z.; Lu, Y. M.; Fan, X. W. Mater. Chem. Phys. 2008, 112, 1106–1109. doi:10.1016/j.matchemphys.2008.07.037
Return to citation in text: [1] [2] [3] [4] [5] [6] -
Tamura, T.; Ozaki, H. J. Phys.: Condens. Matter 2009, 21, 026009. doi:10.1088/0953-8984/21/2/026009
Return to citation in text: [1] [2] [3] [4] [5] [6] -
Zhang, B.; Li, Q. H.; Shi, L. Q.; Cheng, H. S.; Wang, J. Z. J. Vac. Sci. Technol., A 2008, 26, 1469–1473. doi:10.1116/1.2990855
Return to citation in text: [1] [2] [3] [4] [5] [6] -
Kumar, R.; Pratap Singh, A.; Thakur, P.; Chae, K. H.; Choi, W. K.; Angadi, B.; Kaushik, S. D.; Patnaik, S. J. Phys. D: Appl. Phys. 2008, 41, 155002. doi:10.1088/0022-3727/41/15/155002
Return to citation in text: [1] [2] [3] [4] [5] [6] -
Wei, Z.-R.; Li, Z.-Q.; Dong, G.-Y. J. Magn. Magn. Mater. 2008, 320, 916–918. doi:10.1016/j.jmmm.2007.09.017
Return to citation in text: [1] [2] [3] [4] [5] [6] [7] -
Wang, Y. Q.; Yuan, S. L.; Liu, L.; Li, P.; Lan, X. X.; Tian, Z. M.; He, J. H.; Yin, S. Y. J. Magn. Magn. Mater. 2008, 320, 1423–1426. doi:10.1016/j.jmmm.2007.10.007
Return to citation in text: [1] [2] [3] [4] [5] [6] -
Seo, S.-Y.; Kwak, C.-H.; Lee, Y.-B.; Kim, S.-H.; Park, S.-H.; Han, S.-W. J. Korean Phys. Soc. 2008, 52, 805–809. doi:10.3938/jkps.52.805
Return to citation in text: [1] [2] [3] [4] [5] [6] [7] -
Kimishima, Y.; Uehara, M.; Irie, K.; Ishihara, S.; Yamaguchi, T.; Saitoh, M.; Kimoto, K.; Matsui, Y. J. Magn. Magn. Mater. 2008, 320, e674–e677. doi:10.1016/j.jmmm.2008.04.025
Return to citation in text: [1] [2] [3] [4] [5] [6] [7] -
Lee, H. Y.; Lee, J.; Na, G.; Nam, S.; Park, I.-H.; Park, J. H. J. Korean Phys. Soc. 2008, 52, 249–252. doi:10.3938/jkps.52.249
Return to citation in text: [1] [2] [3] [4] [5] [6] [7] -
Xin, M.; Chen, Y.; Jia, C.; Zhang, X. Mater. Lett. 2008, 62, 2717–2720. doi:10.1016/j.matlet.2008.01.024
Return to citation in text: [1] [2] [3] [4] [5] [6] -
Jin, Z.; Fukumura, T.; Kawasaki, M.; Ando, K.; Saito, H.; Sekiguchi, T.; Yoo, Y. Z.; Murakami, M.; Matsumoto, Y.; Hasegawa, T.; Koinuma, H. Appl. Phys. Lett. 2001, 78, 3824–3826. doi:10.1063/1.1377856
Return to citation in text: [1] [2] [3] [4] [5] [6] -
Venkatesan, M.; Fitzgerald, C. B.; Lunney, J. G.; Coey, J. M. D. Phys. Rev. Lett. 2004, 93, 177206. doi:10.1103/PhysRevLett.93.177206
Return to citation in text: [1] [2] [3] [4] [5] [6] -
Zhang, H.-W.; Wei, Z.-R.; Li, Z.-Q.; Dong, G.-Y. Mater. Lett. 2007, 61, 3605–3607. doi:10.1016/j.matlet.2006.11.139
Return to citation in text: [1] [2] [3] [4] [5] [6] [7] -
Wei, X. X.; Song, C.; Geng, K. W.; Zeng, F.; He, B.; Pan, F. J. Phys.: Condens. Matter 2006, 18, 7471–7479. doi:10.1088/0953-8984/18/31/037
Return to citation in text: [1] [2] [3] [4] [5] [6] [7] [8] [9] -
Wang, X. C.; Mi, W. B.; Kuang, D. F. Appl. Surf. Sci. 2010, 256, 1930–1935. doi:10.1016/j.apsusc.2009.10.040
Return to citation in text: [1] [2] [3] [4] [5] [6] [7] [8] [9] [10] -
Wang, C.; Chen, Z.; He, Y.; Li, L.; Zhang, D. Appl. Surf. Sci. 2009, 255, 6881–6887. doi:10.1016/j.apsusc.2009.03.008
Return to citation in text: [1] [2] [3] [4] [5] [6] [7] [8] [9] -
Kataoka, T.; Kobayashi, M.; Song, G. S.; Sakamoto, Y.; Fujimori, A.; Chang, F.-H.; Lin, H.-J.; Huang, D. J.; Chen, C. T.; Mandal, S. K.; Nath, T. K.; Karmakar, D.; Dasgupta, I. Jpn. J. Appl. Phys. 2009, 48, 04C200. doi:10.1143/JJAP.48.04C200
Return to citation in text: [1] [2] [3] [4] [5] [6] -
Liu, H.; Yang, J.; Zhang, Y.; Yang, L.; Wei, M.; Ding, X. J. Phys.: Condens. Matter 2009, 21, 145803. doi:10.1088/0953-8984/21/14/145803
Return to citation in text: [1] [2] [3] [4] [5] [6] [7] -
Chen, X.; Zhou, Z.; Wang, K.; Fan, X.; Hu, S.; Wang, Y.; Huang, Y. Mater. Res. Bull. 2009, 44, 799–802. doi:10.1016/j.materresbull.2008.09.014
Return to citation in text: [1] [2] [3] [4] [5] [6] -
Karamat, S.; Ke, C.; Tan, T. L.; Zhou, W.; Lee, P.; Rawat, R. S. Appl. Surf. Sci. 2009, 255, 4814–4820. doi:10.1016/j.apsusc.2008.11.077
Return to citation in text: [1] [2] [3] [4] [5] [6] [7] -
Hong, N. H.; Sakai, J.; Brizé, V. J. Phys.: Condens. Matter 2007, 19, 036219. doi:10.1088/0953-8984/19/3/036219
Return to citation in text: [1] [2] [3] [4] [5] [6] [7] -
Mandal, S. K.; Das, A. K.; Nath, T. K.; Karmakar, D. Appl. Phys. Lett. 2006, 89, 144105. doi:10.1063/1.2360176
Return to citation in text: [1] [2] [3] [4] [5] [6] -
Wu, P.; Saraf, G.; Lu, Y.; Hill, D. H.; Gateau, R.; Wielunski, L.; Bartynski, R. A.; Arena, D. A.; Dvorak, J.; Moodenbaugh, A.; Siegrist, T.; Raley, J. A.; Yeo, Y. K. Appl. Phys. Lett. 2006, 89, 012508. doi:10.1063/1.2213519
Return to citation in text: [1] [2] [3] [4] [5] [6] [7] -
Kolesnik, S.; Dabrowski, B.; Mais, J. J. Appl. Phys. 2004, 95, 2582–2586. doi:10.1063/1.1644638
Return to citation in text: [1] [2] [3] [4] [5] -
Blasco, J.; Bartolomé, F.; García, L. M.; García, J. J. Mater. Chem. 2006, 16, 2282–2288. doi:10.1039/b518418e
Return to citation in text: [1] [2] [3] [4] [5] [6] -
Yoon, S. W.; Cho, S.-B.; We, S. C.; Yoon, S.; Suh, B. J.; Song, H. K.; Shin, Y. J. J. Appl. Phys. 2003, 93, 7879–7881. doi:10.1063/1.1556126
Return to citation in text: [1] [2] [3] [4] [5] [6] -
Hörlin, T.; Svensson, G.; Olsson, E. J. Mater. Chem. 1998, 8, 2465–2473. doi:10.1039/A805291C
Return to citation in text: [1] [2] [3] [4] [5] -
Blasco, J.; Bartolomé, F.; García, L. M.; García, J. J. Magn. Magn. Mater. 2007, 316, e177–e180. doi:10.1016/j.jmmm.2007.02.080
Return to citation in text: [1] [2] [3] [4] [5] [6] -
Alaria, J.; Venkatesan, M.; Coey, J. M. D. J. Appl. Phys. 2008, 103, 07D123. doi:10.1063/1.2833840
Return to citation in text: [1] [2] [3] [4] [5] [6] -
Glaspell, G.; Dutta, P.; Manivannan, A. J. Cluster Sci. 2005, 16, 523–536. doi:10.1007/s10876-005-0024-y
Return to citation in text: [1] [2] [3] [4] [5] -
Ahn, G. Y.; Park, S.-I.; Shim, I.-B.; Kim, C. S. J. Magn. Magn. Mater. 2004, 282, 166–169. doi:10.1016/j.jmmm.2004.04.039
Return to citation in text: [1] [2] [3] [4] [5] -
Mandal, S. K.; Nath, T. K.; Karmakar, D. Philos. Mag. 2008, 88, 265–275. doi:10.1080/14786430701823205
Return to citation in text: [1] [2] [3] [4] [5] [6] -
Uum, Y. R.; Han, B. S.; Lee, H. M.; Hong, S. M.; Kim, G. M.; Rhee, C. K. Phys. Status Solidi C 2007, 4, 4408–4411. doi:10.1002/pssc.200777208
Return to citation in text: [1] [2] [3] [4] [5] -
Han, S.-J.; Song, J. W.; Yang, C.-H.; Park, S. H.; Park, J.-H.; Jeong, Y. H.; Rhie, K. W. Appl. Phys. Lett. 2002, 81, 4212–4214. doi:10.1063/1.1525885
Return to citation in text: [1] [2] [3] [4] [5] [6] [7] -
Mandal, S. K.; Nath, T. K.; Das, A. J. Appl. Phys. 2007, 101, 123920. doi:10.1063/1.2748614
Return to citation in text: [1] [2] [3] [4] [5] [6] [7] -
Presmanes, L.; Capdeville, S.; Bonningue, C.; Datas, L.; Tailhades, P. Thin Solid Films 2007, 515, 6676–6681. doi:10.1016/j.tsf.2007.01.006
Return to citation in text: [1] [2] [3] [4] [5] -
Kumar, S.; Kim, Y. J.; Koo, B. H.; Sharma, S. K.; Vargas, J. M.; Knobel, M.; Gautam, S.; Chae, K. H.; Kim, D. K.; Kim, Y. K.; Lee, C. G. J. Appl. Phys. 2009, 105, 07C520. doi:10.1063/1.3073933
Return to citation in text: [1] [2] [3] [4] [5] -
Sharma, P. K.; Dutta, R. K.; Pandey, A. C.; Layek, S.; Verma, H. C. J. Magn. Magn. Mater. 2009, 321, 2587–2591. doi:10.1016/j.jmmm.2009.03.043
Return to citation in text: [1] [2] [3] [4] [5] -
Zhao, R. B.; Hou, D. L.; Wei, Y. Y.; Zhou, Z. Z.; Pan, C. F.; Zhen, C. M.; Tang, G. D. Mod. Phys. Lett. B 2009, 23, 815–824. doi:10.1142/S0217984909019089
Return to citation in text: [1] [2] [3] [4] [5] [6] [7] [8] -
Lin, Y.; Jiang, D.; Lin, F.; Shi, W.; Ma, X. J. Alloys Compd. 2007, 436, 30–33. doi:10.1016/j.jallcom.2006.07.011
Return to citation in text: [1] [2] [3] [4] [5] [6] [7] [8] [9] -
Karmakar, D.; Mandal, S. K.; Kadam, R. M.; Paulose, P. L.; Rajarajan, A. K.; Nath, T. K.; Das, A. K.; Dasgupta, I.; Das, G. P. Phys. Rev. B 2007, 75, 144404. doi:10.1103/PhysRevB.75.144404
Return to citation in text: [1] [2] [3] [4] [5] [6] [7] -
Srivastava, A. K.; Deepa, M.; Bahadur, N.; Goyat, M. S. Mater. Chem. Phys. 2009, 114, 194–198. doi:10.1016/j.matchemphys.2008.09.005
Return to citation in text: [1] [2] [3] [4] [5] [6] -
Boubekri, R.; Beji, Z.; Elkabous, K.; Herbst, F.; Viau, G.; Ammar, S.; Fiévet, F.; von Bardeleben, H. J.; Mauger, A. Chem. Mater. 2009, 21, 843–855. doi:10.1021/cm802605u
Return to citation in text: [1] [2] -
Straumal, B.; Mazilkin, A.; Protasova, S.; Myatiev, A.; Straumal, P.; Goering, E.; Baretzky, B. Phys. Status Solidi B 2011, 248, 1581–1586. doi:10.1002/pssb.201001182
Return to citation in text: [1] [2] -
Straumal, B. B.; Mazilkin, A. A.; Protasova, S. G.; Myatiev, A. A.; Straumal, P. B.; Goering, E.; Baretzky, B. Thin Solid Films 2011, 520, 1192–1194. doi:10.1016/j.tsf.2011.04.154
Return to citation in text: [1] [2] -
Straumal, B. B.; Protasova, S. G.; Mazilkin, A. A.; Baretzky, B.; Myatiev, A. A.; Straumal, P. B.; Tietze, T.; Schütz, G.; Goering, E. Mater. Lett. 2012, 71, 21–24. doi:10.1016/j.matlet.2011.11.082
Return to citation in text: [1] [2] [3] [4] -
Straumal, B. B.; Myatiev, A. A.; Straumal, P. B.; Mazilkin, A. A.; Protasova, S. G.; Goering, E.; Baretzky, B. JETP Lett. 2010, 92, 396–400. doi:10.1134/S0021364010180074
Return to citation in text: [1] -
Chang, L. S.; Rabkin, E.; Straumal, B. B.; Hofmann, S.; Baretzky, B.; Gust, W. Defect Diffus. Forum 1998, 156, 135–146. doi:10.4028/www.scientific.net/DDF.156.135
Return to citation in text: [1] [2] -
Chang, L.-S.; Rabkin, E.; Hoffmann, S.; Gust, W. Acta Mater. 1999, 47, 2951–2959. doi:10.1016/S1359-6454(99)00168-8
Return to citation in text: [1] [2] -
Straumal, B. B.; Mazilkin, A. A.; Protasova, S. G.; Dobatkin, S. V.; Rodin, A. O.; Baretzky, B.; Goll, D.; Schütz, G. Mater. Sci. Eng., A 2009, 503, 185–189. doi:10.1016/j.msea.2008.03.052
Return to citation in text: [1]
| 22. | Shinagawa, T.; Izaki, M.; Inui, H.; Murase, K.; Awakura, Y. Phys. Status Solidi A 2006, 203, 2760–2764. doi:10.1002/pssa.200669600 |
| 23. | Dorneles, L. S.; O’Mahony, D.; Fitzgerald, C. B.; McGee, F.; Venkatesan, M.; Stanca, I.; Lunney, J. G.; Coey, J. M. D. Appl. Surf. Sci. 2005, 248, 406–410. doi:10.1016/j.apsusc.2005.03.044 |
| 25. | Feng, Q. J.; Shen, D. Z.; Zhang, J. Y.; Li, B. H.; Zhang, Z. Z.; Lu, Y. M.; Fan, X. W. Mater. Chem. Phys. 2008, 112, 1106–1109. doi:10.1016/j.matchemphys.2008.07.037 |
| 27. | Zhang, B.; Li, Q. H.; Shi, L. Q.; Cheng, H. S.; Wang, J. Z. J. Vac. Sci. Technol., A 2008, 26, 1469–1473. doi:10.1116/1.2990855 |
| 28. | Kumar, R.; Pratap Singh, A.; Thakur, P.; Chae, K. H.; Choi, W. K.; Angadi, B.; Kaushik, S. D.; Patnaik, S. J. Phys. D: Appl. Phys. 2008, 41, 155002. doi:10.1088/0022-3727/41/15/155002 |
| 45. | Hong, N. H.; Sakai, J.; Brizé, V. J. Phys.: Condens. Matter 2007, 19, 036219. doi:10.1088/0953-8984/19/3/036219 |
| 29. | Wei, Z.-R.; Li, Z.-Q.; Dong, G.-Y. J. Magn. Magn. Mater. 2008, 320, 916–918. doi:10.1016/j.jmmm.2007.09.017 |
| 32. | Kimishima, Y.; Uehara, M.; Irie, K.; Ishihara, S.; Yamaguchi, T.; Saitoh, M.; Kimoto, K.; Matsui, Y. J. Magn. Magn. Mater. 2008, 320, e674–e677. doi:10.1016/j.jmmm.2008.04.025 |
| 37. | Zhang, H.-W.; Wei, Z.-R.; Li, Z.-Q.; Dong, G.-Y. Mater. Lett. 2007, 61, 3605–3607. doi:10.1016/j.matlet.2006.11.139 |
| 44. | Karamat, S.; Ke, C.; Tan, T. L.; Zhou, W.; Lee, P.; Rawat, R. S. Appl. Surf. Sci. 2009, 255, 4814–4820. doi:10.1016/j.apsusc.2008.11.077 |
| 50. | Yoon, S. W.; Cho, S.-B.; We, S. C.; Yoon, S.; Suh, B. J.; Song, H. K.; Shin, Y. J. J. Appl. Phys. 2003, 93, 7879–7881. doi:10.1063/1.1556126 |
| 52. | Blasco, J.; Bartolomé, F.; García, L. M.; García, J. J. Magn. Magn. Mater. 2007, 316, e177–e180. doi:10.1016/j.jmmm.2007.02.080 |
| 53. | Alaria, J.; Venkatesan, M.; Coey, J. M. D. J. Appl. Phys. 2008, 103, 07D123. doi:10.1063/1.2833840 |
| 56. | Mandal, S. K.; Nath, T. K.; Karmakar, D. Philos. Mag. 2008, 88, 265–275. doi:10.1080/14786430701823205 |
| 59. | Mandal, S. K.; Nath, T. K.; Das, A. J. Appl. Phys. 2007, 101, 123920. doi:10.1063/1.2748614 |
| 62. | Sharma, P. K.; Dutta, R. K.; Pandey, A. C.; Layek, S.; Verma, H. C. J. Magn. Magn. Mater. 2009, 321, 2587–2591. doi:10.1016/j.jmmm.2009.03.043 |
| 65. | Karmakar, D.; Mandal, S. K.; Kadam, R. M.; Paulose, P. L.; Rajarajan, A. K.; Nath, T. K.; Das, A. K.; Dasgupta, I.; Das, G. P. Phys. Rev. B 2007, 75, 144404. doi:10.1103/PhysRevB.75.144404 |
| 40. | Wang, C.; Chen, Z.; He, Y.; Li, L.; Zhang, D. Appl. Surf. Sci. 2009, 255, 6881–6887. doi:10.1016/j.apsusc.2009.03.008 |
| 34. | Xin, M.; Chen, Y.; Jia, C.; Zhang, X. Mater. Lett. 2008, 62, 2717–2720. doi:10.1016/j.matlet.2008.01.024 |
| 43. | Chen, X.; Zhou, Z.; Wang, K.; Fan, X.; Hu, S.; Wang, Y.; Huang, Y. Mater. Res. Bull. 2009, 44, 799–802. doi:10.1016/j.materresbull.2008.09.014 |
| 57. | Uum, Y. R.; Han, B. S.; Lee, H. M.; Hong, S. M.; Kim, G. M.; Rhee, C. K. Phys. Status Solidi C 2007, 4, 4408–4411. doi:10.1002/pssc.200777208 |
| 61. | Kumar, S.; Kim, Y. J.; Koo, B. H.; Sharma, S. K.; Vargas, J. M.; Knobel, M.; Gautam, S.; Chae, K. H.; Kim, D. K.; Kim, Y. K.; Lee, C. G. J. Appl. Phys. 2009, 105, 07C520. doi:10.1063/1.3073933 |
| 63. | Zhao, R. B.; Hou, D. L.; Wei, Y. Y.; Zhou, Z. Z.; Pan, C. F.; Zhen, C. M.; Tang, G. D. Mod. Phys. Lett. B 2009, 23, 815–824. doi:10.1142/S0217984909019089 |
| 38. | Wei, X. X.; Song, C.; Geng, K. W.; Zeng, F.; He, B.; Pan, F. J. Phys.: Condens. Matter 2006, 18, 7471–7479. doi:10.1088/0953-8984/18/31/037 |
| 39. | Wang, X. C.; Mi, W. B.; Kuang, D. F. Appl. Surf. Sci. 2010, 256, 1930–1935. doi:10.1016/j.apsusc.2009.10.040 |
| 64. | Lin, Y.; Jiang, D.; Lin, F.; Shi, W.; Ma, X. J. Alloys Compd. 2007, 436, 30–33. doi:10.1016/j.jallcom.2006.07.011 |
| 4. | Straumal, B. B.; Mazilkin, A. A.; Protasova, S. G.; Myatiev, A. A.; Straumal, P. B.; Baretzky, B. Acta Mater. 2008, 56, 6246–6256. doi:10.1016/j.actamat.2008.08.032 |
| 5. | Straumal, B.; Baretzky, B.; Mazilkin, A.; Protasova, S.; Myatiev, A.; Straumal, P. J. Eur. Ceram. Soc. 2009, 29, 1963–1970. doi:10.1016/j.jeurceramsoc.2009.01.005 |
| 22. | Shinagawa, T.; Izaki, M.; Inui, H.; Murase, K.; Awakura, Y. Phys. Status Solidi A 2006, 203, 2760–2764. doi:10.1002/pssa.200669600 |
| 23. | Dorneles, L. S.; O’Mahony, D.; Fitzgerald, C. B.; McGee, F.; Venkatesan, M.; Stanca, I.; Lunney, J. G.; Coey, J. M. D. Appl. Surf. Sci. 2005, 248, 406–410. doi:10.1016/j.apsusc.2005.03.044 |
| 24. | Liu, H.; Yang, J.; Zhang, Y.; Wang, Y.; Wei, M. Mater. Chem. Phys. 2008, 112, 1021–1023. doi:10.1016/j.matchemphys.2008.07.004 |
| 25. | Feng, Q. J.; Shen, D. Z.; Zhang, J. Y.; Li, B. H.; Zhang, Z. Z.; Lu, Y. M.; Fan, X. W. Mater. Chem. Phys. 2008, 112, 1106–1109. doi:10.1016/j.matchemphys.2008.07.037 |
| 26. | Tamura, T.; Ozaki, H. J. Phys.: Condens. Matter 2009, 21, 026009. doi:10.1088/0953-8984/21/2/026009 |
| 27. | Zhang, B.; Li, Q. H.; Shi, L. Q.; Cheng, H. S.; Wang, J. Z. J. Vac. Sci. Technol., A 2008, 26, 1469–1473. doi:10.1116/1.2990855 |
| 28. | Kumar, R.; Pratap Singh, A.; Thakur, P.; Chae, K. H.; Choi, W. K.; Angadi, B.; Kaushik, S. D.; Patnaik, S. J. Phys. D: Appl. Phys. 2008, 41, 155002. doi:10.1088/0022-3727/41/15/155002 |
| 29. | Wei, Z.-R.; Li, Z.-Q.; Dong, G.-Y. J. Magn. Magn. Mater. 2008, 320, 916–918. doi:10.1016/j.jmmm.2007.09.017 |
| 30. | Wang, Y. Q.; Yuan, S. L.; Liu, L.; Li, P.; Lan, X. X.; Tian, Z. M.; He, J. H.; Yin, S. Y. J. Magn. Magn. Mater. 2008, 320, 1423–1426. doi:10.1016/j.jmmm.2007.10.007 |
| 31. | Seo, S.-Y.; Kwak, C.-H.; Lee, Y.-B.; Kim, S.-H.; Park, S.-H.; Han, S.-W. J. Korean Phys. Soc. 2008, 52, 805–809. doi:10.3938/jkps.52.805 |
| 32. | Kimishima, Y.; Uehara, M.; Irie, K.; Ishihara, S.; Yamaguchi, T.; Saitoh, M.; Kimoto, K.; Matsui, Y. J. Magn. Magn. Mater. 2008, 320, e674–e677. doi:10.1016/j.jmmm.2008.04.025 |
| 33. | Lee, H. Y.; Lee, J.; Na, G.; Nam, S.; Park, I.-H.; Park, J. H. J. Korean Phys. Soc. 2008, 52, 249–252. doi:10.3938/jkps.52.249 |
| 34. | Xin, M.; Chen, Y.; Jia, C.; Zhang, X. Mater. Lett. 2008, 62, 2717–2720. doi:10.1016/j.matlet.2008.01.024 |
| 35. | Jin, Z.; Fukumura, T.; Kawasaki, M.; Ando, K.; Saito, H.; Sekiguchi, T.; Yoo, Y. Z.; Murakami, M.; Matsumoto, Y.; Hasegawa, T.; Koinuma, H. Appl. Phys. Lett. 2001, 78, 3824–3826. doi:10.1063/1.1377856 |
| 36. | Venkatesan, M.; Fitzgerald, C. B.; Lunney, J. G.; Coey, J. M. D. Phys. Rev. Lett. 2004, 93, 177206. doi:10.1103/PhysRevLett.93.177206 |
| 37. | Zhang, H.-W.; Wei, Z.-R.; Li, Z.-Q.; Dong, G.-Y. Mater. Lett. 2007, 61, 3605–3607. doi:10.1016/j.matlet.2006.11.139 |
| 38. | Wei, X. X.; Song, C.; Geng, K. W.; Zeng, F.; He, B.; Pan, F. J. Phys.: Condens. Matter 2006, 18, 7471–7479. doi:10.1088/0953-8984/18/31/037 |
| 39. | Wang, X. C.; Mi, W. B.; Kuang, D. F. Appl. Surf. Sci. 2010, 256, 1930–1935. doi:10.1016/j.apsusc.2009.10.040 |
| 40. | Wang, C.; Chen, Z.; He, Y.; Li, L.; Zhang, D. Appl. Surf. Sci. 2009, 255, 6881–6887. doi:10.1016/j.apsusc.2009.03.008 |
| 41. | Kataoka, T.; Kobayashi, M.; Song, G. S.; Sakamoto, Y.; Fujimori, A.; Chang, F.-H.; Lin, H.-J.; Huang, D. J.; Chen, C. T.; Mandal, S. K.; Nath, T. K.; Karmakar, D.; Dasgupta, I. Jpn. J. Appl. Phys. 2009, 48, 04C200. doi:10.1143/JJAP.48.04C200 |
| 42. | Liu, H.; Yang, J.; Zhang, Y.; Yang, L.; Wei, M.; Ding, X. J. Phys.: Condens. Matter 2009, 21, 145803. doi:10.1088/0953-8984/21/14/145803 |
| 43. | Chen, X.; Zhou, Z.; Wang, K.; Fan, X.; Hu, S.; Wang, Y.; Huang, Y. Mater. Res. Bull. 2009, 44, 799–802. doi:10.1016/j.materresbull.2008.09.014 |
| 44. | Karamat, S.; Ke, C.; Tan, T. L.; Zhou, W.; Lee, P.; Rawat, R. S. Appl. Surf. Sci. 2009, 255, 4814–4820. doi:10.1016/j.apsusc.2008.11.077 |
| 45. | Hong, N. H.; Sakai, J.; Brizé, V. J. Phys.: Condens. Matter 2007, 19, 036219. doi:10.1088/0953-8984/19/3/036219 |
| 46. | Mandal, S. K.; Das, A. K.; Nath, T. K.; Karmakar, D. Appl. Phys. Lett. 2006, 89, 144105. doi:10.1063/1.2360176 |
| 47. | Wu, P.; Saraf, G.; Lu, Y.; Hill, D. H.; Gateau, R.; Wielunski, L.; Bartynski, R. A.; Arena, D. A.; Dvorak, J.; Moodenbaugh, A.; Siegrist, T.; Raley, J. A.; Yeo, Y. K. Appl. Phys. Lett. 2006, 89, 012508. doi:10.1063/1.2213519 |
| 48. | Kolesnik, S.; Dabrowski, B.; Mais, J. J. Appl. Phys. 2004, 95, 2582–2586. doi:10.1063/1.1644638 |
| 49. | Blasco, J.; Bartolomé, F.; García, L. M.; García, J. J. Mater. Chem. 2006, 16, 2282–2288. doi:10.1039/b518418e |
| 50. | Yoon, S. W.; Cho, S.-B.; We, S. C.; Yoon, S.; Suh, B. J.; Song, H. K.; Shin, Y. J. J. Appl. Phys. 2003, 93, 7879–7881. doi:10.1063/1.1556126 |
| 51. | Hörlin, T.; Svensson, G.; Olsson, E. J. Mater. Chem. 1998, 8, 2465–2473. doi:10.1039/A805291C |
| 52. | Blasco, J.; Bartolomé, F.; García, L. M.; García, J. J. Magn. Magn. Mater. 2007, 316, e177–e180. doi:10.1016/j.jmmm.2007.02.080 |
| 53. | Alaria, J.; Venkatesan, M.; Coey, J. M. D. J. Appl. Phys. 2008, 103, 07D123. doi:10.1063/1.2833840 |
| 54. | Glaspell, G.; Dutta, P.; Manivannan, A. J. Cluster Sci. 2005, 16, 523–536. doi:10.1007/s10876-005-0024-y |
| 55. | Ahn, G. Y.; Park, S.-I.; Shim, I.-B.; Kim, C. S. J. Magn. Magn. Mater. 2004, 282, 166–169. doi:10.1016/j.jmmm.2004.04.039 |
| 56. | Mandal, S. K.; Nath, T. K.; Karmakar, D. Philos. Mag. 2008, 88, 265–275. doi:10.1080/14786430701823205 |
| 57. | Uum, Y. R.; Han, B. S.; Lee, H. M.; Hong, S. M.; Kim, G. M.; Rhee, C. K. Phys. Status Solidi C 2007, 4, 4408–4411. doi:10.1002/pssc.200777208 |
| 58. | Han, S.-J.; Song, J. W.; Yang, C.-H.; Park, S. H.; Park, J.-H.; Jeong, Y. H.; Rhie, K. W. Appl. Phys. Lett. 2002, 81, 4212–4214. doi:10.1063/1.1525885 |
| 59. | Mandal, S. K.; Nath, T. K.; Das, A. J. Appl. Phys. 2007, 101, 123920. doi:10.1063/1.2748614 |
| 60. | Presmanes, L.; Capdeville, S.; Bonningue, C.; Datas, L.; Tailhades, P. Thin Solid Films 2007, 515, 6676–6681. doi:10.1016/j.tsf.2007.01.006 |
| 61. | Kumar, S.; Kim, Y. J.; Koo, B. H.; Sharma, S. K.; Vargas, J. M.; Knobel, M.; Gautam, S.; Chae, K. H.; Kim, D. K.; Kim, Y. K.; Lee, C. G. J. Appl. Phys. 2009, 105, 07C520. doi:10.1063/1.3073933 |
| 62. | Sharma, P. K.; Dutta, R. K.; Pandey, A. C.; Layek, S.; Verma, H. C. J. Magn. Magn. Mater. 2009, 321, 2587–2591. doi:10.1016/j.jmmm.2009.03.043 |
| 63. | Zhao, R. B.; Hou, D. L.; Wei, Y. Y.; Zhou, Z. Z.; Pan, C. F.; Zhen, C. M.; Tang, G. D. Mod. Phys. Lett. B 2009, 23, 815–824. doi:10.1142/S0217984909019089 |
| 64. | Lin, Y.; Jiang, D.; Lin, F.; Shi, W.; Ma, X. J. Alloys Compd. 2007, 436, 30–33. doi:10.1016/j.jallcom.2006.07.011 |
| 65. | Karmakar, D.; Mandal, S. K.; Kadam, R. M.; Paulose, P. L.; Rajarajan, A. K.; Nath, T. K.; Das, A. K.; Dasgupta, I.; Das, G. P. Phys. Rev. B 2007, 75, 144404. doi:10.1103/PhysRevB.75.144404 |
| 66. | Srivastava, A. K.; Deepa, M.; Bahadur, N.; Goyat, M. S. Mater. Chem. Phys. 2009, 114, 194–198. doi:10.1016/j.matchemphys.2008.09.005 |
| 18. | Straumal, B. B.; Mazilkin, A. A.; Protasova, S. G.; Straumal, P. B.; Myatiev, A. A.; Schütz, G.; Goering, E.; Tietze, T.; Baretzky, B. Philos. Mag. 2013, 93, 1371–1383. doi:10.1080/14786435.2012.736693 |
| 71. | Straumal, B. B.; Myatiev, A. A.; Straumal, P. B.; Mazilkin, A. A.; Protasova, S. G.; Goering, E.; Baretzky, B. JETP Lett. 2010, 92, 396–400. doi:10.1134/S0021364010180074 |
| 1. | Dietl, T.; Ohno, H.; Matsukura, F.; Cibert, J.; Ferrand, D. Science 2000, 287, 1019–1022. doi:10.1126/science.287.5455.1019 |
| 6. | Straumal, B. B.; Mazilkin, A. A.; Protasova, S. G.; Myatiev, A. A.; Straumal, P. B.; Schütz, G.; van Aken, P. A.; Goering, E.; Baretzky, B. Phys. Rev. B 2009, 79, 205206. doi:10.1103/PhysRevB.79.205206 |
| 6. | Straumal, B. B.; Mazilkin, A. A.; Protasova, S. G.; Myatiev, A. A.; Straumal, P. B.; Schütz, G.; van Aken, P. A.; Goering, E.; Baretzky, B. Phys. Rev. B 2009, 79, 205206. doi:10.1103/PhysRevB.79.205206 |
| 18. | Straumal, B. B.; Mazilkin, A. A.; Protasova, S. G.; Straumal, P. B.; Myatiev, A. A.; Schütz, G.; Goering, E.; Tietze, T.; Baretzky, B. Philos. Mag. 2013, 93, 1371–1383. doi:10.1080/14786435.2012.736693 |
| 6. | Straumal, B. B.; Mazilkin, A. A.; Protasova, S. G.; Myatiev, A. A.; Straumal, P. B.; Schütz, G.; van Aken, P. A.; Goering, E.; Baretzky, B. Phys. Rev. B 2009, 79, 205206. doi:10.1103/PhysRevB.79.205206 |
| 68. | Straumal, B.; Mazilkin, A.; Protasova, S.; Myatiev, A.; Straumal, P.; Goering, E.; Baretzky, B. Phys. Status Solidi B 2011, 248, 1581–1586. doi:10.1002/pssb.201001182 |
| 69. | Straumal, B. B.; Mazilkin, A. A.; Protasova, S. G.; Myatiev, A. A.; Straumal, P. B.; Goering, E.; Baretzky, B. Thin Solid Films 2011, 520, 1192–1194. doi:10.1016/j.tsf.2011.04.154 |
| 70. | Straumal, B. B.; Protasova, S. G.; Mazilkin, A. A.; Baretzky, B.; Myatiev, A. A.; Straumal, P. B.; Tietze, T.; Schütz, G.; Goering, E. Mater. Lett. 2012, 71, 21–24. doi:10.1016/j.matlet.2011.11.082 |
| 31. | Seo, S.-Y.; Kwak, C.-H.; Lee, Y.-B.; Kim, S.-H.; Park, S.-H.; Han, S.-W. J. Korean Phys. Soc. 2008, 52, 805–809. doi:10.3938/jkps.52.805 |
| 33. | Lee, H. Y.; Lee, J.; Na, G.; Nam, S.; Park, I.-H.; Park, J. H. J. Korean Phys. Soc. 2008, 52, 249–252. doi:10.3938/jkps.52.249 |
| 38. | Wei, X. X.; Song, C.; Geng, K. W.; Zeng, F.; He, B.; Pan, F. J. Phys.: Condens. Matter 2006, 18, 7471–7479. doi:10.1088/0953-8984/18/31/037 |
| 39. | Wang, X. C.; Mi, W. B.; Kuang, D. F. Appl. Surf. Sci. 2010, 256, 1930–1935. doi:10.1016/j.apsusc.2009.10.040 |
| 40. | Wang, C.; Chen, Z.; He, Y.; Li, L.; Zhang, D. Appl. Surf. Sci. 2009, 255, 6881–6887. doi:10.1016/j.apsusc.2009.03.008 |
| 60. | Presmanes, L.; Capdeville, S.; Bonningue, C.; Datas, L.; Tailhades, P. Thin Solid Films 2007, 515, 6676–6681. doi:10.1016/j.tsf.2007.01.006 |
| 58. | Han, S.-J.; Song, J. W.; Yang, C.-H.; Park, S. H.; Park, J.-H.; Jeong, Y. H.; Rhie, K. W. Appl. Phys. Lett. 2002, 81, 4212–4214. doi:10.1063/1.1525885 |
| 35. | Jin, Z.; Fukumura, T.; Kawasaki, M.; Ando, K.; Saito, H.; Sekiguchi, T.; Yoo, Y. Z.; Murakami, M.; Matsumoto, Y.; Hasegawa, T.; Koinuma, H. Appl. Phys. Lett. 2001, 78, 3824–3826. doi:10.1063/1.1377856 |
| 36. | Venkatesan, M.; Fitzgerald, C. B.; Lunney, J. G.; Coey, J. M. D. Phys. Rev. Lett. 2004, 93, 177206. doi:10.1103/PhysRevLett.93.177206 |
| 45. | Hong, N. H.; Sakai, J.; Brizé, V. J. Phys.: Condens. Matter 2007, 19, 036219. doi:10.1088/0953-8984/19/3/036219 |
| 47. | Wu, P.; Saraf, G.; Lu, Y.; Hill, D. H.; Gateau, R.; Wielunski, L.; Bartynski, R. A.; Arena, D. A.; Dvorak, J.; Moodenbaugh, A.; Siegrist, T.; Raley, J. A.; Yeo, Y. K. Appl. Phys. Lett. 2006, 89, 012508. doi:10.1063/1.2213519 |
| 66. | Srivastava, A. K.; Deepa, M.; Bahadur, N.; Goyat, M. S. Mater. Chem. Phys. 2009, 114, 194–198. doi:10.1016/j.matchemphys.2008.09.005 |
| 64. | Lin, Y.; Jiang, D.; Lin, F.; Shi, W.; Ma, X. J. Alloys Compd. 2007, 436, 30–33. doi:10.1016/j.jallcom.2006.07.011 |
| 18. | Straumal, B. B.; Mazilkin, A. A.; Protasova, S. G.; Straumal, P. B.; Myatiev, A. A.; Schütz, G.; Goering, E.; Tietze, T.; Baretzky, B. Philos. Mag. 2013, 93, 1371–1383. doi:10.1080/14786435.2012.736693 |
| 17. | Straumal, B. B.; Protasova, S. G.; Mazilkin, A. A.; Myatiev, A. A.; Straumal, P. B.; Schütz, G.; Goering, E.; Baretzky, B. J. Appl. Phys. 2010, 108, 073923. doi:10.1063/1.3486044 |
| 58. | Han, S.-J.; Song, J. W.; Yang, C.-H.; Park, S. H.; Park, J.-H.; Jeong, Y. H.; Rhie, K. W. Appl. Phys. Lett. 2002, 81, 4212–4214. doi:10.1063/1.1525885 |
| 17. | Straumal, B. B.; Protasova, S. G.; Mazilkin, A. A.; Myatiev, A. A.; Straumal, P. B.; Schütz, G.; Goering, E.; Baretzky, B. J. Appl. Phys. 2010, 108, 073923. doi:10.1063/1.3486044 |
| 17. | Straumal, B. B.; Protasova, S. G.; Mazilkin, A. A.; Myatiev, A. A.; Straumal, P. B.; Schütz, G.; Goering, E.; Baretzky, B. J. Appl. Phys. 2010, 108, 073923. doi:10.1063/1.3486044 |
| 18. | Straumal, B. B.; Mazilkin, A. A.; Protasova, S. G.; Straumal, P. B.; Myatiev, A. A.; Schütz, G.; Goering, E.; Tietze, T.; Baretzky, B. Philos. Mag. 2013, 93, 1371–1383. doi:10.1080/14786435.2012.736693 |
| 6. | Straumal, B. B.; Mazilkin, A. A.; Protasova, S. G.; Myatiev, A. A.; Straumal, P. B.; Schütz, G.; van Aken, P. A.; Goering, E.; Baretzky, B. Phys. Rev. B 2009, 79, 205206. doi:10.1103/PhysRevB.79.205206 |
| 17. | Straumal, B. B.; Protasova, S. G.; Mazilkin, A. A.; Myatiev, A. A.; Straumal, P. B.; Schütz, G.; Goering, E.; Baretzky, B. J. Appl. Phys. 2010, 108, 073923. doi:10.1063/1.3486044 |
| 18. | Straumal, B. B.; Mazilkin, A. A.; Protasova, S. G.; Straumal, P. B.; Myatiev, A. A.; Schütz, G.; Goering, E.; Tietze, T.; Baretzky, B. Philos. Mag. 2013, 93, 1371–1383. doi:10.1080/14786435.2012.736693 |
| 72. | Chang, L. S.; Rabkin, E.; Straumal, B. B.; Hofmann, S.; Baretzky, B.; Gust, W. Defect Diffus. Forum 1998, 156, 135–146. doi:10.4028/www.scientific.net/DDF.156.135 |
| 73. | Chang, L.-S.; Rabkin, E.; Hoffmann, S.; Gust, W. Acta Mater. 1999, 47, 2951–2959. doi:10.1016/S1359-6454(99)00168-8 |
| 74. | Straumal, B. B.; Mazilkin, A. A.; Protasova, S. G.; Dobatkin, S. V.; Rodin, A. O.; Baretzky, B.; Goll, D.; Schütz, G. Mater. Sci. Eng., A 2009, 503, 185–189. doi:10.1016/j.msea.2008.03.052 |
| 31. | Seo, S.-Y.; Kwak, C.-H.; Lee, Y.-B.; Kim, S.-H.; Park, S.-H.; Han, S.-W. J. Korean Phys. Soc. 2008, 52, 805–809. doi:10.3938/jkps.52.805 |
| 33. | Lee, H. Y.; Lee, J.; Na, G.; Nam, S.; Park, I.-H.; Park, J. H. J. Korean Phys. Soc. 2008, 52, 249–252. doi:10.3938/jkps.52.249 |
| 38. | Wei, X. X.; Song, C.; Geng, K. W.; Zeng, F.; He, B.; Pan, F. J. Phys.: Condens. Matter 2006, 18, 7471–7479. doi:10.1088/0953-8984/18/31/037 |
| 39. | Wang, X. C.; Mi, W. B.; Kuang, D. F. Appl. Surf. Sci. 2010, 256, 1930–1935. doi:10.1016/j.apsusc.2009.10.040 |
| 40. | Wang, C.; Chen, Z.; He, Y.; Li, L.; Zhang, D. Appl. Surf. Sci. 2009, 255, 6881–6887. doi:10.1016/j.apsusc.2009.03.008 |
| 63. | Zhao, R. B.; Hou, D. L.; Wei, Y. Y.; Zhou, Z. Z.; Pan, C. F.; Zhen, C. M.; Tang, G. D. Mod. Phys. Lett. B 2009, 23, 815–824. doi:10.1142/S0217984909019089 |
| 70. | Straumal, B. B.; Protasova, S. G.; Mazilkin, A. A.; Baretzky, B.; Myatiev, A. A.; Straumal, P. B.; Tietze, T.; Schütz, G.; Goering, E. Mater. Lett. 2012, 71, 21–24. doi:10.1016/j.matlet.2011.11.082 |
| 72. | Chang, L. S.; Rabkin, E.; Straumal, B. B.; Hofmann, S.; Baretzky, B.; Gust, W. Defect Diffus. Forum 1998, 156, 135–146. doi:10.4028/www.scientific.net/DDF.156.135 |
| 73. | Chang, L.-S.; Rabkin, E.; Hoffmann, S.; Gust, W. Acta Mater. 1999, 47, 2951–2959. doi:10.1016/S1359-6454(99)00168-8 |
| 1. | Dietl, T.; Ohno, H.; Matsukura, F.; Cibert, J.; Ferrand, D. Science 2000, 287, 1019–1022. doi:10.1126/science.287.5455.1019 |
| 6. | Straumal, B. B.; Mazilkin, A. A.; Protasova, S. G.; Myatiev, A. A.; Straumal, P. B.; Schütz, G.; van Aken, P. A.; Goering, E.; Baretzky, B. Phys. Rev. B 2009, 79, 205206. doi:10.1103/PhysRevB.79.205206 |
| 17. | Straumal, B. B.; Protasova, S. G.; Mazilkin, A. A.; Myatiev, A. A.; Straumal, P. B.; Schütz, G.; Goering, E.; Baretzky, B. J. Appl. Phys. 2010, 108, 073923. doi:10.1063/1.3486044 |
| 18. | Straumal, B. B.; Mazilkin, A. A.; Protasova, S. G.; Straumal, P. B.; Myatiev, A. A.; Schütz, G.; Goering, E.; Tietze, T.; Baretzky, B. Philos. Mag. 2013, 93, 1371–1383. doi:10.1080/14786435.2012.736693 |
| 1. | Dietl, T.; Ohno, H.; Matsukura, F.; Cibert, J.; Ferrand, D. Science 2000, 287, 1019–1022. doi:10.1126/science.287.5455.1019 |
| 17. | Straumal, B. B.; Protasova, S. G.; Mazilkin, A. A.; Myatiev, A. A.; Straumal, P. B.; Schütz, G.; Goering, E.; Baretzky, B. J. Appl. Phys. 2010, 108, 073923. doi:10.1063/1.3486044 |
| 18. | Straumal, B. B.; Mazilkin, A. A.; Protasova, S. G.; Straumal, P. B.; Myatiev, A. A.; Schütz, G.; Goering, E.; Tietze, T.; Baretzky, B. Philos. Mag. 2013, 93, 1371–1383. doi:10.1080/14786435.2012.736693 |
| 42. | Liu, H.; Yang, J.; Zhang, Y.; Yang, L.; Wei, M.; Ding, X. J. Phys.: Condens. Matter 2009, 21, 145803. doi:10.1088/0953-8984/21/14/145803 |
| 47. | Wu, P.; Saraf, G.; Lu, Y.; Hill, D. H.; Gateau, R.; Wielunski, L.; Bartynski, R. A.; Arena, D. A.; Dvorak, J.; Moodenbaugh, A.; Siegrist, T.; Raley, J. A.; Yeo, Y. K. Appl. Phys. Lett. 2006, 89, 012508. doi:10.1063/1.2213519 |
| 64. | Lin, Y.; Jiang, D.; Lin, F.; Shi, W.; Ma, X. J. Alloys Compd. 2007, 436, 30–33. doi:10.1016/j.jallcom.2006.07.011 |
| 65. | Karmakar, D.; Mandal, S. K.; Kadam, R. M.; Paulose, P. L.; Rajarajan, A. K.; Nath, T. K.; Das, A. K.; Dasgupta, I.; Das, G. P. Phys. Rev. B 2007, 75, 144404. doi:10.1103/PhysRevB.75.144404 |
| 18. | Straumal, B. B.; Mazilkin, A. A.; Protasova, S. G.; Straumal, P. B.; Myatiev, A. A.; Schütz, G.; Goering, E.; Tietze, T.; Baretzky, B. Philos. Mag. 2013, 93, 1371–1383. doi:10.1080/14786435.2012.736693 |
| 18. | Straumal, B. B.; Mazilkin, A. A.; Protasova, S. G.; Straumal, P. B.; Myatiev, A. A.; Schütz, G.; Goering, E.; Tietze, T.; Baretzky, B. Philos. Mag. 2013, 93, 1371–1383. doi:10.1080/14786435.2012.736693 |
| 17. | Straumal, B. B.; Protasova, S. G.; Mazilkin, A. A.; Myatiev, A. A.; Straumal, P. B.; Schütz, G.; Goering, E.; Baretzky, B. J. Appl. Phys. 2010, 108, 073923. doi:10.1063/1.3486044 |
| 18. | Straumal, B. B.; Mazilkin, A. A.; Protasova, S. G.; Straumal, P. B.; Myatiev, A. A.; Schütz, G.; Goering, E.; Tietze, T.; Baretzky, B. Philos. Mag. 2013, 93, 1371–1383. doi:10.1080/14786435.2012.736693 |
| 17. | Straumal, B. B.; Protasova, S. G.; Mazilkin, A. A.; Myatiev, A. A.; Straumal, P. B.; Schütz, G.; Goering, E.; Baretzky, B. J. Appl. Phys. 2010, 108, 073923. doi:10.1063/1.3486044 |
| 67. | Boubekri, R.; Beji, Z.; Elkabous, K.; Herbst, F.; Viau, G.; Ammar, S.; Fiévet, F.; von Bardeleben, H. J.; Mauger, A. Chem. Mater. 2009, 21, 843–855. doi:10.1021/cm802605u |
| 18. | Straumal, B. B.; Mazilkin, A. A.; Protasova, S. G.; Straumal, P. B.; Myatiev, A. A.; Schütz, G.; Goering, E.; Tietze, T.; Baretzky, B. Philos. Mag. 2013, 93, 1371–1383. doi:10.1080/14786435.2012.736693 |
| 18. | Straumal, B. B.; Mazilkin, A. A.; Protasova, S. G.; Straumal, P. B.; Myatiev, A. A.; Schütz, G.; Goering, E.; Tietze, T.; Baretzky, B. Philos. Mag. 2013, 93, 1371–1383. doi:10.1080/14786435.2012.736693 |
| 1. | Dietl, T.; Ohno, H.; Matsukura, F.; Cibert, J.; Ferrand, D. Science 2000, 287, 1019–1022. doi:10.1126/science.287.5455.1019 |
| 18. | Straumal, B. B.; Mazilkin, A. A.; Protasova, S. G.; Straumal, P. B.; Myatiev, A. A.; Schütz, G.; Goering, E.; Tietze, T.; Baretzky, B. Philos. Mag. 2013, 93, 1371–1383. doi:10.1080/14786435.2012.736693 |
| 64. | Lin, Y.; Jiang, D.; Lin, F.; Shi, W.; Ma, X. J. Alloys Compd. 2007, 436, 30–33. doi:10.1016/j.jallcom.2006.07.011 |
| 18. | Straumal, B. B.; Mazilkin, A. A.; Protasova, S. G.; Straumal, P. B.; Myatiev, A. A.; Schütz, G.; Goering, E.; Tietze, T.; Baretzky, B. Philos. Mag. 2013, 93, 1371–1383. doi:10.1080/14786435.2012.736693 |
| 6. | Straumal, B. B.; Mazilkin, A. A.; Protasova, S. G.; Myatiev, A. A.; Straumal, P. B.; Schütz, G.; van Aken, P. A.; Goering, E.; Baretzky, B. Phys. Rev. B 2009, 79, 205206. doi:10.1103/PhysRevB.79.205206 |
| 19. | Straumal, B.; Mazilkin, A.; Straumal, P.; Myatiev, A. Int. J. Nanomanuf. 2008, 2, 253–270. doi:10.1504/IJNM.2008.018948 |
| 4. | Straumal, B. B.; Mazilkin, A. A.; Protasova, S. G.; Myatiev, A. A.; Straumal, P. B.; Baretzky, B. Acta Mater. 2008, 56, 6246–6256. doi:10.1016/j.actamat.2008.08.032 |
| 5. | Straumal, B.; Baretzky, B.; Mazilkin, A.; Protasova, S.; Myatiev, A.; Straumal, P. J. Eur. Ceram. Soc. 2009, 29, 1963–1970. doi:10.1016/j.jeurceramsoc.2009.01.005 |
| 2. | Sato, K.; Katayama-Yoshida, H. Semicond. Sci. Technol. 2002, 17, 367. doi:10.1088/0268-1242/17/4/309 |
| 20. | Belghazi, Y.; Schmerber, G.; Colis, S.; Rehspringer, J. L.; Dinia, A.; Berrada, A. Appl. Phys. Lett. 2006, 89, 122504. doi:10.1063/1.2355462 |
| 2. | Sato, K.; Katayama-Yoshida, H. Semicond. Sci. Technol. 2002, 17, 367. doi:10.1088/0268-1242/17/4/309 |
| 3. | Dietl, T. Nat. Mater. 2010, 9, 965–974. doi:10.1038/NMAT2898 |
| 4. | Straumal, B. B.; Mazilkin, A. A.; Protasova, S. G.; Myatiev, A. A.; Straumal, P. B.; Baretzky, B. Acta Mater. 2008, 56, 6246–6256. doi:10.1016/j.actamat.2008.08.032 |
| 5. | Straumal, B.; Baretzky, B.; Mazilkin, A.; Protasova, S.; Myatiev, A.; Straumal, P. J. Eur. Ceram. Soc. 2009, 29, 1963–1970. doi:10.1016/j.jeurceramsoc.2009.01.005 |
| 6. | Straumal, B. B.; Mazilkin, A. A.; Protasova, S. G.; Myatiev, A. A.; Straumal, P. B.; Schütz, G.; van Aken, P. A.; Goering, E.; Baretzky, B. Phys. Rev. B 2009, 79, 205206. doi:10.1103/PhysRevB.79.205206 |
| 17. | Straumal, B. B.; Protasova, S. G.; Mazilkin, A. A.; Myatiev, A. A.; Straumal, P. B.; Schütz, G.; Goering, E.; Baretzky, B. J. Appl. Phys. 2010, 108, 073923. doi:10.1063/1.3486044 |
| 4. | Straumal, B. B.; Mazilkin, A. A.; Protasova, S. G.; Myatiev, A. A.; Straumal, P. B.; Baretzky, B. Acta Mater. 2008, 56, 6246–6256. doi:10.1016/j.actamat.2008.08.032 |
| 1. | Dietl, T.; Ohno, H.; Matsukura, F.; Cibert, J.; Ferrand, D. Science 2000, 287, 1019–1022. doi:10.1126/science.287.5455.1019 |
| 17. | Straumal, B. B.; Protasova, S. G.; Mazilkin, A. A.; Myatiev, A. A.; Straumal, P. B.; Schütz, G.; Goering, E.; Baretzky, B. J. Appl. Phys. 2010, 108, 073923. doi:10.1063/1.3486044 |
| 18. | Straumal, B. B.; Mazilkin, A. A.; Protasova, S. G.; Straumal, P. B.; Myatiev, A. A.; Schütz, G.; Goering, E.; Tietze, T.; Baretzky, B. Philos. Mag. 2013, 93, 1371–1383. doi:10.1080/14786435.2012.736693 |
| 5. | Straumal, B.; Baretzky, B.; Mazilkin, A.; Protasova, S.; Myatiev, A.; Straumal, P. J. Eur. Ceram. Soc. 2009, 29, 1963–1970. doi:10.1016/j.jeurceramsoc.2009.01.005 |
| 17. | Straumal, B. B.; Protasova, S. G.; Mazilkin, A. A.; Myatiev, A. A.; Straumal, P. B.; Schütz, G.; Goering, E.; Baretzky, B. J. Appl. Phys. 2010, 108, 073923. doi:10.1063/1.3486044 |
| 18. | Straumal, B. B.; Mazilkin, A. A.; Protasova, S. G.; Straumal, P. B.; Myatiev, A. A.; Schütz, G.; Goering, E.; Tietze, T.; Baretzky, B. Philos. Mag. 2013, 93, 1371–1383. doi:10.1080/14786435.2012.736693 |
| 17. | Straumal, B. B.; Protasova, S. G.; Mazilkin, A. A.; Myatiev, A. A.; Straumal, P. B.; Schütz, G.; Goering, E.; Baretzky, B. J. Appl. Phys. 2010, 108, 073923. doi:10.1063/1.3486044 |
| 4. | Straumal, B. B.; Mazilkin, A. A.; Protasova, S. G.; Myatiev, A. A.; Straumal, P. B.; Baretzky, B. Acta Mater. 2008, 56, 6246–6256. doi:10.1016/j.actamat.2008.08.032 |
| 6. | Straumal, B. B.; Mazilkin, A. A.; Protasova, S. G.; Myatiev, A. A.; Straumal, P. B.; Schütz, G.; van Aken, P. A.; Goering, E.; Baretzky, B. Phys. Rev. B 2009, 79, 205206. doi:10.1103/PhysRevB.79.205206 |
| 17. | Straumal, B. B.; Protasova, S. G.; Mazilkin, A. A.; Myatiev, A. A.; Straumal, P. B.; Schütz, G.; Goering, E.; Baretzky, B. J. Appl. Phys. 2010, 108, 073923. doi:10.1063/1.3486044 |
| 18. | Straumal, B. B.; Mazilkin, A. A.; Protasova, S. G.; Straumal, P. B.; Myatiev, A. A.; Schütz, G.; Goering, E.; Tietze, T.; Baretzky, B. Philos. Mag. 2013, 93, 1371–1383. doi:10.1080/14786435.2012.736693 |
| 18. | Straumal, B. B.; Mazilkin, A. A.; Protasova, S. G.; Straumal, P. B.; Myatiev, A. A.; Schütz, G.; Goering, E.; Tietze, T.; Baretzky, B. Philos. Mag. 2013, 93, 1371–1383. doi:10.1080/14786435.2012.736693 |
| 5. | Straumal, B.; Baretzky, B.; Mazilkin, A.; Protasova, S.; Myatiev, A.; Straumal, P. J. Eur. Ceram. Soc. 2009, 29, 1963–1970. doi:10.1016/j.jeurceramsoc.2009.01.005 |
| 3. | Dietl, T. Nat. Mater. 2010, 9, 965–974. doi:10.1038/NMAT2898 |
| 7. | Karmakar, R.; Neogi, S. K.; Banerjee, A.; Bandyopadhyay, S. Appl. Surf. Sci. 2012, 263, 671–677. doi:10.1016/j.apsusc.2012.09.133 |
| 8. | Hsu, C. Y. Appl. Phys. Lett. 2012, 101, 062416. doi:10.1063/1.4745845 |
| 9. | Mohanty, P.; Mishra, N. C.; Choudhary, R. J.; Banerjee, A.; Shripathi, T.; Lalla, N. P.; Annapoorni, S.; Rath, C. J. Phys. D 2012, 45, 325301. doi:10.1088/0022-3727/45/32/325301 |
| 10. | Zou, W. Q.; Ge, C. N.; Venkataiah, G.; Su, H. L.; Hsu, H. S.; Huang, J. C. A.; Liu, X. C.; Zhang, F. M.; Du, Y. W. J. Appl. Phys. 2012, 111, 113704. doi:10.1063/1.4720381 |
| 11. | Burova, L. I.; Perov, N. S.; Semisalova, A. S.; Kulbachinskii, V. A.; Kytin, V. G.; Roddatis, V. V.; Vasiliev, A. L.; Kaul, A. R. Thin Solid Films 2012, 520, 4580–4585. doi:10.1016/j.tsf.2011.10.198 |
| 12. | Chakrabarty, A.; Patterson, C. H. Phys. Rev. B 2011, 84, 054441. doi:10.1103/PhysRevB.84.054441 |
| 13. | Liu, W.; Li, W.; Hu, Z.; Tang, Z.; Tang, X. J. Appl. Phys. 2011, 110, 013901. doi:10.1063/1.3601107 |
| 14. | Potzger, K.; Osten, J.; Levin, A. A.; Shalimov, A.; Talut, G.; Reuther, H.; Arpaci, S.; Bürger, D.; Schmidt, H.; Nestler, T.; Meyer, D. C. J. Magn. Magn. Mater. 2011, 323, 1551–1562. doi:10.1016/j.jmmm.2011.01.018 |
| 15. | Lin, M. N.; Hsu, H. S.; Lai, J. Y.; Guo, M. C.; Lin, C. Y.; Li, G. Y.; Chen, F. Y.; Huang, J. J.; Chen, S. F.; Liu, C. P.; Huang, J. C. A. Appl. Phys. Lett. 2011, 98, 212509. doi:10.1063/1.3593384 |
| 16. | Zippel, J.; Lorenz, M.; Setzer, A.; Wagner, G.; Sobolev, N.; Esquinazi, P.; Grundmann, M. Phys. Rev. B 2010, 82, 125209. doi:10.1103/PhysRevB.82.125209 |
| 67. | Boubekri, R.; Beji, Z.; Elkabous, K.; Herbst, F.; Viau, G.; Ammar, S.; Fiévet, F.; von Bardeleben, H. J.; Mauger, A. Chem. Mater. 2009, 21, 843–855. doi:10.1021/cm802605u |
| 6. | Straumal, B. B.; Mazilkin, A. A.; Protasova, S. G.; Myatiev, A. A.; Straumal, P. B.; Schütz, G.; van Aken, P. A.; Goering, E.; Baretzky, B. Phys. Rev. B 2009, 79, 205206. doi:10.1103/PhysRevB.79.205206 |
| 18. | Straumal, B. B.; Mazilkin, A. A.; Protasova, S. G.; Straumal, P. B.; Myatiev, A. A.; Schütz, G.; Goering, E.; Tietze, T.; Baretzky, B. Philos. Mag. 2013, 93, 1371–1383. doi:10.1080/14786435.2012.736693 |
| 4. | Straumal, B. B.; Mazilkin, A. A.; Protasova, S. G.; Myatiev, A. A.; Straumal, P. B.; Baretzky, B. Acta Mater. 2008, 56, 6246–6256. doi:10.1016/j.actamat.2008.08.032 |
| 5. | Straumal, B.; Baretzky, B.; Mazilkin, A.; Protasova, S.; Myatiev, A.; Straumal, P. J. Eur. Ceram. Soc. 2009, 29, 1963–1970. doi:10.1016/j.jeurceramsoc.2009.01.005 |
| 22. | Shinagawa, T.; Izaki, M.; Inui, H.; Murase, K.; Awakura, Y. Phys. Status Solidi A 2006, 203, 2760–2764. doi:10.1002/pssa.200669600 |
| 23. | Dorneles, L. S.; O’Mahony, D.; Fitzgerald, C. B.; McGee, F.; Venkatesan, M.; Stanca, I.; Lunney, J. G.; Coey, J. M. D. Appl. Surf. Sci. 2005, 248, 406–410. doi:10.1016/j.apsusc.2005.03.044 |
| 24. | Liu, H.; Yang, J.; Zhang, Y.; Wang, Y.; Wei, M. Mater. Chem. Phys. 2008, 112, 1021–1023. doi:10.1016/j.matchemphys.2008.07.004 |
| 25. | Feng, Q. J.; Shen, D. Z.; Zhang, J. Y.; Li, B. H.; Zhang, Z. Z.; Lu, Y. M.; Fan, X. W. Mater. Chem. Phys. 2008, 112, 1106–1109. doi:10.1016/j.matchemphys.2008.07.037 |
| 26. | Tamura, T.; Ozaki, H. J. Phys.: Condens. Matter 2009, 21, 026009. doi:10.1088/0953-8984/21/2/026009 |
| 27. | Zhang, B.; Li, Q. H.; Shi, L. Q.; Cheng, H. S.; Wang, J. Z. J. Vac. Sci. Technol., A 2008, 26, 1469–1473. doi:10.1116/1.2990855 |
| 28. | Kumar, R.; Pratap Singh, A.; Thakur, P.; Chae, K. H.; Choi, W. K.; Angadi, B.; Kaushik, S. D.; Patnaik, S. J. Phys. D: Appl. Phys. 2008, 41, 155002. doi:10.1088/0022-3727/41/15/155002 |
| 29. | Wei, Z.-R.; Li, Z.-Q.; Dong, G.-Y. J. Magn. Magn. Mater. 2008, 320, 916–918. doi:10.1016/j.jmmm.2007.09.017 |
| 30. | Wang, Y. Q.; Yuan, S. L.; Liu, L.; Li, P.; Lan, X. X.; Tian, Z. M.; He, J. H.; Yin, S. Y. J. Magn. Magn. Mater. 2008, 320, 1423–1426. doi:10.1016/j.jmmm.2007.10.007 |
| 31. | Seo, S.-Y.; Kwak, C.-H.; Lee, Y.-B.; Kim, S.-H.; Park, S.-H.; Han, S.-W. J. Korean Phys. Soc. 2008, 52, 805–809. doi:10.3938/jkps.52.805 |
| 32. | Kimishima, Y.; Uehara, M.; Irie, K.; Ishihara, S.; Yamaguchi, T.; Saitoh, M.; Kimoto, K.; Matsui, Y. J. Magn. Magn. Mater. 2008, 320, e674–e677. doi:10.1016/j.jmmm.2008.04.025 |
| 33. | Lee, H. Y.; Lee, J.; Na, G.; Nam, S.; Park, I.-H.; Park, J. H. J. Korean Phys. Soc. 2008, 52, 249–252. doi:10.3938/jkps.52.249 |
| 34. | Xin, M.; Chen, Y.; Jia, C.; Zhang, X. Mater. Lett. 2008, 62, 2717–2720. doi:10.1016/j.matlet.2008.01.024 |
| 35. | Jin, Z.; Fukumura, T.; Kawasaki, M.; Ando, K.; Saito, H.; Sekiguchi, T.; Yoo, Y. Z.; Murakami, M.; Matsumoto, Y.; Hasegawa, T.; Koinuma, H. Appl. Phys. Lett. 2001, 78, 3824–3826. doi:10.1063/1.1377856 |
| 36. | Venkatesan, M.; Fitzgerald, C. B.; Lunney, J. G.; Coey, J. M. D. Phys. Rev. Lett. 2004, 93, 177206. doi:10.1103/PhysRevLett.93.177206 |
| 37. | Zhang, H.-W.; Wei, Z.-R.; Li, Z.-Q.; Dong, G.-Y. Mater. Lett. 2007, 61, 3605–3607. doi:10.1016/j.matlet.2006.11.139 |
| 38. | Wei, X. X.; Song, C.; Geng, K. W.; Zeng, F.; He, B.; Pan, F. J. Phys.: Condens. Matter 2006, 18, 7471–7479. doi:10.1088/0953-8984/18/31/037 |
| 39. | Wang, X. C.; Mi, W. B.; Kuang, D. F. Appl. Surf. Sci. 2010, 256, 1930–1935. doi:10.1016/j.apsusc.2009.10.040 |
| 40. | Wang, C.; Chen, Z.; He, Y.; Li, L.; Zhang, D. Appl. Surf. Sci. 2009, 255, 6881–6887. doi:10.1016/j.apsusc.2009.03.008 |
| 41. | Kataoka, T.; Kobayashi, M.; Song, G. S.; Sakamoto, Y.; Fujimori, A.; Chang, F.-H.; Lin, H.-J.; Huang, D. J.; Chen, C. T.; Mandal, S. K.; Nath, T. K.; Karmakar, D.; Dasgupta, I. Jpn. J. Appl. Phys. 2009, 48, 04C200. doi:10.1143/JJAP.48.04C200 |
| 42. | Liu, H.; Yang, J.; Zhang, Y.; Yang, L.; Wei, M.; Ding, X. J. Phys.: Condens. Matter 2009, 21, 145803. doi:10.1088/0953-8984/21/14/145803 |
| 43. | Chen, X.; Zhou, Z.; Wang, K.; Fan, X.; Hu, S.; Wang, Y.; Huang, Y. Mater. Res. Bull. 2009, 44, 799–802. doi:10.1016/j.materresbull.2008.09.014 |
| 44. | Karamat, S.; Ke, C.; Tan, T. L.; Zhou, W.; Lee, P.; Rawat, R. S. Appl. Surf. Sci. 2009, 255, 4814–4820. doi:10.1016/j.apsusc.2008.11.077 |
| 45. | Hong, N. H.; Sakai, J.; Brizé, V. J. Phys.: Condens. Matter 2007, 19, 036219. doi:10.1088/0953-8984/19/3/036219 |
| 46. | Mandal, S. K.; Das, A. K.; Nath, T. K.; Karmakar, D. Appl. Phys. Lett. 2006, 89, 144105. doi:10.1063/1.2360176 |
| 47. | Wu, P.; Saraf, G.; Lu, Y.; Hill, D. H.; Gateau, R.; Wielunski, L.; Bartynski, R. A.; Arena, D. A.; Dvorak, J.; Moodenbaugh, A.; Siegrist, T.; Raley, J. A.; Yeo, Y. K. Appl. Phys. Lett. 2006, 89, 012508. doi:10.1063/1.2213519 |
| 48. | Kolesnik, S.; Dabrowski, B.; Mais, J. J. Appl. Phys. 2004, 95, 2582–2586. doi:10.1063/1.1644638 |
| 49. | Blasco, J.; Bartolomé, F.; García, L. M.; García, J. J. Mater. Chem. 2006, 16, 2282–2288. doi:10.1039/b518418e |
| 50. | Yoon, S. W.; Cho, S.-B.; We, S. C.; Yoon, S.; Suh, B. J.; Song, H. K.; Shin, Y. J. J. Appl. Phys. 2003, 93, 7879–7881. doi:10.1063/1.1556126 |
| 51. | Hörlin, T.; Svensson, G.; Olsson, E. J. Mater. Chem. 1998, 8, 2465–2473. doi:10.1039/A805291C |
| 52. | Blasco, J.; Bartolomé, F.; García, L. M.; García, J. J. Magn. Magn. Mater. 2007, 316, e177–e180. doi:10.1016/j.jmmm.2007.02.080 |
| 53. | Alaria, J.; Venkatesan, M.; Coey, J. M. D. J. Appl. Phys. 2008, 103, 07D123. doi:10.1063/1.2833840 |
| 54. | Glaspell, G.; Dutta, P.; Manivannan, A. J. Cluster Sci. 2005, 16, 523–536. doi:10.1007/s10876-005-0024-y |
| 55. | Ahn, G. Y.; Park, S.-I.; Shim, I.-B.; Kim, C. S. J. Magn. Magn. Mater. 2004, 282, 166–169. doi:10.1016/j.jmmm.2004.04.039 |
| 56. | Mandal, S. K.; Nath, T. K.; Karmakar, D. Philos. Mag. 2008, 88, 265–275. doi:10.1080/14786430701823205 |
| 57. | Uum, Y. R.; Han, B. S.; Lee, H. M.; Hong, S. M.; Kim, G. M.; Rhee, C. K. Phys. Status Solidi C 2007, 4, 4408–4411. doi:10.1002/pssc.200777208 |
| 58. | Han, S.-J.; Song, J. W.; Yang, C.-H.; Park, S. H.; Park, J.-H.; Jeong, Y. H.; Rhie, K. W. Appl. Phys. Lett. 2002, 81, 4212–4214. doi:10.1063/1.1525885 |
| 59. | Mandal, S. K.; Nath, T. K.; Das, A. J. Appl. Phys. 2007, 101, 123920. doi:10.1063/1.2748614 |
| 60. | Presmanes, L.; Capdeville, S.; Bonningue, C.; Datas, L.; Tailhades, P. Thin Solid Films 2007, 515, 6676–6681. doi:10.1016/j.tsf.2007.01.006 |
| 61. | Kumar, S.; Kim, Y. J.; Koo, B. H.; Sharma, S. K.; Vargas, J. M.; Knobel, M.; Gautam, S.; Chae, K. H.; Kim, D. K.; Kim, Y. K.; Lee, C. G. J. Appl. Phys. 2009, 105, 07C520. doi:10.1063/1.3073933 |
| 62. | Sharma, P. K.; Dutta, R. K.; Pandey, A. C.; Layek, S.; Verma, H. C. J. Magn. Magn. Mater. 2009, 321, 2587–2591. doi:10.1016/j.jmmm.2009.03.043 |
| 63. | Zhao, R. B.; Hou, D. L.; Wei, Y. Y.; Zhou, Z. Z.; Pan, C. F.; Zhen, C. M.; Tang, G. D. Mod. Phys. Lett. B 2009, 23, 815–824. doi:10.1142/S0217984909019089 |
| 64. | Lin, Y.; Jiang, D.; Lin, F.; Shi, W.; Ma, X. J. Alloys Compd. 2007, 436, 30–33. doi:10.1016/j.jallcom.2006.07.011 |
| 65. | Karmakar, D.; Mandal, S. K.; Kadam, R. M.; Paulose, P. L.; Rajarajan, A. K.; Nath, T. K.; Das, A. K.; Dasgupta, I.; Das, G. P. Phys. Rev. B 2007, 75, 144404. doi:10.1103/PhysRevB.75.144404 |
| 66. | Srivastava, A. K.; Deepa, M.; Bahadur, N.; Goyat, M. S. Mater. Chem. Phys. 2009, 114, 194–198. doi:10.1016/j.matchemphys.2008.09.005 |
| 21. | Lábár, J. L. Microsc. Microanal. 2008, 14, 287–295. doi:10.1017/S1431927608080380 |
| 22. | Shinagawa, T.; Izaki, M.; Inui, H.; Murase, K.; Awakura, Y. Phys. Status Solidi A 2006, 203, 2760–2764. doi:10.1002/pssa.200669600 |
| 23. | Dorneles, L. S.; O’Mahony, D.; Fitzgerald, C. B.; McGee, F.; Venkatesan, M.; Stanca, I.; Lunney, J. G.; Coey, J. M. D. Appl. Surf. Sci. 2005, 248, 406–410. doi:10.1016/j.apsusc.2005.03.044 |
| 24. | Liu, H.; Yang, J.; Zhang, Y.; Wang, Y.; Wei, M. Mater. Chem. Phys. 2008, 112, 1021–1023. doi:10.1016/j.matchemphys.2008.07.004 |
| 25. | Feng, Q. J.; Shen, D. Z.; Zhang, J. Y.; Li, B. H.; Zhang, Z. Z.; Lu, Y. M.; Fan, X. W. Mater. Chem. Phys. 2008, 112, 1106–1109. doi:10.1016/j.matchemphys.2008.07.037 |
| 26. | Tamura, T.; Ozaki, H. J. Phys.: Condens. Matter 2009, 21, 026009. doi:10.1088/0953-8984/21/2/026009 |
| 27. | Zhang, B.; Li, Q. H.; Shi, L. Q.; Cheng, H. S.; Wang, J. Z. J. Vac. Sci. Technol., A 2008, 26, 1469–1473. doi:10.1116/1.2990855 |
| 28. | Kumar, R.; Pratap Singh, A.; Thakur, P.; Chae, K. H.; Choi, W. K.; Angadi, B.; Kaushik, S. D.; Patnaik, S. J. Phys. D: Appl. Phys. 2008, 41, 155002. doi:10.1088/0022-3727/41/15/155002 |
| 29. | Wei, Z.-R.; Li, Z.-Q.; Dong, G.-Y. J. Magn. Magn. Mater. 2008, 320, 916–918. doi:10.1016/j.jmmm.2007.09.017 |
| 30. | Wang, Y. Q.; Yuan, S. L.; Liu, L.; Li, P.; Lan, X. X.; Tian, Z. M.; He, J. H.; Yin, S. Y. J. Magn. Magn. Mater. 2008, 320, 1423–1426. doi:10.1016/j.jmmm.2007.10.007 |
| 31. | Seo, S.-Y.; Kwak, C.-H.; Lee, Y.-B.; Kim, S.-H.; Park, S.-H.; Han, S.-W. J. Korean Phys. Soc. 2008, 52, 805–809. doi:10.3938/jkps.52.805 |
| 32. | Kimishima, Y.; Uehara, M.; Irie, K.; Ishihara, S.; Yamaguchi, T.; Saitoh, M.; Kimoto, K.; Matsui, Y. J. Magn. Magn. Mater. 2008, 320, e674–e677. doi:10.1016/j.jmmm.2008.04.025 |
| 33. | Lee, H. Y.; Lee, J.; Na, G.; Nam, S.; Park, I.-H.; Park, J. H. J. Korean Phys. Soc. 2008, 52, 249–252. doi:10.3938/jkps.52.249 |
| 34. | Xin, M.; Chen, Y.; Jia, C.; Zhang, X. Mater. Lett. 2008, 62, 2717–2720. doi:10.1016/j.matlet.2008.01.024 |
| 35. | Jin, Z.; Fukumura, T.; Kawasaki, M.; Ando, K.; Saito, H.; Sekiguchi, T.; Yoo, Y. Z.; Murakami, M.; Matsumoto, Y.; Hasegawa, T.; Koinuma, H. Appl. Phys. Lett. 2001, 78, 3824–3826. doi:10.1063/1.1377856 |
| 36. | Venkatesan, M.; Fitzgerald, C. B.; Lunney, J. G.; Coey, J. M. D. Phys. Rev. Lett. 2004, 93, 177206. doi:10.1103/PhysRevLett.93.177206 |
| 37. | Zhang, H.-W.; Wei, Z.-R.; Li, Z.-Q.; Dong, G.-Y. Mater. Lett. 2007, 61, 3605–3607. doi:10.1016/j.matlet.2006.11.139 |
| 38. | Wei, X. X.; Song, C.; Geng, K. W.; Zeng, F.; He, B.; Pan, F. J. Phys.: Condens. Matter 2006, 18, 7471–7479. doi:10.1088/0953-8984/18/31/037 |
| 39. | Wang, X. C.; Mi, W. B.; Kuang, D. F. Appl. Surf. Sci. 2010, 256, 1930–1935. doi:10.1016/j.apsusc.2009.10.040 |
| 40. | Wang, C.; Chen, Z.; He, Y.; Li, L.; Zhang, D. Appl. Surf. Sci. 2009, 255, 6881–6887. doi:10.1016/j.apsusc.2009.03.008 |
| 41. | Kataoka, T.; Kobayashi, M.; Song, G. S.; Sakamoto, Y.; Fujimori, A.; Chang, F.-H.; Lin, H.-J.; Huang, D. J.; Chen, C. T.; Mandal, S. K.; Nath, T. K.; Karmakar, D.; Dasgupta, I. Jpn. J. Appl. Phys. 2009, 48, 04C200. doi:10.1143/JJAP.48.04C200 |
| 42. | Liu, H.; Yang, J.; Zhang, Y.; Yang, L.; Wei, M.; Ding, X. J. Phys.: Condens. Matter 2009, 21, 145803. doi:10.1088/0953-8984/21/14/145803 |
| 43. | Chen, X.; Zhou, Z.; Wang, K.; Fan, X.; Hu, S.; Wang, Y.; Huang, Y. Mater. Res. Bull. 2009, 44, 799–802. doi:10.1016/j.materresbull.2008.09.014 |
| 44. | Karamat, S.; Ke, C.; Tan, T. L.; Zhou, W.; Lee, P.; Rawat, R. S. Appl. Surf. Sci. 2009, 255, 4814–4820. doi:10.1016/j.apsusc.2008.11.077 |
| 45. | Hong, N. H.; Sakai, J.; Brizé, V. J. Phys.: Condens. Matter 2007, 19, 036219. doi:10.1088/0953-8984/19/3/036219 |
| 46. | Mandal, S. K.; Das, A. K.; Nath, T. K.; Karmakar, D. Appl. Phys. Lett. 2006, 89, 144105. doi:10.1063/1.2360176 |
| 47. | Wu, P.; Saraf, G.; Lu, Y.; Hill, D. H.; Gateau, R.; Wielunski, L.; Bartynski, R. A.; Arena, D. A.; Dvorak, J.; Moodenbaugh, A.; Siegrist, T.; Raley, J. A.; Yeo, Y. K. Appl. Phys. Lett. 2006, 89, 012508. doi:10.1063/1.2213519 |
| 70. | Straumal, B. B.; Protasova, S. G.; Mazilkin, A. A.; Baretzky, B.; Myatiev, A. A.; Straumal, P. B.; Tietze, T.; Schütz, G.; Goering, E. Mater. Lett. 2012, 71, 21–24. doi:10.1016/j.matlet.2011.11.082 |
| 17. | Straumal, B. B.; Protasova, S. G.; Mazilkin, A. A.; Myatiev, A. A.; Straumal, P. B.; Schütz, G.; Goering, E.; Baretzky, B. J. Appl. Phys. 2010, 108, 073923. doi:10.1063/1.3486044 |
| 4. | Straumal, B. B.; Mazilkin, A. A.; Protasova, S. G.; Myatiev, A. A.; Straumal, P. B.; Baretzky, B. Acta Mater. 2008, 56, 6246–6256. doi:10.1016/j.actamat.2008.08.032 |
| 5. | Straumal, B.; Baretzky, B.; Mazilkin, A.; Protasova, S.; Myatiev, A.; Straumal, P. J. Eur. Ceram. Soc. 2009, 29, 1963–1970. doi:10.1016/j.jeurceramsoc.2009.01.005 |
| 68. | Straumal, B.; Mazilkin, A.; Protasova, S.; Myatiev, A.; Straumal, P.; Goering, E.; Baretzky, B. Phys. Status Solidi B 2011, 248, 1581–1586. doi:10.1002/pssb.201001182 |
| 69. | Straumal, B. B.; Mazilkin, A. A.; Protasova, S. G.; Myatiev, A. A.; Straumal, P. B.; Goering, E.; Baretzky, B. Thin Solid Films 2011, 520, 1192–1194. doi:10.1016/j.tsf.2011.04.154 |
| 70. | Straumal, B. B.; Protasova, S. G.; Mazilkin, A. A.; Baretzky, B.; Myatiev, A. A.; Straumal, P. B.; Tietze, T.; Schütz, G.; Goering, E. Mater. Lett. 2012, 71, 21–24. doi:10.1016/j.matlet.2011.11.082 |
| 30. | Wang, Y. Q.; Yuan, S. L.; Liu, L.; Li, P.; Lan, X. X.; Tian, Z. M.; He, J. H.; Yin, S. Y. J. Magn. Magn. Mater. 2008, 320, 1423–1426. doi:10.1016/j.jmmm.2007.10.007 |
| 37. | Zhang, H.-W.; Wei, Z.-R.; Li, Z.-Q.; Dong, G.-Y. Mater. Lett. 2007, 61, 3605–3607. doi:10.1016/j.matlet.2006.11.139 |
| 44. | Karamat, S.; Ke, C.; Tan, T. L.; Zhou, W.; Lee, P.; Rawat, R. S. Appl. Surf. Sci. 2009, 255, 4814–4820. doi:10.1016/j.apsusc.2008.11.077 |
| 48. | Kolesnik, S.; Dabrowski, B.; Mais, J. J. Appl. Phys. 2004, 95, 2582–2586. doi:10.1063/1.1644638 |
| 49. | Blasco, J.; Bartolomé, F.; García, L. M.; García, J. J. Mater. Chem. 2006, 16, 2282–2288. doi:10.1039/b518418e |
| 50. | Yoon, S. W.; Cho, S.-B.; We, S. C.; Yoon, S.; Suh, B. J.; Song, H. K.; Shin, Y. J. J. Appl. Phys. 2003, 93, 7879–7881. doi:10.1063/1.1556126 |
| 51. | Hörlin, T.; Svensson, G.; Olsson, E. J. Mater. Chem. 1998, 8, 2465–2473. doi:10.1039/A805291C |
| 52. | Blasco, J.; Bartolomé, F.; García, L. M.; García, J. J. Magn. Magn. Mater. 2007, 316, e177–e180. doi:10.1016/j.jmmm.2007.02.080 |
| 54. | Glaspell, G.; Dutta, P.; Manivannan, A. J. Cluster Sci. 2005, 16, 523–536. doi:10.1007/s10876-005-0024-y |
| 55. | Ahn, G. Y.; Park, S.-I.; Shim, I.-B.; Kim, C. S. J. Magn. Magn. Mater. 2004, 282, 166–169. doi:10.1016/j.jmmm.2004.04.039 |
| 58. | Han, S.-J.; Song, J. W.; Yang, C.-H.; Park, S. H.; Park, J.-H.; Jeong, Y. H.; Rhie, K. W. Appl. Phys. Lett. 2002, 81, 4212–4214. doi:10.1063/1.1525885 |
| 64. | Lin, Y.; Jiang, D.; Lin, F.; Shi, W.; Ma, X. J. Alloys Compd. 2007, 436, 30–33. doi:10.1016/j.jallcom.2006.07.011 |
| 24. | Liu, H.; Yang, J.; Zhang, Y.; Wang, Y.; Wei, M. Mater. Chem. Phys. 2008, 112, 1021–1023. doi:10.1016/j.matchemphys.2008.07.004 |
| 29. | Wei, Z.-R.; Li, Z.-Q.; Dong, G.-Y. J. Magn. Magn. Mater. 2008, 320, 916–918. doi:10.1016/j.jmmm.2007.09.017 |
| 32. | Kimishima, Y.; Uehara, M.; Irie, K.; Ishihara, S.; Yamaguchi, T.; Saitoh, M.; Kimoto, K.; Matsui, Y. J. Magn. Magn. Mater. 2008, 320, e674–e677. doi:10.1016/j.jmmm.2008.04.025 |
| 41. | Kataoka, T.; Kobayashi, M.; Song, G. S.; Sakamoto, Y.; Fujimori, A.; Chang, F.-H.; Lin, H.-J.; Huang, D. J.; Chen, C. T.; Mandal, S. K.; Nath, T. K.; Karmakar, D.; Dasgupta, I. Jpn. J. Appl. Phys. 2009, 48, 04C200. doi:10.1143/JJAP.48.04C200 |
| 42. | Liu, H.; Yang, J.; Zhang, Y.; Yang, L.; Wei, M.; Ding, X. J. Phys.: Condens. Matter 2009, 21, 145803. doi:10.1088/0953-8984/21/14/145803 |
| 46. | Mandal, S. K.; Das, A. K.; Nath, T. K.; Karmakar, D. Appl. Phys. Lett. 2006, 89, 144105. doi:10.1063/1.2360176 |
| 53. | Alaria, J.; Venkatesan, M.; Coey, J. M. D. J. Appl. Phys. 2008, 103, 07D123. doi:10.1063/1.2833840 |
| 56. | Mandal, S. K.; Nath, T. K.; Karmakar, D. Philos. Mag. 2008, 88, 265–275. doi:10.1080/14786430701823205 |
| 59. | Mandal, S. K.; Nath, T. K.; Das, A. J. Appl. Phys. 2007, 101, 123920. doi:10.1063/1.2748614 |
| 65. | Karmakar, D.; Mandal, S. K.; Kadam, R. M.; Paulose, P. L.; Rajarajan, A. K.; Nath, T. K.; Das, A. K.; Dasgupta, I.; Das, G. P. Phys. Rev. B 2007, 75, 144404. doi:10.1103/PhysRevB.75.144404 |
| 66. | Srivastava, A. K.; Deepa, M.; Bahadur, N.; Goyat, M. S. Mater. Chem. Phys. 2009, 114, 194–198. doi:10.1016/j.matchemphys.2008.09.005 |
| 26. | Tamura, T.; Ozaki, H. J. Phys.: Condens. Matter 2009, 21, 026009. doi:10.1088/0953-8984/21/2/026009 |
| 49. | Blasco, J.; Bartolomé, F.; García, L. M.; García, J. J. Mater. Chem. 2006, 16, 2282–2288. doi:10.1039/b518418e |
| 59. | Mandal, S. K.; Nath, T. K.; Das, A. J. Appl. Phys. 2007, 101, 123920. doi:10.1063/1.2748614 |
| 6. | Straumal, B. B.; Mazilkin, A. A.; Protasova, S. G.; Myatiev, A. A.; Straumal, P. B.; Schütz, G.; van Aken, P. A.; Goering, E.; Baretzky, B. Phys. Rev. B 2009, 79, 205206. doi:10.1103/PhysRevB.79.205206 |
| 39. | Wang, X. C.; Mi, W. B.; Kuang, D. F. Appl. Surf. Sci. 2010, 256, 1930–1935. doi:10.1016/j.apsusc.2009.10.040 |
| 63. | Zhao, R. B.; Hou, D. L.; Wei, Y. Y.; Zhou, Z. Z.; Pan, C. F.; Zhen, C. M.; Tang, G. D. Mod. Phys. Lett. B 2009, 23, 815–824. doi:10.1142/S0217984909019089 |
| 56. | Mandal, S. K.; Nath, T. K.; Karmakar, D. Philos. Mag. 2008, 88, 265–275. doi:10.1080/14786430701823205 |
| 57. | Uum, Y. R.; Han, B. S.; Lee, H. M.; Hong, S. M.; Kim, G. M.; Rhee, C. K. Phys. Status Solidi C 2007, 4, 4408–4411. doi:10.1002/pssc.200777208 |
| 58. | Han, S.-J.; Song, J. W.; Yang, C.-H.; Park, S. H.; Park, J.-H.; Jeong, Y. H.; Rhie, K. W. Appl. Phys. Lett. 2002, 81, 4212–4214. doi:10.1063/1.1525885 |
| 59. | Mandal, S. K.; Nath, T. K.; Das, A. J. Appl. Phys. 2007, 101, 123920. doi:10.1063/1.2748614 |
| 60. | Presmanes, L.; Capdeville, S.; Bonningue, C.; Datas, L.; Tailhades, P. Thin Solid Films 2007, 515, 6676–6681. doi:10.1016/j.tsf.2007.01.006 |
| 61. | Kumar, S.; Kim, Y. J.; Koo, B. H.; Sharma, S. K.; Vargas, J. M.; Knobel, M.; Gautam, S.; Chae, K. H.; Kim, D. K.; Kim, Y. K.; Lee, C. G. J. Appl. Phys. 2009, 105, 07C520. doi:10.1063/1.3073933 |
| 62. | Sharma, P. K.; Dutta, R. K.; Pandey, A. C.; Layek, S.; Verma, H. C. J. Magn. Magn. Mater. 2009, 321, 2587–2591. doi:10.1016/j.jmmm.2009.03.043 |
| 63. | Zhao, R. B.; Hou, D. L.; Wei, Y. Y.; Zhou, Z. Z.; Pan, C. F.; Zhen, C. M.; Tang, G. D. Mod. Phys. Lett. B 2009, 23, 815–824. doi:10.1142/S0217984909019089 |
| 64. | Lin, Y.; Jiang, D.; Lin, F.; Shi, W.; Ma, X. J. Alloys Compd. 2007, 436, 30–33. doi:10.1016/j.jallcom.2006.07.011 |
| 65. | Karmakar, D.; Mandal, S. K.; Kadam, R. M.; Paulose, P. L.; Rajarajan, A. K.; Nath, T. K.; Das, A. K.; Dasgupta, I.; Das, G. P. Phys. Rev. B 2007, 75, 144404. doi:10.1103/PhysRevB.75.144404 |
| 66. | Srivastava, A. K.; Deepa, M.; Bahadur, N.; Goyat, M. S. Mater. Chem. Phys. 2009, 114, 194–198. doi:10.1016/j.matchemphys.2008.09.005 |
| 18. | Straumal, B. B.; Mazilkin, A. A.; Protasova, S. G.; Straumal, P. B.; Myatiev, A. A.; Schütz, G.; Goering, E.; Tietze, T.; Baretzky, B. Philos. Mag. 2013, 93, 1371–1383. doi:10.1080/14786435.2012.736693 |
| 22. | Shinagawa, T.; Izaki, M.; Inui, H.; Murase, K.; Awakura, Y. Phys. Status Solidi A 2006, 203, 2760–2764. doi:10.1002/pssa.200669600 |
| 23. | Dorneles, L. S.; O’Mahony, D.; Fitzgerald, C. B.; McGee, F.; Venkatesan, M.; Stanca, I.; Lunney, J. G.; Coey, J. M. D. Appl. Surf. Sci. 2005, 248, 406–410. doi:10.1016/j.apsusc.2005.03.044 |
| 24. | Liu, H.; Yang, J.; Zhang, Y.; Wang, Y.; Wei, M. Mater. Chem. Phys. 2008, 112, 1021–1023. doi:10.1016/j.matchemphys.2008.07.004 |
| 25. | Feng, Q. J.; Shen, D. Z.; Zhang, J. Y.; Li, B. H.; Zhang, Z. Z.; Lu, Y. M.; Fan, X. W. Mater. Chem. Phys. 2008, 112, 1106–1109. doi:10.1016/j.matchemphys.2008.07.037 |
| 26. | Tamura, T.; Ozaki, H. J. Phys.: Condens. Matter 2009, 21, 026009. doi:10.1088/0953-8984/21/2/026009 |
| 27. | Zhang, B.; Li, Q. H.; Shi, L. Q.; Cheng, H. S.; Wang, J. Z. J. Vac. Sci. Technol., A 2008, 26, 1469–1473. doi:10.1116/1.2990855 |
| 28. | Kumar, R.; Pratap Singh, A.; Thakur, P.; Chae, K. H.; Choi, W. K.; Angadi, B.; Kaushik, S. D.; Patnaik, S. J. Phys. D: Appl. Phys. 2008, 41, 155002. doi:10.1088/0022-3727/41/15/155002 |
| 29. | Wei, Z.-R.; Li, Z.-Q.; Dong, G.-Y. J. Magn. Magn. Mater. 2008, 320, 916–918. doi:10.1016/j.jmmm.2007.09.017 |
| 30. | Wang, Y. Q.; Yuan, S. L.; Liu, L.; Li, P.; Lan, X. X.; Tian, Z. M.; He, J. H.; Yin, S. Y. J. Magn. Magn. Mater. 2008, 320, 1423–1426. doi:10.1016/j.jmmm.2007.10.007 |
| 31. | Seo, S.-Y.; Kwak, C.-H.; Lee, Y.-B.; Kim, S.-H.; Park, S.-H.; Han, S.-W. J. Korean Phys. Soc. 2008, 52, 805–809. doi:10.3938/jkps.52.805 |
| 32. | Kimishima, Y.; Uehara, M.; Irie, K.; Ishihara, S.; Yamaguchi, T.; Saitoh, M.; Kimoto, K.; Matsui, Y. J. Magn. Magn. Mater. 2008, 320, e674–e677. doi:10.1016/j.jmmm.2008.04.025 |
| 33. | Lee, H. Y.; Lee, J.; Na, G.; Nam, S.; Park, I.-H.; Park, J. H. J. Korean Phys. Soc. 2008, 52, 249–252. doi:10.3938/jkps.52.249 |
| 34. | Xin, M.; Chen, Y.; Jia, C.; Zhang, X. Mater. Lett. 2008, 62, 2717–2720. doi:10.1016/j.matlet.2008.01.024 |
| 35. | Jin, Z.; Fukumura, T.; Kawasaki, M.; Ando, K.; Saito, H.; Sekiguchi, T.; Yoo, Y. Z.; Murakami, M.; Matsumoto, Y.; Hasegawa, T.; Koinuma, H. Appl. Phys. Lett. 2001, 78, 3824–3826. doi:10.1063/1.1377856 |
| 36. | Venkatesan, M.; Fitzgerald, C. B.; Lunney, J. G.; Coey, J. M. D. Phys. Rev. Lett. 2004, 93, 177206. doi:10.1103/PhysRevLett.93.177206 |
| 37. | Zhang, H.-W.; Wei, Z.-R.; Li, Z.-Q.; Dong, G.-Y. Mater. Lett. 2007, 61, 3605–3607. doi:10.1016/j.matlet.2006.11.139 |
| 38. | Wei, X. X.; Song, C.; Geng, K. W.; Zeng, F.; He, B.; Pan, F. J. Phys.: Condens. Matter 2006, 18, 7471–7479. doi:10.1088/0953-8984/18/31/037 |
| 39. | Wang, X. C.; Mi, W. B.; Kuang, D. F. Appl. Surf. Sci. 2010, 256, 1930–1935. doi:10.1016/j.apsusc.2009.10.040 |
| 40. | Wang, C.; Chen, Z.; He, Y.; Li, L.; Zhang, D. Appl. Surf. Sci. 2009, 255, 6881–6887. doi:10.1016/j.apsusc.2009.03.008 |
| 41. | Kataoka, T.; Kobayashi, M.; Song, G. S.; Sakamoto, Y.; Fujimori, A.; Chang, F.-H.; Lin, H.-J.; Huang, D. J.; Chen, C. T.; Mandal, S. K.; Nath, T. K.; Karmakar, D.; Dasgupta, I. Jpn. J. Appl. Phys. 2009, 48, 04C200. doi:10.1143/JJAP.48.04C200 |
| 42. | Liu, H.; Yang, J.; Zhang, Y.; Yang, L.; Wei, M.; Ding, X. J. Phys.: Condens. Matter 2009, 21, 145803. doi:10.1088/0953-8984/21/14/145803 |
| 43. | Chen, X.; Zhou, Z.; Wang, K.; Fan, X.; Hu, S.; Wang, Y.; Huang, Y. Mater. Res. Bull. 2009, 44, 799–802. doi:10.1016/j.materresbull.2008.09.014 |
| 44. | Karamat, S.; Ke, C.; Tan, T. L.; Zhou, W.; Lee, P.; Rawat, R. S. Appl. Surf. Sci. 2009, 255, 4814–4820. doi:10.1016/j.apsusc.2008.11.077 |
| 45. | Hong, N. H.; Sakai, J.; Brizé, V. J. Phys.: Condens. Matter 2007, 19, 036219. doi:10.1088/0953-8984/19/3/036219 |
| 46. | Mandal, S. K.; Das, A. K.; Nath, T. K.; Karmakar, D. Appl. Phys. Lett. 2006, 89, 144105. doi:10.1063/1.2360176 |
| 47. | Wu, P.; Saraf, G.; Lu, Y.; Hill, D. H.; Gateau, R.; Wielunski, L.; Bartynski, R. A.; Arena, D. A.; Dvorak, J.; Moodenbaugh, A.; Siegrist, T.; Raley, J. A.; Yeo, Y. K. Appl. Phys. Lett. 2006, 89, 012508. doi:10.1063/1.2213519 |
| 48. | Kolesnik, S.; Dabrowski, B.; Mais, J. J. Appl. Phys. 2004, 95, 2582–2586. doi:10.1063/1.1644638 |
| 49. | Blasco, J.; Bartolomé, F.; García, L. M.; García, J. J. Mater. Chem. 2006, 16, 2282–2288. doi:10.1039/b518418e |
| 50. | Yoon, S. W.; Cho, S.-B.; We, S. C.; Yoon, S.; Suh, B. J.; Song, H. K.; Shin, Y. J. J. Appl. Phys. 2003, 93, 7879–7881. doi:10.1063/1.1556126 |
| 51. | Hörlin, T.; Svensson, G.; Olsson, E. J. Mater. Chem. 1998, 8, 2465–2473. doi:10.1039/A805291C |
| 52. | Blasco, J.; Bartolomé, F.; García, L. M.; García, J. J. Magn. Magn. Mater. 2007, 316, e177–e180. doi:10.1016/j.jmmm.2007.02.080 |
| 53. | Alaria, J.; Venkatesan, M.; Coey, J. M. D. J. Appl. Phys. 2008, 103, 07D123. doi:10.1063/1.2833840 |
| 54. | Glaspell, G.; Dutta, P.; Manivannan, A. J. Cluster Sci. 2005, 16, 523–536. doi:10.1007/s10876-005-0024-y |
| 55. | Ahn, G. Y.; Park, S.-I.; Shim, I.-B.; Kim, C. S. J. Magn. Magn. Mater. 2004, 282, 166–169. doi:10.1016/j.jmmm.2004.04.039 |
| 56. | Mandal, S. K.; Nath, T. K.; Karmakar, D. Philos. Mag. 2008, 88, 265–275. doi:10.1080/14786430701823205 |
| 57. | Uum, Y. R.; Han, B. S.; Lee, H. M.; Hong, S. M.; Kim, G. M.; Rhee, C. K. Phys. Status Solidi C 2007, 4, 4408–4411. doi:10.1002/pssc.200777208 |
| 58. | Han, S.-J.; Song, J. W.; Yang, C.-H.; Park, S. H.; Park, J.-H.; Jeong, Y. H.; Rhie, K. W. Appl. Phys. Lett. 2002, 81, 4212–4214. doi:10.1063/1.1525885 |
| 59. | Mandal, S. K.; Nath, T. K.; Das, A. J. Appl. Phys. 2007, 101, 123920. doi:10.1063/1.2748614 |
| 60. | Presmanes, L.; Capdeville, S.; Bonningue, C.; Datas, L.; Tailhades, P. Thin Solid Films 2007, 515, 6676–6681. doi:10.1016/j.tsf.2007.01.006 |
| 61. | Kumar, S.; Kim, Y. J.; Koo, B. H.; Sharma, S. K.; Vargas, J. M.; Knobel, M.; Gautam, S.; Chae, K. H.; Kim, D. K.; Kim, Y. K.; Lee, C. G. J. Appl. Phys. 2009, 105, 07C520. doi:10.1063/1.3073933 |
| 62. | Sharma, P. K.; Dutta, R. K.; Pandey, A. C.; Layek, S.; Verma, H. C. J. Magn. Magn. Mater. 2009, 321, 2587–2591. doi:10.1016/j.jmmm.2009.03.043 |
| 63. | Zhao, R. B.; Hou, D. L.; Wei, Y. Y.; Zhou, Z. Z.; Pan, C. F.; Zhen, C. M.; Tang, G. D. Mod. Phys. Lett. B 2009, 23, 815–824. doi:10.1142/S0217984909019089 |
| 64. | Lin, Y.; Jiang, D.; Lin, F.; Shi, W.; Ma, X. J. Alloys Compd. 2007, 436, 30–33. doi:10.1016/j.jallcom.2006.07.011 |
| 65. | Karmakar, D.; Mandal, S. K.; Kadam, R. M.; Paulose, P. L.; Rajarajan, A. K.; Nath, T. K.; Das, A. K.; Dasgupta, I.; Das, G. P. Phys. Rev. B 2007, 75, 144404. doi:10.1103/PhysRevB.75.144404 |
| 66. | Srivastava, A. K.; Deepa, M.; Bahadur, N.; Goyat, M. S. Mater. Chem. Phys. 2009, 114, 194–198. doi:10.1016/j.matchemphys.2008.09.005 |
| 38. | Wei, X. X.; Song, C.; Geng, K. W.; Zeng, F.; He, B.; Pan, F. J. Phys.: Condens. Matter 2006, 18, 7471–7479. doi:10.1088/0953-8984/18/31/037 |
| 39. | Wang, X. C.; Mi, W. B.; Kuang, D. F. Appl. Surf. Sci. 2010, 256, 1930–1935. doi:10.1016/j.apsusc.2009.10.040 |
| 40. | Wang, C.; Chen, Z.; He, Y.; Li, L.; Zhang, D. Appl. Surf. Sci. 2009, 255, 6881–6887. doi:10.1016/j.apsusc.2009.03.008 |
| 63. | Zhao, R. B.; Hou, D. L.; Wei, Y. Y.; Zhou, Z. Z.; Pan, C. F.; Zhen, C. M.; Tang, G. D. Mod. Phys. Lett. B 2009, 23, 815–824. doi:10.1142/S0217984909019089 |
| 22. | Shinagawa, T.; Izaki, M.; Inui, H.; Murase, K.; Awakura, Y. Phys. Status Solidi A 2006, 203, 2760–2764. doi:10.1002/pssa.200669600 |
| 23. | Dorneles, L. S.; O’Mahony, D.; Fitzgerald, C. B.; McGee, F.; Venkatesan, M.; Stanca, I.; Lunney, J. G.; Coey, J. M. D. Appl. Surf. Sci. 2005, 248, 406–410. doi:10.1016/j.apsusc.2005.03.044 |
| 24. | Liu, H.; Yang, J.; Zhang, Y.; Wang, Y.; Wei, M. Mater. Chem. Phys. 2008, 112, 1021–1023. doi:10.1016/j.matchemphys.2008.07.004 |
| 25. | Feng, Q. J.; Shen, D. Z.; Zhang, J. Y.; Li, B. H.; Zhang, Z. Z.; Lu, Y. M.; Fan, X. W. Mater. Chem. Phys. 2008, 112, 1106–1109. doi:10.1016/j.matchemphys.2008.07.037 |
| 26. | Tamura, T.; Ozaki, H. J. Phys.: Condens. Matter 2009, 21, 026009. doi:10.1088/0953-8984/21/2/026009 |
| 27. | Zhang, B.; Li, Q. H.; Shi, L. Q.; Cheng, H. S.; Wang, J. Z. J. Vac. Sci. Technol., A 2008, 26, 1469–1473. doi:10.1116/1.2990855 |
| 28. | Kumar, R.; Pratap Singh, A.; Thakur, P.; Chae, K. H.; Choi, W. K.; Angadi, B.; Kaushik, S. D.; Patnaik, S. J. Phys. D: Appl. Phys. 2008, 41, 155002. doi:10.1088/0022-3727/41/15/155002 |
| 29. | Wei, Z.-R.; Li, Z.-Q.; Dong, G.-Y. J. Magn. Magn. Mater. 2008, 320, 916–918. doi:10.1016/j.jmmm.2007.09.017 |
| 30. | Wang, Y. Q.; Yuan, S. L.; Liu, L.; Li, P.; Lan, X. X.; Tian, Z. M.; He, J. H.; Yin, S. Y. J. Magn. Magn. Mater. 2008, 320, 1423–1426. doi:10.1016/j.jmmm.2007.10.007 |
| 31. | Seo, S.-Y.; Kwak, C.-H.; Lee, Y.-B.; Kim, S.-H.; Park, S.-H.; Han, S.-W. J. Korean Phys. Soc. 2008, 52, 805–809. doi:10.3938/jkps.52.805 |
| 32. | Kimishima, Y.; Uehara, M.; Irie, K.; Ishihara, S.; Yamaguchi, T.; Saitoh, M.; Kimoto, K.; Matsui, Y. J. Magn. Magn. Mater. 2008, 320, e674–e677. doi:10.1016/j.jmmm.2008.04.025 |
| 33. | Lee, H. Y.; Lee, J.; Na, G.; Nam, S.; Park, I.-H.; Park, J. H. J. Korean Phys. Soc. 2008, 52, 249–252. doi:10.3938/jkps.52.249 |
| 34. | Xin, M.; Chen, Y.; Jia, C.; Zhang, X. Mater. Lett. 2008, 62, 2717–2720. doi:10.1016/j.matlet.2008.01.024 |
| 35. | Jin, Z.; Fukumura, T.; Kawasaki, M.; Ando, K.; Saito, H.; Sekiguchi, T.; Yoo, Y. Z.; Murakami, M.; Matsumoto, Y.; Hasegawa, T.; Koinuma, H. Appl. Phys. Lett. 2001, 78, 3824–3826. doi:10.1063/1.1377856 |
| 36. | Venkatesan, M.; Fitzgerald, C. B.; Lunney, J. G.; Coey, J. M. D. Phys. Rev. Lett. 2004, 93, 177206. doi:10.1103/PhysRevLett.93.177206 |
| 37. | Zhang, H.-W.; Wei, Z.-R.; Li, Z.-Q.; Dong, G.-Y. Mater. Lett. 2007, 61, 3605–3607. doi:10.1016/j.matlet.2006.11.139 |
| 38. | Wei, X. X.; Song, C.; Geng, K. W.; Zeng, F.; He, B.; Pan, F. J. Phys.: Condens. Matter 2006, 18, 7471–7479. doi:10.1088/0953-8984/18/31/037 |
| 39. | Wang, X. C.; Mi, W. B.; Kuang, D. F. Appl. Surf. Sci. 2010, 256, 1930–1935. doi:10.1016/j.apsusc.2009.10.040 |
| 40. | Wang, C.; Chen, Z.; He, Y.; Li, L.; Zhang, D. Appl. Surf. Sci. 2009, 255, 6881–6887. doi:10.1016/j.apsusc.2009.03.008 |
| 41. | Kataoka, T.; Kobayashi, M.; Song, G. S.; Sakamoto, Y.; Fujimori, A.; Chang, F.-H.; Lin, H.-J.; Huang, D. J.; Chen, C. T.; Mandal, S. K.; Nath, T. K.; Karmakar, D.; Dasgupta, I. Jpn. J. Appl. Phys. 2009, 48, 04C200. doi:10.1143/JJAP.48.04C200 |
| 42. | Liu, H.; Yang, J.; Zhang, Y.; Yang, L.; Wei, M.; Ding, X. J. Phys.: Condens. Matter 2009, 21, 145803. doi:10.1088/0953-8984/21/14/145803 |
| 43. | Chen, X.; Zhou, Z.; Wang, K.; Fan, X.; Hu, S.; Wang, Y.; Huang, Y. Mater. Res. Bull. 2009, 44, 799–802. doi:10.1016/j.materresbull.2008.09.014 |
| 44. | Karamat, S.; Ke, C.; Tan, T. L.; Zhou, W.; Lee, P.; Rawat, R. S. Appl. Surf. Sci. 2009, 255, 4814–4820. doi:10.1016/j.apsusc.2008.11.077 |
| 45. | Hong, N. H.; Sakai, J.; Brizé, V. J. Phys.: Condens. Matter 2007, 19, 036219. doi:10.1088/0953-8984/19/3/036219 |
| 46. | Mandal, S. K.; Das, A. K.; Nath, T. K.; Karmakar, D. Appl. Phys. Lett. 2006, 89, 144105. doi:10.1063/1.2360176 |
| 47. | Wu, P.; Saraf, G.; Lu, Y.; Hill, D. H.; Gateau, R.; Wielunski, L.; Bartynski, R. A.; Arena, D. A.; Dvorak, J.; Moodenbaugh, A.; Siegrist, T.; Raley, J. A.; Yeo, Y. K. Appl. Phys. Lett. 2006, 89, 012508. doi:10.1063/1.2213519 |
| 18. | Straumal, B. B.; Mazilkin, A. A.; Protasova, S. G.; Straumal, P. B.; Myatiev, A. A.; Schütz, G.; Goering, E.; Tietze, T.; Baretzky, B. Philos. Mag. 2013, 93, 1371–1383. doi:10.1080/14786435.2012.736693 |
| 48. | Kolesnik, S.; Dabrowski, B.; Mais, J. J. Appl. Phys. 2004, 95, 2582–2586. doi:10.1063/1.1644638 |
| 49. | Blasco, J.; Bartolomé, F.; García, L. M.; García, J. J. Mater. Chem. 2006, 16, 2282–2288. doi:10.1039/b518418e |
| 50. | Yoon, S. W.; Cho, S.-B.; We, S. C.; Yoon, S.; Suh, B. J.; Song, H. K.; Shin, Y. J. J. Appl. Phys. 2003, 93, 7879–7881. doi:10.1063/1.1556126 |
| 51. | Hörlin, T.; Svensson, G.; Olsson, E. J. Mater. Chem. 1998, 8, 2465–2473. doi:10.1039/A805291C |
| 52. | Blasco, J.; Bartolomé, F.; García, L. M.; García, J. J. Magn. Magn. Mater. 2007, 316, e177–e180. doi:10.1016/j.jmmm.2007.02.080 |
| 53. | Alaria, J.; Venkatesan, M.; Coey, J. M. D. J. Appl. Phys. 2008, 103, 07D123. doi:10.1063/1.2833840 |
| 54. | Glaspell, G.; Dutta, P.; Manivannan, A. J. Cluster Sci. 2005, 16, 523–536. doi:10.1007/s10876-005-0024-y |
| 55. | Ahn, G. Y.; Park, S.-I.; Shim, I.-B.; Kim, C. S. J. Magn. Magn. Mater. 2004, 282, 166–169. doi:10.1016/j.jmmm.2004.04.039 |
| 17. | Straumal, B. B.; Protasova, S. G.; Mazilkin, A. A.; Myatiev, A. A.; Straumal, P. B.; Schütz, G.; Goering, E.; Baretzky, B. J. Appl. Phys. 2010, 108, 073923. doi:10.1063/1.3486044 |
© 2013 Straumal et al; licensee Beilstein-Institut.
This is an Open Access article under the terms of the Creative Commons Attribution License (http://creativecommons.org/licenses/by/2.0), which permits unrestricted use, distribution, and reproduction in any medium, provided the original work is properly cited.
The license is subject to the Beilstein Journal of Nanotechnology terms and conditions: (http://www.beilstein-journals.org/bjnano)