1CNR-ISASI and Physics Department, University of Naples Federico II, Via Cinthia Monte S. Angelo, 80126, Naples, Italy
2CEMDATIC, E.T.S.I. Telecomunicación, Universidad Politécnica de Madrid, Avda. Complutense 30, 28040 Madrid, Spain,
3Institute of Applied Physics, Military University of Technology, 00-908 Warsaw, Poland
Corresponding author email
Associate Editor: A. Gölzhäuser Beilstein J. Nanotechnol.2016,7, 1743–1748.https://doi.org/10.3762/bjnano.7.167 Received 05 Jul 2016,
Accepted 02 Nov 2016,
Published 17 Nov 2016
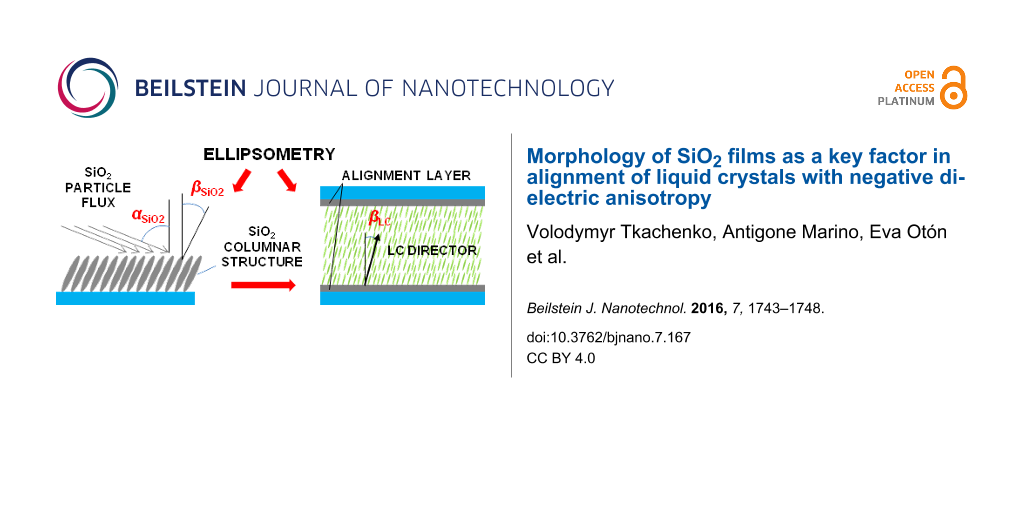
Control of liquid crystal (LC) orientation using a proper SiO2 alignment layer is essential for the optimization of vertically aligned nematic (VAN) displays. With this aim, we studied the optical anisotropy of thin SiO2 films by generalized ellipsometry as a function of deposition angle. The columnar SiO2 structure orientation measured by a noninvasive ellipsometry technique is reported for the first time, and its morphology influence on the LC alignment is demonstrated for large deposition angles.
Thin films of SiO2 and SiOx obtained by oblique deposition are commonly used as alignment layers for liquid crystal (LC) displays [1-7]. Several alignments can be induced in nematic LCs, including the homeotropic employed in VAN displays. However, the LC director of actual VAN displays is never exactly vertical. Even with no applied voltage, there is always a small angle between director and the normal to the alignment surface, called the pretilt. The control of pretilt in VAN cells is essential in many applications, as it affects display contrast and response time [2,6,7].
Pretilt depends on a number of factors such as chemical interaction forces between LC molecules and an alignment film, dielectric anisotropy of the LC, and film morphology. Many authors have reported that LC alignment can be controlled by choosing the deposition angle, α, defined as the angle between the SiO2 vapor beam and normal to the substrate [2-6]. At α < 40° LC molecules with positive and negative dielectric anisotropy, Δε, tend to align homogeneously and homeotropically, respectively. Such behavior can be explained by induced dipole–dipole interaction between LC and a smoothed oxide surface derived from van der Waals forces [3,8]. When α increases from 60° to 85°, the preferred orientation of LC with positive Δε switches from orthogonal to parallel to the plane of particle incidence. Moreover, two-fold alignment domains can appear with two easy axes symmetrical with respect to that plane [4,8]. Amosova et al. [5] explained switching in LC alignment in terms of the length of the crystallites forming relief of the aligning surface and surface wetting by particular LC. In the case of negative Δε, LC alignment only takes place in plane of particle incidence [3,4], defined mainly by film morphology.
The most amazing morphological feature of obliquely deposited polycrystalline films is its columnar structure, which appears to be due to a self-shadowing effect [9] and results in columns tilted with respect to the substrate normal. The empirical "tangent rule" has been proposed [10] to describe the connection between the deposition angle and the column tilt. A number of theoretical models has been proposed to understand formation of the columnar structure, such as a ballistic shadowing model giving the so-called "cosine rule" [11], a continuum model taking surface diffusion into account [12], and a model that accounts for the tendency of the columns to fan out during deposition [13]. The analytical formulas obtained within these models provide a first estimation, but fail when applied to wide ranges of deposition angle and film materials. Some numerical approaches can improve agreement with experiment taking into consideration surface diffusion and the angular broadening of the deposition flux [14,15].
Obliquely deposited SiO2 films are of special interest in photonics because of porosity dependence on the deposition angle, and consequently low and controllable refractive index. Many research groups have studied such films with ellipsometry techniques [16-18]. Some of them [16,17] investigated porosity and refractive index without taking into account birefringence while Gospodyn et al. [18] studied anisotropic refractive index as well. However, information on the index ellipsoid orientation of obliquely evaporated SiO2 films is still missing.
The connection between SiO2 column tilt and pretilt of LCs is not clarified yet. Most papers focused on LC alignment have not properly studied the morphology of the SiO2 films, and particularly, column tilt in a wide range of deposition angles [2-5]. Numerous experimental results reported in the papers, which are focused solely on SiO2 films, cannot help because of strong dependence of film properties on deposition conditions (e.g., deposition technique, gas composition and pressure in a chamber, deposition rate, substrate temperature, impurities) [19].
In this work, we investigate the morphology of obliquely deposited SiO2 films and its effect on alignment of LCs with negative Δε. We kept the same deposition conditions while preparing SiO2 samples and SiO2 alignment layers for LC cells. The optical anisotropy of all samples was characterized by the ellipsometric technique. The SiO2 column tilt and LC pretilt are obtained from the orientation of corresponding index ellipsoids. We report all measured parameters as a function of the deposition angle. Some of the results are compared with the experimental data and simulations from literature.
Experimental
SiO2 films and LC cells
SiO2 thin films were deposited by electron-beam evaporation on indium tin oxide (ITO) coated glass substrates (Glasstone) using a Vacudel 300 Telstar. The pressure in the chamber and substrate temperature were 5.3·10−4 Pa and 330 K, respectively. Granules of pure SiO2 (99.99%) were used as a source of evaporated material. The distance between the source and substrate was 75 cm to minimize angular spread of deposition on the substrate to about 1.5°. The samples were deposited at deposition angles of 0°, 30°, 40°, 50°, 60°, 70°, 75°, 80°, 82°, 84°, and 86° (i.e., grazing incidence). We used a deposition rate of 1 Å/s, as measured at normal incidence, to ensure a constant columnar structure through the film. The nominal thickness of the SiO2 films was increased from 60 nm for α = 0° to 400 nm for α = 86° because the structure becomes less packed at increasing deposition angles [2]. Thick and homogeneous layers are required in ellipsometry studies of low-index films.
For LC pretilt measurements, the SiO2 layers were kept to approximately 10 nm to minimize their optical influence on the proper characterization of LC layer. The VAN cells were comprised of two SiO2-coated substrates of opposite deposition directions, 4 μm spacers, and a Merck MLC6608 nematic LC with Δε = −4.2.
Ellipsometry
A variable angle spectroscopic ellipsometer (VASE) from J.A. Woollam Co., Inc. was used for optical characterization. The six generalized ellipsometry (GE) parameters Ψ, Ψsp, Ψps, Δ, Δsp, and Δps are linked to the Jones matrices of the reflected (Jr) or transmitted (Jt) beam via following equations [20]:
(1)
where Jpp, Jss, Jsp, and Jps are the corresponding elements of the matrices
with rpp, rss, rps, rsp (tpp, tss, tps, tsp) representing the reflection (transmission) coefficients for p-, s-, and cross-polarizations, respectively.
GE is a technique that measures thickness and dielectric constants of anisotropic thin films, being strongly sensitive to orientation of the index ellipsoid. The quantitative information for the desired physical parameters can be obtained by using inversion of the experimental data, as ellipsometry does not directly measure film parameters, but the integral optical response of the whole stack. To extract the film parameters, it is necessary to draw up a multilayer optical model in which the unknown parameters – such as thickness or optical constants values – are adjusted until the model best fits the experimental data. The number of existing studies on ellipsometry and LC confirms this technique as a reference for such materials. The measure of the optical constants [21], tilt distribution and anchoring strength [22] in nematic LC cells is well reported. The integration of VASE with other techniques [23] has also been investigated to improve the reliability and accuracy of the optical constants measurement, in an effort to reduce the critical dependence of the multiparameter fitting procedure from the initial guess.
Figure 1 schematically shows the probe light beam incident on the sample at angle θ. Two coordinate systems are used in this optical model. The first one is the laboratory system, whose coordinates (x',y',z') are chosen with the y' axis normal to the incidence plane, and the z' axis normal to the sample plane. The second one is the sample reference system, whose coordinates (x,y,z) diagonalize the anisotropic permittivity tensor. These two systems are related to each other by two Euler angle rotations: by angle φ about the axis z' and by angle β about the axis x. β is a tilt of the axis z from the normal to the sample plane, while φ is the angle between the y' axis and the projection of the axis y on the sample plane. The samples were oriented such that the SiO2 deposition angle was in the y'–z' plane (φ ≈ 0°).
Figure 1:
Incidence of the probe beam on the sample and the laboratory (x',y',z') and the sample (x,y,z) coordinate systems.
Figure 1:
Incidence of the probe beam on the sample and the laboratory (x',y',z') and the sample (x,y,z) coor...
In order to decrease the number of fitting parameters, the glass substrate and the ITO coating were characterized first. The optical properties of these materials were kept constant during the fit procedure for SiO2 films and LC cells, as usual for ellipsometric study of multilayers [6,21-23]. To characterize the SiO2 films, a 3-step strategy was applied as adopted elsewhere [6]:
Reflection GE parameters are measured at 50°, 60°, and 70° in the wavelength range λ = 400–1700 nm. These data are mostly sensitive to the optical constants and thickness of the anisotropic layer.
Transmission GE parameters are measured at λ = 1200 nm varying θ from −15° to 60°. The off-diagonal elements of the Ψ and Δ matrices are strongly affected by the orientation of index ellipsoid (angles β and φ) but also by birefringence and film thickness.
The optical model is adjusted until the best fit to the experimental data is obtained, revealing anisotropic refractive index, film thickness and orientation of index ellipsoid.
During LC cell characterization, reflection GE parameters were measured at θ = 56.5°, close to the Brewster angle for glass–air interface at the working wavelength range; in this way, reflections from glass substrates are reduced. These reflections could decrease the degree of polarization of the beam, and consequently, the accuracy of the measurements. The transmission GE parameters were obtained in the same way as for SiO2 films.
The dielectric function εj of porous SiO2 layers was described using the effective media theory of Bruggeman [24], generalized for ellipsoidal inclusions of two components which are equally oriented and randomly dispersed [25]:
(2)
Here p is the porosity (volume fraction of pore), ε1 = 1 is the permittivity of air, and ε2 is the permittivity of SiO2[26]. Lj are the adjustable depolarization factors for the three main axes of the ellipsoidal inclusions, describing the effect of inclusion shape on the anisotropic dielectric function. The depolarization factor dependence on light polarization is easy to demonstrate for the case of spheroidal inclusions: Lx,y,z = 1/3 for spheres; while 0 < Lz < 1/3 for light polarized parallel to the major axis z of a prolate spheroid and 1/3 < Lx,y < 1/2 for orthogonal polarizations. The main semi-axes of the index ellipsoid are defined by nx = √εx, ny = √εy and nz = √εz. The orientation of the index ellipsoid is determined by the angles β = βSiO2 (SiO2 column tilt) and φ = φSiO2.
The LC layer was considered as a uniaxial optical medium, whose optical axis was defined by the angles β = βLC (LC pretilt) and φ = φLC. The ordinary and extraordinary refractive indices were described by the Cauchy dispersion formula.
Porosity, Lj, βSiO2, βLC, thicknesses of SiO2 and LC layers and the Cauchy parameters were found by experimental fits. Even though the values of φSiO2 and φLC were less than 1°, we fit them to improve accuracy of the desired physical quantities.
Results and Discussion
The porosity of SiO2 films is close to zero for α less than 50° and increases with α up to 0.71 at α = 86° as shown in Figure 2. The inset shows FESEM top-view images of SiO2 samples for α = 80° and α = 86° [2]. As one can see, the SiO2 morphology becomes less packed and a columnar structure appears to be tilted from the viewing direction when the angle of deposition increases.
Figure 2:
Porosity of SiO2 films vs angle of deposition (filled squares). Also shown are corrected data from [16] (empty circles) and the curve simulated in [17]. The inset shows FESEM top-view images of SiO2 samples for α = 80° and α = 86°.
Figure 2:
Porosity of SiO2 films vs angle of deposition (filled squares). Also shown are corrected data from [16]...
Yang et al. [16] calculated the film porosity from the measured isotropic refractive index n using the formula p = 1 – [(n − 1)/(ε2 − 1)] which overestimates porosity values by a factor 3n2/(2n2 + 1) as compared with Equation 2. In Figure 2 we present their data corrected to be consistent with Equation 2. Moreover, we present the theoretical curve [17] obtained on the basis of the ballistic model taking into account superficial diffusion of SiO2 particles during the deposition process. According to that model, the influence of superficial diffusion diminishes with α growth so that the porosity derivative increases with α approaching 90°. That explains the dramatic change in the observed film morphology for α = 80° and α = 86°.
Both experimental data are much below the theoretical curve which can be caused by the presence of water within hydrophilic SiO2 pores which is difficult to control in ex situ film characterization [18,19]. The presence of water results in an overall increase of the refractive indices and decreases porosity as compared with theoretical predictions. Note that porosity values are necessary for making the adequate ellipsometric model of SiO2 film but they do not affect βSiO2 data which are our main objective.
The case of zero porosity is also in contrast to the theoretical curve for deposition angles less than 50°. This is due to SiO2 islands coalescing without forming distinguished columns when surface diffusion overcomes the shadowing effect [19]. The film structure appears to be "pebble dash-like" [2] with a density approaching that of the bulk material.
Figure 3 shows the three components of the SiO2 anisotropic refractive index at λ = 532 nm as a function of the deposition angle.
Figure 3:
The anisotropic refractive index (nonfilled symbols) of porous SiO2 at λ = 532 nm vs angle of deposition. Also shown is the isotropic refractive index from [16] (filled circles).
Figure 3:
The anisotropic refractive index (nonfilled symbols) of porous SiO2 at λ = 532 nm vs angle of depos...
At α < 50°, the depolarization factors are equal, resulting in the isotropic film with the refractive index of pure SiO2. For higher α, the depolarization factors correspond to ellipsoids with major axis along the z axis and the minor axis along the y axis. For example, at α = 86°, Lx = 0.250, Ly = 0.685, and Lz = 0.065 with the error of fit ±0.003. Therefore, the film structure is constituted by SiO2 columns, which are directed along the z axis and have cross-section elongated in the x direction, in agreement with the corresponding FESEM images. The refractive indices decrease, as expected, with α, as the film density decreases, showing always the same relation nz > nx > ny. Birefringence increases with α and reaches values nz − ny = 0.042 and nz − nx = 0.014 at α = 86°. The fitting error is ±0.003 and ±0.01 at high and low α, respectively. The refractive index, n, obtained in the isotropic approach [16] is shown also to be somewhat less than our averaged data (nx+ny+nz)/3 (not shown). Note that Gospodyn et al. [18] reported the anisotropic refractive index to be about 5% less than our data, probably due to less water in the pores.
The SiO2 column tilt is shown in Figure 4 as a function of the deposition angle. We were not able to measure βSiO2 for deposition angles less than 60° because of very low film anisotropy. Greater angles of deposition lead to larger column tilt. The theoretical curves obtained by the "tangent rule" (tan β = 0.5 tan α), the "cosine rule" (β = α − sin−1((1 − cos α)/2)), and experimental data from [15] are shown for comparison. The theoretical curves do not agree with experimental data as they do not account for surface diffusion.
Figure 4:
SiO2 column tilt vs the SiO2 deposition angle. The experimental data from [15] and the curves simulated according to the "tangent rule" [10] and "cosine rule" [11] are shown for comparison.
Figure 4:
SiO2 column tilt vs the SiO2 deposition angle. The experimental data from [15] and the curves simulated...
To the best of our knowledge, the columnar SiO2 structure orientation is measured for the first time by a noninvasive ellipsometry technique, which has evident advantages with respect to SEM imaging which implies film cleaving in plane of particle incidence [15,16].
The LC pretilt is plotted in Figure 5. The fitting error of the βLC data is about 1°. We show for comparison the experimental data from [2], where the same LC was used, and data from [3] for an MLC95-465 (Merck) liquid crystal with Δε = −3.8.
Figure 5:
LC pretilt vs the SiO2 deposition angle. The experimental data from [2] and [3] are shown for comparison.
Figure 5:
LC pretilt vs the SiO2 deposition angle. The experimental data from [2] and [3] are shown for comparison.
According to our data and that reported in [3], pretilt is close to zero at α < 30° and exhibit growth with α at 30° < α < 50°, while the data reported in [2] reveal growth starting from α = 60°.
In the range 50° < α < 75° high discrepancy is observed between the data of different authors, as a transition occurs from "pebble dash-like" structures to columnar structure of SiO2 film [2]. We believe that LC anchoring becomes spatially inhomogeneous, unstable and sensitive to the small changes of film deposition conditions, and LC wetting properties resulting in observed pretilt data spread for different experiments.
LC alignment appears due to the competition of two orienting effects. The first is an effect of the columnar SiO2 relief, which tends to align the LC director along the pore axis [27]. The second is the effect of the averaged plane SiO2 surface tending to homeotropically orient the LC. The result of that competition depends on the relief scale relative to the LC molecule length.
The LC pretilt is somewhat less than βSiO2 at 50° < α < 75° because the surface relief is weakly pronounced. At α > 75°, a well-formed columnar structure dominates LC orientation; however, βLC is somewhat larger than βSiO2 which can be caused by good wettability of the orienting surface by the LC [5].
Conclusion
To summarize, we investigated the anisotropic optical properties of thin SiO2 layers as a function of the deposition angle. The optical properties of columnar SiO2 were modeled by effective media theory and depolarization factors were used to describe birefringence. Birefringence increased with the deposition angle, while refractive indices decreased. It is shown that ellipsometry can obtain the orientation of the SiO2 columns via index ellipsoid measurements. The pretilt of LC molecules aligned by obliquely deposited SiO2 layers was measured and was found to be close to the SiO2 column tilt for deposition angles larger than 75°.
Acknowledgements
This work has been partially supported by ICT COST Action IC1208 "Integrating devices and materials: a challenge for new instrumentation in ICT" and Spanish Government RETOS Program grant no. TEC2013-47342-C2-R. The Contribution of N.B. to this work was supported by the Polish Ministry of Science and Higher Education the Statutory Activity PBS-654 of Military University of Technology.
References
Janning, J. L. Appl. Phys. Lett.1972,21, 173–174. doi:10.1063/1.1654331
Return to citation in text:
[1]
Oton, E.; López-Andrés, S.; Bennis, N.; Otón, J.; Geday, M. Opto-Electron. Rev.2014,22, 92–100. doi:10.2478/s11772-014-0182-2
Return to citation in text:
[1]
[2]
[3]
[4]
[5]
[6]
[7]
[8]
[9]
[10]
[11]
Lu, M.; Yang, K. H.; Nakasogi, T.; Chey, S. J. SID Symp. Dig. Tech. Pap.2000,31, 446–449. doi:10.1889/1.1832977
Return to citation in text:
[1]
[2]
[3]
[4]
[5]
[6]
[7]
[8]
Khakhlou, A.; Murauski, A.; Yaroshchuk, O.; Telesh, E.; Kravchuk, R. J. Soc. Inf. Disp.2006,14, 257–263.
Return to citation in text:
[1]
[2]
[3]
[4]
[5]
Amosova, L. P.; Parfenov, P. S.; Isaev, M. V. J. Opt. Technol.2014,81, 686–691. doi:10.1364/JOT.81.000686
Return to citation in text:
[1]
[2]
[3]
[4]
[5]
Marino, A.; Santamato, E.; Bennis, N.; Quintana, X.; Otón, J. M.; Tkachenko, V.; Abbate, G. Appl. Phys. Lett.2009,94, 013508. doi:10.1063/1.3064131
Return to citation in text:
[1]
[2]
[3]
[4]
[5]
Lyu, J.-J.; Sohn, J.; Kim, H. Y.; Lee, S. H. J. Disp. Technol.2007,3, 404–412. doi:10.1109/JDT.2007.900941
Return to citation in text:
[1]
[2]
Monkade, M.; Boix, M.; Durand, G. Europhys. Lett.1988,5, 697–701. doi:10.1209/0295-5075/5/8/006
Return to citation in text:
[1]
[2]
Smith, D. O.; Cohen, M. S.; Weiss, G. P. J. Appl. Phys.1960,31, 1755–1762. doi:10.1063/1.1735441
Return to citation in text:
[1]
Nieuwenhuizen, J. M.; Haanstra, H. B. Philips Tech. Rev.1966,27, 87–91.
Return to citation in text:
[1]
[2]
Tait, R. N.; Smy, T.; Brett, M. J. Thin Solid Films1993,226, 196–201. doi:10.1016/0040-6090(93)90378-3
Return to citation in text:
[1]
[2]
Tanto, B.; Ten Eyck, G.; Lu, T.-M. J. Appl. Phys.2010,108, 026107. doi:10.1063/1.3465296
Return to citation in text:
[1]
Müller-Pfeiffer, S.; van Kranenburg, H.; Lodder, J. C. Thin Solid Films1992,213, 143–153. doi:10.1016/0040-6090(92)90489-X
Return to citation in text:
[1]
Alvarez, R.; Lopez-Santos, C.; Parra-Barranco, J.; Rico, V.; Barranco, A.; Cotrino, J.; Gonzalez-Elipe, A. R.; Palmero, A. J. Vac. Sci. Technol., B2014,32, 041802. doi:10.1116/1.4882877
Return to citation in text:
[1]
[2]
[3]
[4]
Yang, S.; Zhang, Y. Surf. Interface Anal.2013,45, 1690–1694. doi:10.1002/sia.5308
Return to citation in text:
[1]
[2]
[3]
[4]
[5]
[6]
[7]
Poxson, D. J.; Mont, F. W.; Schubert, M. F.; Kim, J. K.; Schubert, E. F. Appl. Phys. Lett.2008,93, 101914. doi:10.1063/1.2981690
Return to citation in text:
[1]
[2]
[3]
[4]
Hawkeye, M. M.; Taschuk, M. T.; Brett, M. J. Glancing angle deposition of thin films: engineering the nanoscale; Wiley: New York, 2014. doi:10.1002/9781118847510
Return to citation in text:
[1]
[2]
[3]
Tkachenko, V.; Abbate, G.; Marino, A.; Vita, F.; Giocondo, M.; Mazzulla, A.; De Stefano, L. Appl. Phys. Lett.2006,89, 221110. doi:10.1063/1.2397553
Return to citation in text:
[1]
[2]
Marino, A.; Tkachenko, V.; Santamato, E.; Bennis, N.; Quintana, X.; Otón, J. M.; Abbate, G. J. Appl. Phys.2010,107, 073109. doi:10.1063/1.3361512
Return to citation in text:
[1]
[2]
Tkachenko, V.; Marino, A.; Vita, F.; D’Amore, F.; De Stefano, L.; Malinconico, M.; Rippa, M.; Abbate, G. Eur. Phys. J. E2004,14, 185–192. doi:10.1140/epje/i2004-10014-4
Return to citation in text:
[1]
[2]
Bruggeman, D. A. G. Ann. Phys. (Berlin, Ger.)1935,416, 636–664. doi:10.1002/andp.19354160705
Return to citation in text:
[1]
Spanier, J. E.; Herman, I. P. Phys. Rev. B2000,61, 10437–10450. doi:10.1103/PhysRevB.61.10437
Return to citation in text:
[1]
Palik, E. D. Handbook of Optical Constants of Solids; Academic Press: New York, 1985.
Return to citation in text:
[1]
Weiss, S. M.; Ouyang, H.; Zhang, J.; Fauchet, P. M. Opt. Express2005,13, 1090–1097. doi:10.1364/OPEX.13.001090
Return to citation in text:
[1]
Reference 26
26.
Palik, E. D. Handbook of Optical Constants of Solids; Academic Press: New York, 1985.
Hawkeye, M. M.; Taschuk, M. T.; Brett, M. J. Glancing angle deposition of thin films: engineering the nanoscale; Wiley: New York, 2014. doi:10.1002/9781118847510
Hawkeye, M. M.; Taschuk, M. T.; Brett, M. J. Glancing angle deposition of thin films: engineering the nanoscale; Wiley: New York, 2014. doi:10.1002/9781118847510
Hawkeye, M. M.; Taschuk, M. T.; Brett, M. J. Glancing angle deposition of thin films: engineering the nanoscale; Wiley: New York, 2014. doi:10.1002/9781118847510
Marino, A.; Santamato, E.; Bennis, N.; Quintana, X.; Otón, J. M.; Tkachenko, V.; Abbate, G. Appl. Phys. Lett.2009,94, 013508. doi:10.1063/1.3064131
21.
Tkachenko, V.; Abbate, G.; Marino, A.; Vita, F.; Giocondo, M.; Mazzulla, A.; De Stefano, L. Appl. Phys. Lett.2006,89, 221110. doi:10.1063/1.2397553
22.
Marino, A.; Tkachenko, V.; Santamato, E.; Bennis, N.; Quintana, X.; Otón, J. M.; Abbate, G. J. Appl. Phys.2010,107, 073109. doi:10.1063/1.3361512
23.
Tkachenko, V.; Marino, A.; Vita, F.; D’Amore, F.; De Stefano, L.; Malinconico, M.; Rippa, M.; Abbate, G. Eur. Phys. J. E2004,14, 185–192. doi:10.1140/epje/i2004-10014-4
Tkachenko, V.; Marino, A.; Vita, F.; D’Amore, F.; De Stefano, L.; Malinconico, M.; Rippa, M.; Abbate, G. Eur. Phys. J. E2004,14, 185–192. doi:10.1140/epje/i2004-10014-4

![[2190-4286-7-167-i1]](/bjnano/content/inline/2190-4286-7-167-i1.svg?max-width=590&scale=1.18182)
![[Graphic 1]](/bjnano/content/inline/2190-4286-7-167-i3.svg?max-width=637&scale=1.18182)
![[2190-4286-7-167-1]](/bjnano/content/figures/2190-4286-7-167-1.png?scale=2.0&max-width=1024&background=FFFFFF)
![[2190-4286-7-167-i2]](/bjnano/content/inline/2190-4286-7-167-i2.svg?max-width=590&scale=1.18182)
![[2190-4286-7-167-2]](/bjnano/content/figures/2190-4286-7-167-2.png?scale=2.0&max-width=1024&background=FFFFFF)
![[2190-4286-7-167-3]](/bjnano/content/figures/2190-4286-7-167-3.png?scale=2.0&max-width=1024&background=FFFFFF)
![[2190-4286-7-167-4]](/bjnano/content/figures/2190-4286-7-167-4.png?scale=2.0&max-width=1024&background=FFFFFF)
![[2190-4286-7-167-5]](/bjnano/content/figures/2190-4286-7-167-5.png?scale=2.0&max-width=1024&background=FFFFFF)