Abstract
The investigation of liquid crystal (LC) mixtures is of great interest in tailoring material properties for specific applications. The recent discovery of the twist-bend nematic phase (NTB) has sparked great interest in the scientific community, not only from a fundamental viewpoint, but also due to its potential for innovative applications. Here we report on the unexpected phase behaviour of a binary mixture of twist-bend nematogens. A binary phase diagram for mixtures of imino-linked cyanobiphenyl (CBI) dimer and imino-linked benzoyloxy-benzylidene (BB) dimer shows two distinct domains. While mixtures containing less than 35 mol % of BB possess a wide temperature range twist-bend nematic phase, the mixtures containing 55–80 mol % of BB exhibit a smectic phase despite that both pure compounds display a Iso–N–NTB–Cr phase sequence. The phase diagram shows that the addition of BB of up to 30 mol % significantly extends the temperature range of the NTB phase, maintaining the temperature range of the nematic phase. The periodicity, obtained by atomic force microscopy (AFM) imaging, is in the range of 6–7 nm. The induction of the smectic phase in the mixtures containing 55–80 mol % of BB was confirmed using polarising optical microscopy (POM), differential scanning calorimetry (DSC) and X-ray diffraction. The origin of the intercalated smectic phase was unravelled by combined spectroscopic and computational methods and can be traced to conformational disorder of the terminal chains. These results show the importance of understanding the phase behaviour of binary mixtures, not only in targeting a wide temperature range but also in controlling the self-organizing processes.
Introduction
Nowadays liquid crystal (LC) substances possess a wide range of uses. However, it is rather rare that a single organic compound has the desired properties for a particular application. Since the discovery that mixtures of nematic compounds could yield room-temperature nematic liquid crystals [1], the mixing of LC compounds became a very useful technique. Thus, investigation of LC mixtures is of great interest in targeting a wide operating temperature range or tailoring material properties for specific applications.
The recent discovery of the twist-bend nematic phase (NTB) [2,3] has sparked a great interest in the scientific community, not only from the fundamental viewpoint but also due to its potential for innovative applications. Even before this new nematic phase was described as a twist-bend nematic phase, the mixtures of LC compounds exhibiting it were prepared and investigated. The aim of those studies was to further explore this unknown nematic phase [4-6] or to confirm which new dimers exhibit this phase [7-9]. Consequently, investigations of mixtures containing twist-bend nematogens became of great interest since the NTB phase can be induced and stabilized by the addition of a methylene-linked dimer possessing this phase to an ether-linked dimer which does not exhibit a NTB phase [10-12].
Apart from shifting the phase transition temperatures in the mixtures of two LC compounds, the formation of a new mesophase is also an interesting phenomenon. The first induced mesophase was discovered in binary rod-like nematic liquid crystal mixtures of N-(p-methoxybenzylidene)-p-n-butylaniline (MBBA) with 4-cyano-4’-pentylbiphenyl (5CB) [13]. It has been associated with the formation of charge transfer (CT) complexes between strong donor and acceptor compounds. However, the induction of a smectic phase may also be the result of weak CT interactions, together with other effects such as dipole–dipole interactions, dipole-induced dipole interactions, and excluded volume effects [14,15].
In this study, we report on the unusual behaviour of a binary mixture between two twist-bend nematogens. Previously we reported on the mesomorphic behaviour of various imino-linked dimers that displayed both uniaxial nematic (N) and twist-bend nematic phases (NTB) [16,17]. Continuing our investigation on these systems, we performed a study on how mixing two imino-linked bent-shaped dimers with a rather large difference in molecular length affects their mesomorphic properties. For the purpose of this study, we prepared an imino-linked cyanobiphenyl dimer (CBI) and an imino-linked benzoyloxy-benzylidene dimer (BB) having molecular lengths (in the most extended form) of 3.9 nm and 4.8 nm, respectively. The molecular structures of these compounds are presented in Figure 1. For both compounds, the Iso–N–NTB phase sequence have been reported [16,18]. Although both pure constituents display only the nematic phases, the mixtures enriched with BB show an additional intercalated smectic phase. To our knowledge, this is the first case of an induced smectic phase in the mixture of two nematogens that exhibit the NTB phase. Various spectroscopic techniques and molecular dynamic calculations were used in an attempt to determine the interactions responsible for the induction of the smectic phase. Atomic force microscopy (AFM) measurements performed on the mixtures enriched with CBI showed that the distance between modulations in NTB phase is extremely short, just about 6–7 nm.
![[2190-4286-9-122-1]](/bjnano/content/figures/2190-4286-9-122-1.svg?scale=2.0&max-width=1024&background=FFFFFF)
Figure 1: Molecular structures of cyanobiphenyl dimer (CBI) and benzoyloxy-benzylidene dimer (BB).
Figure 1: Molecular structures of cyanobiphenyl dimer (CBI) and benzoyloxy-benzylidene dimer (BB).
Results and Discussion
Mesogenic properties of the pure compounds CBI and BB are presented in Table 1. The transition temperatures are determined by differential scanning calorimetry (DSC) and correspond to the data reported previously [16,18]. The N–NTB phase transition has been confirmed observing characteristic blocky texture from which polygon and rope textures developed. The X-ray diffraction (XRD) measurements in both nematic phases show that the d value for the maxima of the inner scattering in the nematic phase is at about 1.4 nm for CBI and at about 2.2 nm for BB, which is less than the half the molecular lengths.
Table 1: The phase behaviour and molecular length, L, obtained at the B3LYP/6-31G level of density functional theory (DFT). The phase transition temperature (°C) and ΔS/R (given in brackets, dimensionless quantity) are summarized.
| Dimer | L (nm) | ||||||
|---|---|---|---|---|---|---|---|
| CBI | Cr | 117 [10.54] | NTB 123 [0.01] | N | 149 [0.14] | Iso | 3.9 |
| BBa | Cr | 97 [6.86] | (NTB 95) [0.12] | N | 117 [0.19] | Iso | 4.8 |
aCr–Cr transitions at 86 °C [6.02] and at 91 °C [1.83]; value in parenthesis is the monotropic phase transition.
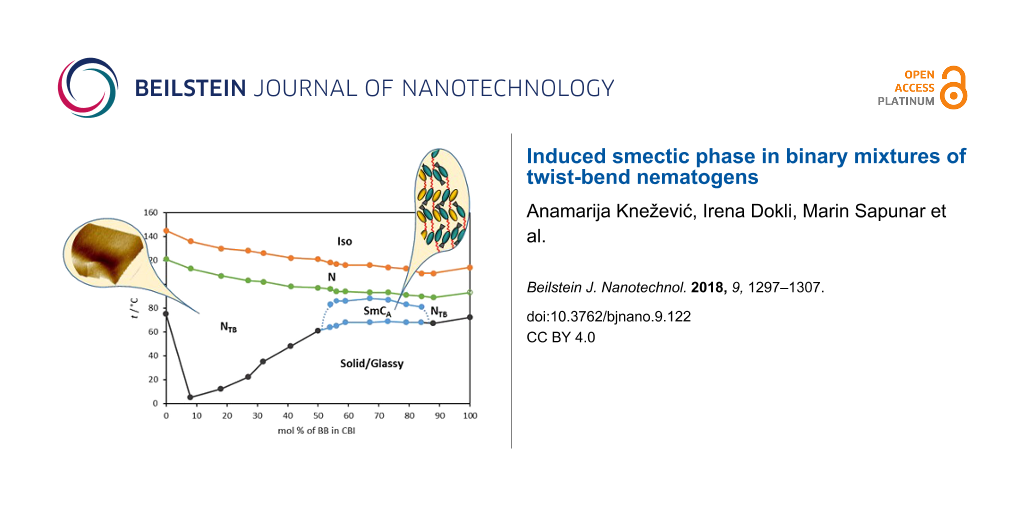
The phase behaviour of binary mixtures of CBI and BB is characterized as a function of mol percent of BB and shown in Figure 2. To obtain the values under comparable conditions, the transition temperatures of the pure compounds and their mixtures were taken from the second DSC cooling run. This resulted in a slight lowering of the transition temperatures for the pure compounds comparable to the data obtained during the heating cycle (Table 1). The nature of the phase in various mixtures was identified by its characteristic texture. As can be seen in Figure 2, upon addition of BB to CBI, the Iso–N, as well as the N–NTB transition temperatures, decrease linearly with increasing BB content. In terms of a molecular field theory developed to predict phase diagrams for binary mixtures of nematics [19], this suggests that the anisotropic intermolecular energy parameter between the unlike species is the geometric mean of the anisotropic interaction parameters between the like species. The linearity of both transition temperatures was also observed in the mixtures of methylene and ether-linked dimers and used for determination of the virtual nematic to NTB transition temperatures of the later [20].
![[2190-4286-9-122-2]](/bjnano/content/figures/2190-4286-9-122-2.png?scale=2.0&max-width=1024&background=FFFFFF)
Figure 2: Phase diagram for binary mixture of CBI and BB.
Figure 2: Phase diagram for binary mixture of CBI and BB.
For the crystallization points, two trends are detectable. Upon addition of 8 mol % of BB to CBI, the transition to the solid phase decreases to 3 °C, compared to 75 °C of the pure CBI. Increasing the concentration of BB further up to 50 mol % causes a rather steep temperature increase up to 60 °C. In the range of 56 < mol % BB < 88 crystallization temperatures remain approximately the same at about 68 °C.
Considering the phase behaviour of the pure compounds, the expected Iso–N–NTB phase sequence was observed across the full composition range between CBI and BB, however the most surprising was detection of the smectic phase for the mixtures containing 55–80 mol % of BB. Thus the phase diagram of the binary BB–CBI mixture can be envisaged as two distinct puzzling domains, one enriched with CBI and the other enriched with BB.
On cooling from the isotropic liquid, mixtures containing less than 50 mol % of BB show the nematic and the NTB phase identified by marble (Figure 3a) and polygonal texture (Figure 3b), respectively. Further cooling resulted in increased viscosity and vitrification with no change in texture.
![[2190-4286-9-122-3]](/bjnano/content/figures/2190-4286-9-122-3.jpg?scale=2.0&max-width=1024&background=FFFFFF)
Figure 3: a) Marble texture of the nematic phase (magnification 200×); b) polygonal texture of the NTB phase of 18 mol % BB mixture at 92 °C (magnification 500×), c) 2D XRD pattern in the N phase at 120 °C, d) 2D XRD pattern in the NTB phase at 55 °C.
Figure 3: a) Marble texture of the nematic phase (magnification 200×); b) polygonal texture of the NTB phase ...
The assignment of the NTB phase was further supported by small-angle X-ray diffraction studies on the mixture containing 18 mol % BB as shown in Figure 3. X-ray diffraction measurements of the sample were performed under a magnetic field of 1 T upon cooling (1 K/min) from the isotropic liquid. A typical diffuse small-angle scattering pattern was obtained for the nematic phase (Figure 3c). The pattern of the NTB phase differs from that of the N phase mainly by a certain loss of orientation (Figure 3d and Figure S1, Supporting Information File 1 for additional data) as frequently found at the N–NTB transition [2,17,21]. The inner scattering is too weak to find the maximum but can be estimated to be near that of the N phase, which has its maxima at about 1.8 nm for the d value.
It has been reported that freeze fracture TEM [22-25] and AFM [26,27] measurements of the NTB phase show periodic features that can be related to a nanometer-scale pitch. Up to 40 mol % of BB large suppression of crystallization resulted in a wide temperature range of the NTB phase. This enabled direct comparison of the surface morphology and periodicity modulations between several mixtures of different concentration of BB by atomic force microscope (AFM). Three mixtures containing 8, 18 and 27 mol % BB were investigated by AFM at 55 °C. For all three mixtures, the presence of the NTB phase at 55 °C, was confirmed by characteristic texture measurements and additionally verified by the XRD measurement performed on the mixture containing 18 mol % of BB.
AFM imaging revealed very similar surface morphology for all three mixtures. The representative AFM images obtained on the mixture containing 27 mol % BB at 55 °C are shown in Figure 4.
![[2190-4286-9-122-4]](/bjnano/content/figures/2190-4286-9-122-4.png?scale=2.0&max-width=1024&background=FFFFFF)
Figure 4: a) AFM 2D-topographic image of the surface morphology of a binary mixture of 27 mol % BB; b) the inset shows a high-resolution AFM image of the marked region in a); c) 3D-topographic image; d) vertical section profile across the noted line; e) histogram of the fingerprint modulation distance.
Figure 4: a) AFM 2D-topographic image of the surface morphology of a binary mixture of 27 mol % BB; b) the in...
In the NTB phase, at 55 °C, a relatively smooth surface over 1 × 1 µm2 followed by the semi-circular shape as a part of toric domains was observed (Figure 4a). The boundaries of domains are characterized by the slight decrease in the surface height followed by the slight increase in height (Figure 4c). Within observed domains, a well-oriented periodic pattern appeared (Figure 4b). The distance between the fingerprint modulations determined by the cross-section analysis revealed that all three mixtures possess approximately the same periodicity amounting to 6.4 ± 1.7 nm (Figure 4d). The corresponding histogram of the distance between the fingerprint modulations is shown on the Figure 4e.
Most recently Clark’s group indicated that the helix pitch (pH) of CB7CB experimentally measured by resonant soft X-ray scattering (RSoXS) appears to be controlled by the molecular bend and can be approximated with 2πRmol of a single all-trans molecule near the N–NTB phase transition [24]. For the CB7CB molecule, Rmol was determined to be 1.58 nm which gives pHlim ≈ 9.8 nm. Also, it was demonstrated that a small concentration of 5CB in the CB7CB–5CB mixtures has a negligible effect on the pitch. Compared to CB7CB, the CBI molecule is longer by two additional imino linkage groups. Investigation of the conformational distribution of the achiral symmetric dimers in the nematic and NTB phases revealed high probability of more elongated conformations in the liquid crystalline phases [28-30]. Similar to CB7CB, the most elongated conformer of CBI is the one possessing alkyl spacer in all-trans conformation. The determined Rmol for CBI is higher than for CB7CB and equals 1.95 nm (Figure 5). Consequently, the predicted pitch is approximately 12.2 nm. The periodicity we obtained by AFM is in the range of 6–7 nm, which is approximatively half of the predicted pitch value. Considering the duplex helical tiled chain (DHTC) model proposed by Clark’s group [24], periodicity observed by AFM may be interpreted as biaxiality pitch caused by variations of the steric shape along the duplex chain.
![[2190-4286-9-122-5]](/bjnano/content/figures/2190-4286-9-122-5.png?scale=2.0&max-width=1024&background=FFFFFF)
Figure 5: Molecular curvature of CBI obtained by a least squares fit of a circle to the geometry of the molecule.
Figure 5: Molecular curvature of CBI obtained by a least squares fit of a circle to the geometry of the molec...
Upon increasing the concentration of BB, the phase sequence changed. The mixtures containing 55–80 mol % of BB along with N–NTB phase transition also show NTB–Sm phase transition. Upon cooling from the nematic phase, a blocky texture (Figure 6a) of the narrow NTB phase appears, followed by a fan-shaped texture (Figure 6b) of the smectic phase. Shearing the sample led to a schlieren-like texture with singularities of S = ±1 and ±1/2 (Figure 6c) which have also been observed in anticlinic smectic C (SmCA) of a limited number of dimers displaying the same phase sequence [3,31-33]. The occurrence of such singularities is attributed to an opposite tilt direction of the mesogenic groups between adjacent layers [34]. The induction of the smectic phase was confirmed by the presence of an additional peak in the DSC trace and by X-ray diffraction analysis performed on the mixture containing 73 mol % of BB. The diffraction pattern obtained in magnetic field of 1 T upon cooling at 73 °C shows a broad diffuse outer scattering and a sharp layer reflection at d = 2.05 nm, the maxima of the inner and outer scattering remain on the meridian and the equator, respectively, but with a comparatively broad azimuthal distribution of the intensity (Figure 6d and Figure S2, Supporting Information File 1). This is in line with an intercalated smectic C phase. Given that the mesophase exhibits a schlieren texture with both 2- and 4-brush defects it is concluded that the phase is an anticlinic smectic C (SmCA) type. The induced smectic phase is most stable in the mixture containing roughly 70 mol % of BB. This corresponds to the ratio of two molecules of BB versus one molecule of CBI in the smectic phase. The entropy changes (ΔS/R) determined from the DSC thermograms (Table S1, Supporting Information File 1) for the NTB to SmCA transition exhibit the maximum around 70 mol % of BB which correspond to the highest NTB to SmCA transition temperature. It is also significantly larger than for the N–NTB transition (0.56 versus 0.09) points that NTB to SmCA transition is first order.
![[2190-4286-9-122-6]](/bjnano/content/figures/2190-4286-9-122-6.png?scale=2.0&max-width=1024&background=FFFFFF)
Figure 6: Texture of the mixture containing 73 mol % BB: a) blocky texture of NTB phase at 93 °C, b) fan-shaped texture of the smectic phase at 82 °C, c) schlieren texture after shearing the sample at 82 °C, d) 2D XRD patterns for a sample of 73 mol % BB mixture aligned in the magnetic field obtained on cooling from the isotropic liquid at 73 °C.
Figure 6: Texture of the mixture containing 73 mol % BB: a) blocky texture of NTB phase at 93 °C, b) fan-shap...
The induced smectic phase can be compared with intercalated smectic phases observed for non-symmetric dimers. On entropic grounds, the intercalated arrangement in which there is a random mixing of the two different types of mesogenic units is favourable. The driving force for the formation of this phase was attributed to a specific interaction between the unlike mesogenic units [35,36].
In an attempt to determine the interactions responsible for induction of smectic phase UV, and IR measurements were performed on pure compounds and 73 mol % BB mixture. UV measurements were performed at room temperature in ethanol. Comparison of the UV spectra of the mixtures (18 mol % BB, 50 mol % BB, 67 mol % BB) with those of pure compounds shows no new absorption band (Figure S3, Supporting Information File 1). The peak at 290 nm present in pure CBI shifts toward lower wavelengths as the ratio of BB in the mixture rises, approaching the value of 266 nm characteristic of pure BB.
Since FTIR spectroscopy is a sensitive technique for determining changes in chemical interactions and molecular geometry in LC phases [37-40], we investigated the 73 mol % BB mixture using temperature-dependent FTIR measurements. IR spectra were recorded using a KBr pastille method. Since in a binary mixture the cyano group of CBI may be involved in interaction with BB in the mixture, we focused our attention on the IR band related to the stretching of the C≡N bond. Comparison of the spectra of pure compounds and 73 mol % BB mixture at room temperature reveals that shift of C≡N stretching vibration is negligible (Figure 7). The observed difference is a band shift of 816 cm−1 for pure CBI to 822 cm−1 for the 73 mol % BB mixture. This band corresponds to the out-of-plane bending of the aromatic ring. Also, the difference in the spectra of pure BB and 73 mol % BB mixture is a shift of band at 1080 cm−1 for pure BB to 1072 cm−1 for mixtures and a significant decrease of the band at 1286 cm−1 compared to pure BB. These bands correspond to stretching vibrations of C–O–C bonds. Similar results were obtained after the analysis of the 73 mol % mixture spectra recorded during the cooling cycle from isotropic phase (Figure S4, Supporting Information File 1) and temperature-dependent spectra of pure BB (Figure S5, Supporting Information File 1).
![[2190-4286-9-122-7]](/bjnano/content/figures/2190-4286-9-122-7.png?scale=2.0&max-width=1024&background=FFFFFF)
Figure 7: IR spectra of pure BB (red), pure CBI (green) and a 73 mol % BB mixture (blue) at room temperature.
Figure 7: IR spectra of pure BB (red), pure CBI (green) and a 73 mol % BB mixture (blue) at room temperature.
The absence of new absorption bands in the wide spectral range in the mixture, compared to the spectra of the pure compounds, implicates that CT attraction or even dipole-induced dipole interaction is not particularly strong. In the absence of electronic arguments, we envisaged other intermolecular interactions that might promote smectic arrangement.
Further analysis of the spectra of the mixture show that the bands of the symmetric and asymmetric stretching vibrations of CH2 units (νs(C−H)CH2 and νas(C−H)CH2) at 2924 cm−1 and 2850 cm−1 are shifted to 2930 cm−1 and 2854 cm−1 upon heating and restore to their values upon cooling (Figure 8a). The change occurs at the transition from crystal to smectic phase and the values remain the same in LC and isotropic phases. This well-known shift in the IR spectra of liquid crystals is a consequence of disordering of chain packing and the introduction of gauche conformers on the alkyl chains which leads to their more liquid-like state [38,41-43]. This change is most evident at the crystal–smectic transition since in the solid state the chains are considered to be mostly trans-planar [44]. The increase in hydrocarbon chain conformational disorder has also been intensively studied by FTIR on phospholipid bilayers and is used for monitoring of lipid hydrocarbon chain melting phase transitions [39,45-47]. The temperature dependent IR spectra of pure BB (Figure 8b) follow the same trend as the spectra of 73 mol % mixture. The bands of CH2 vibrations shift toward higher frequencies. The spectra of CBI show different characteristics (Figure 8c). There is no shift of corresponding bands upon heating and only the bandwidth increases, which is in accordance with the increase of the motional rate of the molecule [37,39,41]. Considering the chemical structure of both pure compounds, it is reasonable to assume that shifting of CH2 vibrations rises from conformational disorder of terminal chains present only in the structure of BB.
![[2190-4286-9-122-8]](/bjnano/content/figures/2190-4286-9-122-8.png?scale=2.1&max-width=1024&background=FFFFFF)
Figure 8: IR spectra in the CH2 stretching bands region of: a) 73 mol % mixture – 50 °C (green), 75 °C (blue), 90 °C (cyan), 100 °C (red), 125 °C (black), b) pure BB – 25 °C (green), 95 °C (black), 125 °C (red), c) pure CBI – 25 °C (green), 130 °C (black), 150 °C (red).
Figure 8: IR spectra in the CH2 stretching bands region of: a) 73 mol % mixture – 50 °C (green), 75 °C (blue)...
In order to investigate how conformational disorder of terminal chains might affect induction of the smectic phase we performed a molecular dynamics simulation of BB at 80 K with a time step of 1 fs for a total duration of 10 ps using the Turbomole program package [48] at the PBE/def2-TZVP level of theory using the RI approximation [49]. The dynamics were performed in the molecular frame, the centre of mass of the molecule was kept at the origin of the coordinate system and the molecule was rotated to satisfy the Eckart conditions. The geometry of the entire molecule was varied during the simulation, and discrete conformers were sampled every 0.2 ps from the dynamics. The sampled geometries are shown in Figure 9a. The snapshots are aligned to maximize the overlap of the benzene ring of each geometry. In this way, the motion of the alkyl chain during the dynamics can be seen clearly. Both the all-trans conformer and various gauche conformers are present among the geometries, indicating that the transition between the conformers occurs freely at 80 K. In a crystal, steric effects favour the all-trans conformation where the chains occupy the lowest volume (Figure 9b). As the temperature increases, the probability for the gauche conformation in the chain also increases, which leads to a shortening of the chains but an increase in the volume they occupy by ≈10–15% (Figure 9c).
![[2190-4286-9-122-9]](/bjnano/content/figures/2190-4286-9-122-9.png?scale=2.0&max-width=1024&background=FFFFFF)
Figure 9: a) Free rotation of the C–C bonds of the alkyl chains in the gas phase molecular dynamics. Snapshots were taken every 0.2 ps from a 10 ps molecular dynamics simulation at 80 K. To illustrate the motion of the alkyl chain separately from the motion of the remainder of the molecule, the snapshots are shown with the benzene ring of each geometry aligned, and only the alkyl chain and benzene ring are shown. b) All-trans conformation and c) single gauche conformations of the alkyl chain of BB. The volume excluded by the alkyl chains is marked by the blue cylinders.
Figure 9: a) Free rotation of the C–C bonds of the alkyl chains in the gas phase molecular dynamics. Snapshot...
Generally, the intercalated structures are typical for non-symmetric dimers [50]. The driving force for the formation of this phase was attributed to a specific interaction between the unlike mesogenic units [34-36]. In binary mixtures, enhanced or induced smectic behaviour is most often associated with a concurrent upward curvature of the TN-I line, and such behaviour is normally associated with a specific interaction between the unlike mesogenic groups [34]. For the BB–CBI mixtures both the Iso–N and the N–NTB transition temperatures change linearly. Furthermore, the phase diagram of the binary mixtures of CB9CB and the benzyloxyphenyl-based dimer display only nematic phases, which is in accordance with the behaviour of pure compounds [51]. This data combined with the temperature-dependent FTIR measurements suggest that a specific interaction between the different mesogenic groups is not particularly strong. According to the phase diagram, the induced smectic phase is most stable in the mixture containing roughly 70 mol % of BB and we focused our attention on how can smaller CBI molecule facilitate the intercalated smectic phase of symmetric BB.
It is well known that within the intercalated smectic phase dimeric molecules are arranged in the way in which terminal chains and the spacers are mixed randomly and the layer spacing is approximately half the molecular length [50]. As evidenced from the temperature-dependent FTIR measurements, part of the terminal chains adopt a gauche conformation and become shorter. Placing the molecules of BB in the hypothetical intercalated smectic-like arrangement generates void space near the spacer (Figure 10a). Since void space in molecular packing is unacceptable for condensed mesophase formation [52,53] it is reasonable to expect destabilization of the SmCA phase. Indeed, only the Iso–N–NTB phase sequence was observed for the pure BB. In the BB–CBI mixtures, introduction of smaller CBI molecules facilitate the space filling and stabilize packing within the smectic phase (Figure 10b). Thus, induction of the intercalated smectic phase in the BB–CBI mixtures enriched with BB can be attributed to the minimization of the free volume, although synergy with the weak electrostatic quadrupolar interaction between these particular mesogenic groups cannot be excluded.
![[2190-4286-9-122-10]](/bjnano/content/figures/2190-4286-9-122-10.png?scale=2.0&max-width=1024&background=FFFFFF)
Figure 10: a) A sketch of the hypothetical intercalated smectic-like organization of pure BB, where d denotes layer spacing. b) A sketch of intercalated smectic phase of a BB–CBI mixture comprising the ratio of two molecules of BB versus one molecule of CBI (blue square).
Figure 10: a) A sketch of the hypothetical intercalated smectic-like organization of pure BB, where d denotes ...
Conclusion
Here we report on the unexpected phase behaviour of a binary mixture of twist-bend nematogens. The phase diagram of the binary BB–CBI mixtures shows two distinct and very puzzling domains. While mixtures containing less than 35 mol % of BB possess a wide temperature range twist-bend nematic phase, the mixtures containing 55–80 mol % of BB exhibit a smectic phase despite that both pure compounds display a Iso–N–NTB–Cr phase sequence. The phase diagram shows that introduction of a significantly longer molecule suppresses crystallization, yielding a wide temperature range of the NTB phase and maintaining the temperature range of the nematic phase. For the mixtures containing up to 30 mol % of BB, AFM surface analysis revealed approximately the same periodicity of 6–7 nm. This demonstrates the utility of making mixtures to obtain a wide temperature range NTB phase. An increase in the concentration of BB resulted in the formation of the intercalated smectic phase. The induction of a smectic phase was confirmed using polarising optical microscopy (POM), differential scanning calorimetry (DSC) and X-ray diffraction. The temperature-dependent FTIR measurements revealed that the origin of the intercalated smectic is likely to be a conformational disorder of terminal chains instead of a charge transfer (CT) complex or dipole-induced dipole interaction. Comparison of the packing models of pure BB and CBI–BB mixtures enriched with BB strongly suggests that the SmCA phase formation is driven by minimization of the free volume, although synergy with the weak electrostatic quadrupolar interaction between these particular mesogenic groups cannot be excluded. The above-presented results show that mixing two twist-bend nematogens not only results in the extended temperature range of the NTB phase but also a phase sequence can be changed. Thus, targeting a wide operating temperature range or controlling the self-organizing processes makes understanding the phase behaviour of binary mixtures very important.
Supporting Information
| Supporting Information File 1:
Additional experimental and spectroscopic information.
General information; phase transition temperatures for the mixtures of BB and CBI; UV spectra of pure BB and CBI and selected mixtures in ethanol; IR spectra of 73 mol % mixture in the region 1300–900 cm−1 at various temperatures; IR spectra of pure BB in the region 1800–1000 cm−1 at various temperatures. |
||
| Format: PDF | Size: 638.5 KB | Download |
References
-
Goldmacher, J. E.; Castellano, J. A. U.S. Patent 3,540,796, Nov 1970.
Return to citation in text: [1] -
Cestari, M.; Diez-Berart, S.; Dunmur, D. A.; Ferrarini, A.; de La Fuente, M. R.; Jackson, D. J. B.; Lopez, D. O.; Luckhurst, G. R.; Perez-Jubindo, M. A.; Richardson, R. M.; Salud, J.; Timimi, B. A.; Zimmermann, H. Phys. Rev. E 2011, 84, 31704. doi:10.1103/PhysRevE.84.031704
Return to citation in text: [1] [2] -
Šepelj, M.; Lesac, A.; Baumeister, U.; Diele, S.; Nguyen, H. L.; Bruce, D. W. J. Mater. Chem. 2007, 17, 1154–1165. doi:10.1039/B612517D
Return to citation in text: [1] [2] -
Tripathi, C. S. P.; Losada-Pérez, P.; Glorieux, C.; Kohlmeier, A.; Tamba, M.-G.; Mehl, G. H.; Leys, J. Phys. Rev. E 2011, 84, 041707. doi:10.1103/PhysRevE.84.041707
Return to citation in text: [1] -
Parthasarathi, S.; Rao, D. S. S.; Palakurthy, N. B.; Yelamaggad, C. V.; Krishna Prasad, S. J. Phys. Chem. B 2016, 120, 5056–5062. doi:10.1021/acs.jpcb.6b03048
Return to citation in text: [1] -
Paterson, D. A.; Abberley, J. P.; Harrison, W. T. A.; Storey, J. M. D.; Imrie, C. T. Liq. Cryst. 2017, 44, 127–146. doi:10.1080/02678292.2016.1274293
Return to citation in text: [1] -
Henderson, P. A.; Imrie, C. T. Liq. Cryst. 2011, 38, 1407–1414. doi:10.1080/02678292.2011.624368
Return to citation in text: [1] -
Dawood, A. A.; Grossel, M. C.; Luckhurst, G. R.; Richardson, R. M.; Timimi, B. A.; Wells, N. J.; Yousif, Y. Z. Liq. Cryst. 2016, 43, 2–12. doi:10.1080/02678292.2015.1114158
Return to citation in text: [1] -
Archbold, C. T.; Davis, E. J.; Mandle, R. J.; Cowling, S. J.; Goodby, J. W. Soft Matter 2015, 11, 7547–7557. doi:10.1039/C5SM01935D
Return to citation in text: [1] -
Adlem, K.; Čopič, M.; Luckhurst, G. R.; Mertelj, A.; Parri, O.; Richardson, R. M.; Snow, B. D.; Timimi, B. A.; Tuffin, R. P.; Wilkes, D. Phys. Rev. E 2013, 88, 022503. doi:10.1103/PhysRevE.88.022503
Return to citation in text: [1] -
López, D. O.; Robles-Hernández, B.; Salud, J.; de la Fuente, M. R.; Sebastián, N.; Diez-Berart, S.; Jaen, X.; Dunmur, D. A.; Luckhurst, G. R. Phys. Chem. Chem. Phys. 2016, 18, 4394–4404. doi:10.1039/C5CP07605F
Return to citation in text: [1] -
Ramou, E.; Ahmed, Z.; Welch, C.; Karahaliou, P. K.; Mehl, G. H. Soft Matter 2016, 12, 888–899. doi:10.1039/C5SM01961C
Return to citation in text: [1] -
Park, J. W.; Bak, C. S.; Labes, M. M. J. Am. Chem. Soc. 1975, 97, 4398–4400. doi:10.1021/ja00848a045
Return to citation in text: [1] -
Sugisawa, S.-y.; Tabe, Y. Soft Matter 2016, 12, 3103–3109. doi:10.1039/C6SM00038J
Return to citation in text: [1] -
Szabon, J.; Diele, S. Cryst. Res. Technol. 1982, 17, 1315–1320. doi:10.1002/crat.2170171027
Return to citation in text: [1] -
Ivšić, T.; Vinković, M.; Baumeister, U.; Mikleušević, A.; Lesac, A. RSC Adv. 2016, 6, 5000–5007. doi:10.1039/C5RA26078G
Return to citation in text: [1] [2] [3] -
Ivšić, T.; Baumeister, U.; Dokli, I.; Mikleušević, A.; Lesac, A. Liq. Cryst. 2017, 44, 93–105. doi:10.1080/02678292.2016.1225832
Return to citation in text: [1] [2] -
Dawood, A. A.; Grossel, M. C.; Luckhurst, G. R.; Richardson, R. M.; Timimi, B. A.; Wells, N. J.; Yousif, Y. Z. Liq. Cryst. 2017, 44, 106–126.
Return to citation in text: [1] [2] -
Humphries, R. L.; James, P. G.; Luckhurst, G. R. Symp. Faraday Soc. 1971, 5, 107–118. doi:10.1039/sf9710500107
Return to citation in text: [1] -
Mandle, R. J.; Goodby, J. W. Chem. – Eur. J. 2016, 22, 9366–9374. doi:10.1002/chem.201601146
Return to citation in text: [1] -
Mandle, R. J. Soft Matter 2016, 12, 7883–7901. doi:10.1039/C6SM01772J
Return to citation in text: [1] -
Chen, D.; Nakata, M.; Shao, R.; Tuchband, M. R.; Shuai, M.; Baumeister, U.; Weissflog, W.; Walba, D. M.; Glaser, M. A.; Maclennan, J. E.; Clark, N. A. Phys. Rev. E 2014, 89, 22506. doi:10.1103/PhysRevE.89.022506
Return to citation in text: [1] -
Borshch, V.; Kim, Y.-K.; Xiang, J.; Gao, M.; Jákli, A.; Panov, V. P.; Vij, J. K.; Imrie, C. T.; Tamba, M. G.; Mehl, G. H.; Lavrentovich, O. D. Nat. Commun. 2013, 4, 2635. doi:10.1038/ncomms3635
Return to citation in text: [1] -
Tuchband, M. R.; Shuai, M.; Graber, K. A.; Chen, D.; Zhu, C.; Radzihovsky, L.; Klittnick, A.; Foley, L. M.; Scarbrough, A.; Porada, J. H.; Moran, M.; Yelk, J.; Bedrov, D.; Korblova, E.; Walba, D. M.; Hexemer, A.; Maclennan, J. E.; Glaser, M. A.; Clark, N. A. arXiv [cond-mat.soft] 2017, No. 1703.10787.
Return to citation in text: [1] [2] [3] -
Tuchband, M. R.; Shuai, M.; Graber, K. A.; Chen, D.; Radzihovsky, L.; Klittnick, A.; Foley, L.; Scarbrough, A.; Porada, J. H.; Moran, M.; Korblova, E.; Walba, D. M.; Glaser, M. A.; Maclennan, J. E.; Clark, N. A. arXiv [cond-mat.soft] 2015, No. 1511.07523.
Return to citation in text: [1] -
Gorecka, E.; Salamonczyk, M.; Zep, A.; Pociecha, D.; Welch, C.; Ahmed, Z.; Mehl, G. H. Liq. Cryst. 2015, 42, 1–7. doi:10.1080/02678292.2014.984646
Return to citation in text: [1] -
Gorecka, E.; Vaupotič, N.; Zep, A.; Pociecha, D.; Yoshioka, J.; Yamamoto, J.; Takezoe, H. Angew. Chem., Int. Ed. 2015, 54, 10155–10159. doi:10.1002/anie.201502440
Return to citation in text: [1] -
Emsley, J. W.; Lelli, M.; Lesage, A.; Luckhurst, G. R. J. Phys. Chem. B 2013, 117, 6547–6557. doi:10.1021/jp4001219
Return to citation in text: [1] -
Paterson, D. A.; Gao, M.; Kim, Y.-K.; Jamali, A.; Finley, K. L.; Robles-Hernández, B.; Diez-Berart, S.; Salud, J.; de la Fuente, M. R.; Timimi, B. A.; Zimmermann, H.; Greco, C.; Ferrarini, A.; Storey, J. M. D.; López, D. O.; Lavrentovich, O. D.; Luckhurst, G. R.; Imrie, C. T. Soft Matter 2016, 12, 6827–6840. doi:10.1039/C6SM00537C
Return to citation in text: [1] -
Sebastián, N.; Robles-Hernández, B.; Diez-Berart, S.; Salud, J.; Luckhurst, G. R.; Dunmur, D. A.; López, D. O.; de la Fuente, M. R. Liq. Cryst. 2017, 44, 177–190. doi:10.1080/02678292.2016.1218963
Return to citation in text: [1] -
Mandle, R. J.; Davis, E. J.; Archbold, C. T.; Voll, C. C.; Andrews, J. L.; Cowling, S. J.; Goodby, J. W. Chem. – Eur. J. 2015, 21, 8158–8167. doi:10.1002/chem.201500423
Return to citation in text: [1] -
Mandle, R. J.; Goodby, J. W. Soft Matter 2016, 12, 1436–1443. doi:10.1039/C5SM02720A
Return to citation in text: [1] -
Tamba, M. G.; Salili, S. M.; Zhang, C.; Jákli, A.; Mehl, G. H.; Stannarius, R.; Eremin, A. RSC Adv. 2015, 5, 11207–11211. doi:10.1039/C4RA14669G
Return to citation in text: [1] -
Attard, G. S.; Date, R. W.; Imrie, C. T.; Luckhurst, G. R.; Roskilly, S. J.; Seddon, J. M.; Taylor, L. Liq. Cryst. 1994, 16, 529–581. doi:10.1080/02678299408036531
Return to citation in text: [1] [2] [3] -
Imrie, C. T. Liq. Cryst. 2006, 33, 1449–1485. doi:10.1080/02678290601140498
Return to citation in text: [1] [2] -
Yeap, G.-Y.; Hng, T.-C.; Yeap, S.-Y.; Gorecka, E.; Ito, M. M.; Ueno, K.; Okamoto, M.; Mahmood, W. A. K.; Imrie, C. T. Liq. Cryst. 2009, 36, 1431–1441. doi:10.1080/02678290903271504
Return to citation in text: [1] [2] -
Singh, S.; Singh, H.; Tandon, P.; Rao, N. V. S.; Ayala, A. P. Vib. Spectrosc. 2017, 90, 38–45. doi:10.1016/j.vibspec.2017.03.008
Return to citation in text: [1] [2] -
Ogawa, R.; Miwa, Y.; Kutsumizu, S. J. Phys. Chem. B 2015, 119, 10131–10137. doi:10.1021/acs.jpcb.5b05498
Return to citation in text: [1] [2] -
Mantsch, H. H.; McElhaney, R. N. Chem. Phys. Lipids 1991, 57, 213–226. doi:10.1016/0009-3084(91)90077-O
Return to citation in text: [1] [2] [3] -
Saupe, A. Mol. Cryst. Liq. Cryst. 1972, 16, 87–104. doi:10.1080/15421407208083582
Return to citation in text: [1] -
Ogawa, R.; Miwa, Y.; Sumita, M.; Saito, K.; Kutsumizu, S. Liq. Cryst. 2015, 42, 143–157. doi:10.1080/02678292.2014.969342
Return to citation in text: [1] [2] -
Bardeau, J.-F.; Parikh, A. N.; Beers, J. D.; Swanson, B. I. J. Phys. Chem. B 2000, 104, 627–635. doi:10.1021/jp992156v
Return to citation in text: [1] -
Kutsumizu, S.; Kato, R.; Yamada, M.; Yano, S. J. Phys. Chem. B 1997, 101, 10666–10673. doi:10.1021/jp9717913
Return to citation in text: [1] -
Galbiati, E.; Zerbi, G. J. Chem. Phys. 1987, 87, 3653–3659. doi:10.1063/1.453699
Return to citation in text: [1] -
Lewis, R. N. A. H.; McElhaney, R. N. Chem. Phys. Lipids 1998, 96, 9–21. doi:10.1016/S0009-3084(98)00077-2
Return to citation in text: [1] -
Nilsson, A.; Holmgren, A.; Lindblom, G. Chem. Phys. Lipids 1994, 69, 219–227. doi:10.1016/0009-3084(94)90003-5
Return to citation in text: [1] -
Šegota, S.; Vojta, D.; Pletikapić, G.; Baranović, G. Chem. Phys. Lipids 2015, 186, 17–29. doi:10.1016/j.chemphyslip.2014.11.001
Return to citation in text: [1] -
Ahlrichs, R.; Bär, M.; Häser, M.; Horn, H.; Kölmel, C. Chem. Phys. Lett. 1989, 162, 165–169. doi:10.1016/0009-2614(89)85118-8
Return to citation in text: [1] -
Eichkorn, K.; Treutler, O.; Öhm, H.; Häser, M.; Ahlrichs, R. Chem. Phys. Lett. 1995, 242, 652–660. doi:10.1016/0009-2614(95)00838-U
Return to citation in text: [1] -
Imrie, C. T.; Henderson, P. A. Chem. Soc. Rev. 2007, 36, 2096. doi:10.1039/b714102e
Return to citation in text: [1] [2] -
Archbold, C. T.; Andrews, J. L.; Mandle, R. J.; Cowling, S. J.; Goodby, J. W. Liq. Cryst. 2017, 44, 84–92. doi:10.1080/02678292.2016.1240247
Return to citation in text: [1] -
Goodby, J. W.; Mandle, R. J.; Davis, E. J.; Zhong, T.; Cowling, S. J. Liq. Cryst. 2015, 42, 593–622. doi:10.1080/02678292.2015.1030348
Return to citation in text: [1] -
Mandle, R. J.; Davis, E. J.; Archbold, C. T.; Cowling, S. J.; Goodby, J. W. J. Mater. Chem. C 2014, 2, 556–566. doi:10.1039/C3TC32137A
Return to citation in text: [1]
| 49. | Eichkorn, K.; Treutler, O.; Öhm, H.; Häser, M.; Ahlrichs, R. Chem. Phys. Lett. 1995, 242, 652–660. doi:10.1016/0009-2614(95)00838-U |
| 50. | Imrie, C. T.; Henderson, P. A. Chem. Soc. Rev. 2007, 36, 2096. doi:10.1039/b714102e |
| 34. | Attard, G. S.; Date, R. W.; Imrie, C. T.; Luckhurst, G. R.; Roskilly, S. J.; Seddon, J. M.; Taylor, L. Liq. Cryst. 1994, 16, 529–581. doi:10.1080/02678299408036531 |
| 35. | Imrie, C. T. Liq. Cryst. 2006, 33, 1449–1485. doi:10.1080/02678290601140498 |
| 36. | Yeap, G.-Y.; Hng, T.-C.; Yeap, S.-Y.; Gorecka, E.; Ito, M. M.; Ueno, K.; Okamoto, M.; Mahmood, W. A. K.; Imrie, C. T. Liq. Cryst. 2009, 36, 1431–1441. doi:10.1080/02678290903271504 |
| 10. | Adlem, K.; Čopič, M.; Luckhurst, G. R.; Mertelj, A.; Parri, O.; Richardson, R. M.; Snow, B. D.; Timimi, B. A.; Tuffin, R. P.; Wilkes, D. Phys. Rev. E 2013, 88, 022503. doi:10.1103/PhysRevE.88.022503 |
| 11. | López, D. O.; Robles-Hernández, B.; Salud, J.; de la Fuente, M. R.; Sebastián, N.; Diez-Berart, S.; Jaen, X.; Dunmur, D. A.; Luckhurst, G. R. Phys. Chem. Chem. Phys. 2016, 18, 4394–4404. doi:10.1039/C5CP07605F |
| 12. | Ramou, E.; Ahmed, Z.; Welch, C.; Karahaliou, P. K.; Mehl, G. H. Soft Matter 2016, 12, 888–899. doi:10.1039/C5SM01961C |
| 26. | Gorecka, E.; Salamonczyk, M.; Zep, A.; Pociecha, D.; Welch, C.; Ahmed, Z.; Mehl, G. H. Liq. Cryst. 2015, 42, 1–7. doi:10.1080/02678292.2014.984646 |
| 27. | Gorecka, E.; Vaupotič, N.; Zep, A.; Pociecha, D.; Yoshioka, J.; Yamamoto, J.; Takezoe, H. Angew. Chem., Int. Ed. 2015, 54, 10155–10159. doi:10.1002/anie.201502440 |
| 7. | Henderson, P. A.; Imrie, C. T. Liq. Cryst. 2011, 38, 1407–1414. doi:10.1080/02678292.2011.624368 |
| 8. | Dawood, A. A.; Grossel, M. C.; Luckhurst, G. R.; Richardson, R. M.; Timimi, B. A.; Wells, N. J.; Yousif, Y. Z. Liq. Cryst. 2016, 43, 2–12. doi:10.1080/02678292.2015.1114158 |
| 9. | Archbold, C. T.; Davis, E. J.; Mandle, R. J.; Cowling, S. J.; Goodby, J. W. Soft Matter 2015, 11, 7547–7557. doi:10.1039/C5SM01935D |
| 24. | Tuchband, M. R.; Shuai, M.; Graber, K. A.; Chen, D.; Zhu, C.; Radzihovsky, L.; Klittnick, A.; Foley, L. M.; Scarbrough, A.; Porada, J. H.; Moran, M.; Yelk, J.; Bedrov, D.; Korblova, E.; Walba, D. M.; Hexemer, A.; Maclennan, J. E.; Glaser, M. A.; Clark, N. A. arXiv [cond-mat.soft] 2017, No. 1703.10787. |
| 4. | Tripathi, C. S. P.; Losada-Pérez, P.; Glorieux, C.; Kohlmeier, A.; Tamba, M.-G.; Mehl, G. H.; Leys, J. Phys. Rev. E 2011, 84, 041707. doi:10.1103/PhysRevE.84.041707 |
| 5. | Parthasarathi, S.; Rao, D. S. S.; Palakurthy, N. B.; Yelamaggad, C. V.; Krishna Prasad, S. J. Phys. Chem. B 2016, 120, 5056–5062. doi:10.1021/acs.jpcb.6b03048 |
| 6. | Paterson, D. A.; Abberley, J. P.; Harrison, W. T. A.; Storey, J. M. D.; Imrie, C. T. Liq. Cryst. 2017, 44, 127–146. doi:10.1080/02678292.2016.1274293 |
| 2. | Cestari, M.; Diez-Berart, S.; Dunmur, D. A.; Ferrarini, A.; de La Fuente, M. R.; Jackson, D. J. B.; Lopez, D. O.; Luckhurst, G. R.; Perez-Jubindo, M. A.; Richardson, R. M.; Salud, J.; Timimi, B. A.; Zimmermann, H. Phys. Rev. E 2011, 84, 31704. doi:10.1103/PhysRevE.84.031704 |
| 17. | Ivšić, T.; Baumeister, U.; Dokli, I.; Mikleušević, A.; Lesac, A. Liq. Cryst. 2017, 44, 93–105. doi:10.1080/02678292.2016.1225832 |
| 21. | Mandle, R. J. Soft Matter 2016, 12, 7883–7901. doi:10.1039/C6SM01772J |
| 2. | Cestari, M.; Diez-Berart, S.; Dunmur, D. A.; Ferrarini, A.; de La Fuente, M. R.; Jackson, D. J. B.; Lopez, D. O.; Luckhurst, G. R.; Perez-Jubindo, M. A.; Richardson, R. M.; Salud, J.; Timimi, B. A.; Zimmermann, H. Phys. Rev. E 2011, 84, 31704. doi:10.1103/PhysRevE.84.031704 |
| 3. | Šepelj, M.; Lesac, A.; Baumeister, U.; Diele, S.; Nguyen, H. L.; Bruce, D. W. J. Mater. Chem. 2007, 17, 1154–1165. doi:10.1039/B612517D |
| 22. | Chen, D.; Nakata, M.; Shao, R.; Tuchband, M. R.; Shuai, M.; Baumeister, U.; Weissflog, W.; Walba, D. M.; Glaser, M. A.; Maclennan, J. E.; Clark, N. A. Phys. Rev. E 2014, 89, 22506. doi:10.1103/PhysRevE.89.022506 |
| 23. | Borshch, V.; Kim, Y.-K.; Xiang, J.; Gao, M.; Jákli, A.; Panov, V. P.; Vij, J. K.; Imrie, C. T.; Tamba, M. G.; Mehl, G. H.; Lavrentovich, O. D. Nat. Commun. 2013, 4, 2635. doi:10.1038/ncomms3635 |
| 24. | Tuchband, M. R.; Shuai, M.; Graber, K. A.; Chen, D.; Zhu, C.; Radzihovsky, L.; Klittnick, A.; Foley, L. M.; Scarbrough, A.; Porada, J. H.; Moran, M.; Yelk, J.; Bedrov, D.; Korblova, E.; Walba, D. M.; Hexemer, A.; Maclennan, J. E.; Glaser, M. A.; Clark, N. A. arXiv [cond-mat.soft] 2017, No. 1703.10787. |
| 25. | Tuchband, M. R.; Shuai, M.; Graber, K. A.; Chen, D.; Radzihovsky, L.; Klittnick, A.; Foley, L.; Scarbrough, A.; Porada, J. H.; Moran, M.; Korblova, E.; Walba, D. M.; Glaser, M. A.; Maclennan, J. E.; Clark, N. A. arXiv [cond-mat.soft] 2015, No. 1511.07523. |
| 16. | Ivšić, T.; Vinković, M.; Baumeister, U.; Mikleušević, A.; Lesac, A. RSC Adv. 2016, 6, 5000–5007. doi:10.1039/C5RA26078G |
| 18. | Dawood, A. A.; Grossel, M. C.; Luckhurst, G. R.; Richardson, R. M.; Timimi, B. A.; Wells, N. J.; Yousif, Y. Z. Liq. Cryst. 2017, 44, 106–126. |
| 19. | Humphries, R. L.; James, P. G.; Luckhurst, G. R. Symp. Faraday Soc. 1971, 5, 107–118. doi:10.1039/sf9710500107 |
| 50. | Imrie, C. T.; Henderson, P. A. Chem. Soc. Rev. 2007, 36, 2096. doi:10.1039/b714102e |
| 16. | Ivšić, T.; Vinković, M.; Baumeister, U.; Mikleušević, A.; Lesac, A. RSC Adv. 2016, 6, 5000–5007. doi:10.1039/C5RA26078G |
| 17. | Ivšić, T.; Baumeister, U.; Dokli, I.; Mikleušević, A.; Lesac, A. Liq. Cryst. 2017, 44, 93–105. doi:10.1080/02678292.2016.1225832 |
| 20. | Mandle, R. J.; Goodby, J. W. Chem. – Eur. J. 2016, 22, 9366–9374. doi:10.1002/chem.201601146 |
| 52. | Goodby, J. W.; Mandle, R. J.; Davis, E. J.; Zhong, T.; Cowling, S. J. Liq. Cryst. 2015, 42, 593–622. doi:10.1080/02678292.2015.1030348 |
| 53. | Mandle, R. J.; Davis, E. J.; Archbold, C. T.; Cowling, S. J.; Goodby, J. W. J. Mater. Chem. C 2014, 2, 556–566. doi:10.1039/C3TC32137A |
| 14. | Sugisawa, S.-y.; Tabe, Y. Soft Matter 2016, 12, 3103–3109. doi:10.1039/C6SM00038J |
| 15. | Szabon, J.; Diele, S. Cryst. Res. Technol. 1982, 17, 1315–1320. doi:10.1002/crat.2170171027 |
| 34. | Attard, G. S.; Date, R. W.; Imrie, C. T.; Luckhurst, G. R.; Roskilly, S. J.; Seddon, J. M.; Taylor, L. Liq. Cryst. 1994, 16, 529–581. doi:10.1080/02678299408036531 |
| 13. | Park, J. W.; Bak, C. S.; Labes, M. M. J. Am. Chem. Soc. 1975, 97, 4398–4400. doi:10.1021/ja00848a045 |
| 16. | Ivšić, T.; Vinković, M.; Baumeister, U.; Mikleušević, A.; Lesac, A. RSC Adv. 2016, 6, 5000–5007. doi:10.1039/C5RA26078G |
| 18. | Dawood, A. A.; Grossel, M. C.; Luckhurst, G. R.; Richardson, R. M.; Timimi, B. A.; Wells, N. J.; Yousif, Y. Z. Liq. Cryst. 2017, 44, 106–126. |
| 51. | Archbold, C. T.; Andrews, J. L.; Mandle, R. J.; Cowling, S. J.; Goodby, J. W. Liq. Cryst. 2017, 44, 84–92. doi:10.1080/02678292.2016.1240247 |
| 3. | Šepelj, M.; Lesac, A.; Baumeister, U.; Diele, S.; Nguyen, H. L.; Bruce, D. W. J. Mater. Chem. 2007, 17, 1154–1165. doi:10.1039/B612517D |
| 31. | Mandle, R. J.; Davis, E. J.; Archbold, C. T.; Voll, C. C.; Andrews, J. L.; Cowling, S. J.; Goodby, J. W. Chem. – Eur. J. 2015, 21, 8158–8167. doi:10.1002/chem.201500423 |
| 32. | Mandle, R. J.; Goodby, J. W. Soft Matter 2016, 12, 1436–1443. doi:10.1039/C5SM02720A |
| 33. | Tamba, M. G.; Salili, S. M.; Zhang, C.; Jákli, A.; Mehl, G. H.; Stannarius, R.; Eremin, A. RSC Adv. 2015, 5, 11207–11211. doi:10.1039/C4RA14669G |
| 28. | Emsley, J. W.; Lelli, M.; Lesage, A.; Luckhurst, G. R. J. Phys. Chem. B 2013, 117, 6547–6557. doi:10.1021/jp4001219 |
| 29. | Paterson, D. A.; Gao, M.; Kim, Y.-K.; Jamali, A.; Finley, K. L.; Robles-Hernández, B.; Diez-Berart, S.; Salud, J.; de la Fuente, M. R.; Timimi, B. A.; Zimmermann, H.; Greco, C.; Ferrarini, A.; Storey, J. M. D.; López, D. O.; Lavrentovich, O. D.; Luckhurst, G. R.; Imrie, C. T. Soft Matter 2016, 12, 6827–6840. doi:10.1039/C6SM00537C |
| 30. | Sebastián, N.; Robles-Hernández, B.; Diez-Berart, S.; Salud, J.; Luckhurst, G. R.; Dunmur, D. A.; López, D. O.; de la Fuente, M. R. Liq. Cryst. 2017, 44, 177–190. doi:10.1080/02678292.2016.1218963 |
| 24. | Tuchband, M. R.; Shuai, M.; Graber, K. A.; Chen, D.; Zhu, C.; Radzihovsky, L.; Klittnick, A.; Foley, L. M.; Scarbrough, A.; Porada, J. H.; Moran, M.; Yelk, J.; Bedrov, D.; Korblova, E.; Walba, D. M.; Hexemer, A.; Maclennan, J. E.; Glaser, M. A.; Clark, N. A. arXiv [cond-mat.soft] 2017, No. 1703.10787. |
| 37. | Singh, S.; Singh, H.; Tandon, P.; Rao, N. V. S.; Ayala, A. P. Vib. Spectrosc. 2017, 90, 38–45. doi:10.1016/j.vibspec.2017.03.008 |
| 39. | Mantsch, H. H.; McElhaney, R. N. Chem. Phys. Lipids 1991, 57, 213–226. doi:10.1016/0009-3084(91)90077-O |
| 41. | Ogawa, R.; Miwa, Y.; Sumita, M.; Saito, K.; Kutsumizu, S. Liq. Cryst. 2015, 42, 143–157. doi:10.1080/02678292.2014.969342 |
| 48. | Ahlrichs, R.; Bär, M.; Häser, M.; Horn, H.; Kölmel, C. Chem. Phys. Lett. 1989, 162, 165–169. doi:10.1016/0009-2614(89)85118-8 |
| 44. | Galbiati, E.; Zerbi, G. J. Chem. Phys. 1987, 87, 3653–3659. doi:10.1063/1.453699 |
| 39. | Mantsch, H. H.; McElhaney, R. N. Chem. Phys. Lipids 1991, 57, 213–226. doi:10.1016/0009-3084(91)90077-O |
| 45. | Lewis, R. N. A. H.; McElhaney, R. N. Chem. Phys. Lipids 1998, 96, 9–21. doi:10.1016/S0009-3084(98)00077-2 |
| 46. | Nilsson, A.; Holmgren, A.; Lindblom, G. Chem. Phys. Lipids 1994, 69, 219–227. doi:10.1016/0009-3084(94)90003-5 |
| 47. | Šegota, S.; Vojta, D.; Pletikapić, G.; Baranović, G. Chem. Phys. Lipids 2015, 186, 17–29. doi:10.1016/j.chemphyslip.2014.11.001 |
| 37. | Singh, S.; Singh, H.; Tandon, P.; Rao, N. V. S.; Ayala, A. P. Vib. Spectrosc. 2017, 90, 38–45. doi:10.1016/j.vibspec.2017.03.008 |
| 38. | Ogawa, R.; Miwa, Y.; Kutsumizu, S. J. Phys. Chem. B 2015, 119, 10131–10137. doi:10.1021/acs.jpcb.5b05498 |
| 39. | Mantsch, H. H.; McElhaney, R. N. Chem. Phys. Lipids 1991, 57, 213–226. doi:10.1016/0009-3084(91)90077-O |
| 40. | Saupe, A. Mol. Cryst. Liq. Cryst. 1972, 16, 87–104. doi:10.1080/15421407208083582 |
| 38. | Ogawa, R.; Miwa, Y.; Kutsumizu, S. J. Phys. Chem. B 2015, 119, 10131–10137. doi:10.1021/acs.jpcb.5b05498 |
| 41. | Ogawa, R.; Miwa, Y.; Sumita, M.; Saito, K.; Kutsumizu, S. Liq. Cryst. 2015, 42, 143–157. doi:10.1080/02678292.2014.969342 |
| 42. | Bardeau, J.-F.; Parikh, A. N.; Beers, J. D.; Swanson, B. I. J. Phys. Chem. B 2000, 104, 627–635. doi:10.1021/jp992156v |
| 43. | Kutsumizu, S.; Kato, R.; Yamada, M.; Yano, S. J. Phys. Chem. B 1997, 101, 10666–10673. doi:10.1021/jp9717913 |
| 34. | Attard, G. S.; Date, R. W.; Imrie, C. T.; Luckhurst, G. R.; Roskilly, S. J.; Seddon, J. M.; Taylor, L. Liq. Cryst. 1994, 16, 529–581. doi:10.1080/02678299408036531 |
| 35. | Imrie, C. T. Liq. Cryst. 2006, 33, 1449–1485. doi:10.1080/02678290601140498 |
| 36. | Yeap, G.-Y.; Hng, T.-C.; Yeap, S.-Y.; Gorecka, E.; Ito, M. M.; Ueno, K.; Okamoto, M.; Mahmood, W. A. K.; Imrie, C. T. Liq. Cryst. 2009, 36, 1431–1441. doi:10.1080/02678290903271504 |
© 2018 Knežević et al.; licensee Beilstein-Institut.
This is an Open Access article under the terms of the Creative Commons Attribution License (http://creativecommons.org/licenses/by/4.0), which permits unrestricted use, distribution, and reproduction in any medium, provided the original work is properly cited.
The license is subject to the Beilstein Journal of Nanotechnology terms and conditions: (https://www.beilstein-journals.org/bjnano)