Search results
Search for "cross sections" in Full Text gives 215 result(s) in Beilstein Journal of Nanotechnology. Showing first 200.
A set of empirical equations describing the observed colours of metal–anodic aluminium oxide–Al nanostructures
Beilstein J. Nanotechnol. 2020, 11, 798–806, doi:10.3762/bjnano.11.64

- . After that, the Cr layer was deposited. Characterization of AAO films Morphological characterisation was performed using a field-emission scanning electron microscope (FESEM, Hitachi S-4800) with a 1.5 kV accelerating voltage. The thickness was obtained from sample cross sections fabricated using a


Electromigration-induced directional steps towards the formation of single atomic Ag contacts
Beilstein J. Nanotechnol. 2020, 11, 680–687, doi:10.3762/bjnano.11.55

- ] direction. The frequency at 0.6 has also been observed before by Mares et al. [10]. It was attributed to relatively stable cross sections due to the formation of diametric orbits. This frequency was found to be very prominent for Ag, less prominent in Cu and absent in Au as observed by the authors of [10
- 2.6G0 as compared to Figure 2. Moreover, in Figure 4 fine-structure peaks at 2.7G0, 2.8G0, 3.2G0, 3.7G0, 4G0 and 4.7G0 are observed. However, the peaks around 14.5G0 and 15G0 are absent in Figure 4, i.e., the range of unstable cross sections is even more extended in this case. This difference may be due


Comparison of fresh and aged lithium iron phosphate cathodes using a tailored electrochemical strain microscopy technique
Beilstein J. Nanotechnol. 2020, 11, 583–596, doi:10.3762/bjnano.11.46

- characterization The ESM analysis was conducted inside of particles of the cross-sections of the fresh and aged cathodes. Two examples of the cross-section structure of the cathodes are given in Figure 1. In Figure 1a the fresh and in 1b the aged cathode cross-section is shown. The electrode consists of particles
- that the measurements are conducted on cross-sections of particles, we neglect the carbon coating or binder material influence on the results. The ESM signals show some precise and fine structures and clear separations within the particles. Assuming a rather large probed volume of the cubic tip radius


Evolution of Ag nanostructures created from thin films: UV–vis absorption and its theoretical predictions
Beilstein J. Nanotechnol. 2020, 11, 494–507, doi:10.3762/bjnano.11.40

- be observed, corresponding to the illumination in a direction parallel or perpendicular to its major axis [23]. In recent years, many scientific papers have also been devoted to triangular or tetrahedral nanoparticles, or nanorods/nanotubes with complex cross sections [23][24][25]. Plasmon resonance


High dynamic resistance elements based on a Josephson junction array
Beilstein J. Nanotechnol. 2020, 11, 417–420, doi:10.3762/bjnano.11.32

- . The SIS junction chain has been used to current bias narrow Ti nanowires [12], with cross sections demonstrating various phenomena attributed to the QPS effect [10][26][27][28][29][30][31][32][33]. The observation of Coulomb blockade and Bloch steps [12] confirms the usefulness of the suggested


Semitransparent Sb2S3 thin film solar cells by ultrasonic spray pyrolysis for use in solar windows
Beilstein J. Nanotechnol. 2019, 10, 2396–2409, doi:10.3762/bjnano.10.230

- solar cell cross sections were recorded in the combined energy dispersive X-ray spectrometer (Bruker spectrometer, ESPRIT 1.8, 7 kV) and scanning electron microscope (Zeiss HR FESEM Ultra 55, 4 kV) system. The surface morphology of glass/ITO/TiO2/Sb2S3 samples was recorded in a HR-SEM (Helios NanoLab


Atomic force acoustic microscopy reveals the influence of substrate stiffness and topography on cell behavior
Beilstein J. Nanotechnol. 2019, 10, 2329–2337, doi:10.3762/bjnano.10.223

- films are clearly higher than those of the unexposed regions. Figure 2k–o shows the responses of the cantilever to changes of the vibrational amplitude corresponding to cross sections of the acoustic images. Using the same resonance frequency (38.41 kHz), we observe an increase of the image contrast
- and undeveloped SU-8 film surfaces (patterned stiffness surfaces) exposed to EBL at exposure doses of 200, 500, 1000, 2000 and 5000 μC cm−2, respectively. (k–o) Vibrational amplitudes in cross sections of the acoustic images (p) Young's modulus values of the undeveloped SU-8 arrays at different


Nonlinear absorption and scattering of a single plasmonic nanostructure characterized by x-scan technique
Beilstein J. Nanotechnol. 2019, 10, 2182–2191, doi:10.3762/bjnano.10.211

- cross sections. By definition TNP (purple dots) + ANP (blue dots) = T0, which is true in the linear and in the nonlinear regime (Figure 5b). In the linear regime, we find that the backward scattering efficiency is constant at a value of ca. 8% (red dots), which is about half of the efficiency of
- , the absorption and scattering cross sections of a plasmonic nanosphere can be determined by classical Mie theory as: where, k is the wave vector, r is the radius of the particle, εp is the dielectric constant of the particle and εm is the dielectric constant of the surrounding medium. Upon irradiation
- ). The scale bar is 1 µm. (a) Excitation intensity dependent attenuation (blue dots), absorption (green dots) and backscattering (red dots) signals. (b) Normalized signals (i.e., proportional to the corresponding cross sections) as functions of the excitation laser intensity. (a) Schematic of the


Liquid crystal tunable claddings for polymer integrated optical waveguides
Beilstein J. Nanotechnol. 2019, 10, 2163–2170, doi:10.3762/bjnano.10.209

- developed by the authors using MatLab-R2018b along with a number of MatLab scripts from the WGModes package [17] from the University of Maryland [18]. COMSOL simulations of light propagation in a directional coupler and two MMIs, all having rectangular cross sections. The red dots show the distribution of


Nanostructured and oriented metal–organic framework films enabling extreme surface wetting properties
Beilstein J. Nanotechnol. 2019, 10, 1994–2003, doi:10.3762/bjnano.10.196

- -CAT-1 crystallites exhibit a hexagonally faceted, needle-like morphology with crystal cross-sections of 30–40 nm and several micrometers in length (Figure 1). In addition, the M-CAT-1 materials are electroactive featuring electrical conductivity values of up to 10−2–10−3 S cm−1 for pressed powder


Oblique angle deposition of nickel thin films by high-power impulse magnetron sputtering
Beilstein J. Nanotechnol. 2019, 10, 1914–1921, doi:10.3762/bjnano.10.186

- ). For this aim, the edges of the substrate were marked before deposition. After deposition, the samples were sonicated in an ethanol/isopropanol mixture to remove the marker and the nickel on top of it (lift-off process). Cross sections of the Ni films were studied using a Leo Supra 25 scanning electron


Growth dynamics and light scattering of gold nanoparticles in situ synthesized at high concentration in thin polymer films
Beilstein J. Nanotechnol. 2019, 10, 1768–1777, doi:10.3762/bjnano.10.172

- . BRDF curves corresponding to cross sections of the previous measurements along the plane of azimuth ϕr = 90–270°, i.e., perpendicular to the incident plane, are presented in Figure 4 for the annealed and non-annealed samples. Even if the background is relatively noisy, the curves are clearly different


Rapid thermal annealing for high-quality ITO thin films deposited by radio-frequency magnetron sputtering
Beilstein J. Nanotechnol. 2019, 10, 1511–1522, doi:10.3762/bjnano.10.149

- crystallinity by increasing the crystallite size (from 12.7 nm to 34.3 nm). Also, it was found from SEM investigations (cross-sections) that films subjected to such a thermal treatment show good adhesion to the substrate. Based on XPS investigations, it was evidenced that stoichiometric thin films were obtained


Growth of lithium hydride thin films from solutions: Towards solution atomic layer deposition of lithiated films
Beilstein J. Nanotechnol. 2019, 10, 1443–1451, doi:10.3762/bjnano.10.142

- the deposition and the high risk of contamination during long runs, only a few thick samples were prepared as cross sections. Spectroscopic ellipsometry measurements to determine the growth curve were performed directly after deposition (Figure 11). The deviations from the fit, RMSE = 0.65, in Figure


Fabrication of phase masks from amorphous carbon thin films for electron-beam shaping
Beilstein J. Nanotechnol. 2019, 10, 1290–1302, doi:10.3762/bjnano.10.128

- sputtered Pt layers to preserve the original structure during TEM lamella preparation. Similar to the PM for the BB (Figure 4c), both cross-sections show an inhomogeneous distribution of implanted Ga (dark contrast), which is more pronounced in thinner regions due to the longer FIB dwell time. The offset


Alloyed Pt3M (M = Co, Ni) nanoparticles supported on S- and N-doped carbon nanotubes for the oxygen reduction reaction
Beilstein J. Nanotechnol. 2019, 10, 1251–1269, doi:10.3762/bjnano.10.125

- performed on a diffractometer dedicated to pair distribution function (PDF) analyses: graphite-monochromatized molybdenum radiation (0.07169 nm), solid state detection and low background setup. The samples were sealed in Lindemann glass capillaries (diameter 1.5 mm). The MEA cross-sections were prepared by
- first cutting MEA samples (8 × 8 mm2) and embedding them in epoxy resin. Then, the MEA cross-sections were prepared by mechanical polishing until a mirror-like surface was achieved and were observed using a Zeiss FEG-SEM LEO1530. Electrochemical measurements RRDE measurements The electrochemical


Nanoscale optical and structural characterisation of silk
Beilstein J. Nanotechnol. 2019, 10, 922–929, doi:10.3762/bjnano.10.93

- Recent advances in the nanofabrication of electronic devices require cutting-edge analytical technologies to provide a reliable structural characterisation of materials at the nanoscale. Such technologies are particularly important to probe molecular properties of cross sections smaller than 100 nm in
- differences between the reflectance and absorbance of silk fibers with ca. 10 nm resolution. Cross sections of silk fibers were prepared using an ultramicrotome. Silk was chosen due to its well-known spectral properties and its increasing applications as a biocompatible and biodegradable material [13][14


Fabrication of silver nanoisland films by pulsed laser deposition for surface-enhanced Raman spectroscopy
Beilstein J. Nanotechnol. 2019, 10, 882–893, doi:10.3762/bjnano.10.89

- . A very sharp edge for height (layer thickness) measurements was obtained in this way due to the low adhesion of the silver films to the Si substrate. AFM measurements were carried out in three different areas on the surface of each sample. Then for each sample ten AFM cross sections from different


Features and advantages of flexible silicon nanowires for SERS applications
Beilstein J. Nanotechnol. 2019, 10, 725–734, doi:10.3762/bjnano.10.72

- resonant laser excitation of analyte molecules with differential cross section of ca. 10−27 cm2/sr, a SERS enhancement factor (EF) of 108 would be adequate for single-molecule detection. Under non-resonant conditions and/or for lower cross sections (ca. 10−30 cm2/sr ) EF values above 1011 are required [4


Sub-wavelength waveguide properties of 1D and surface-functionalized SnO2 nanostructures of various morphologies
Beilstein J. Nanotechnol. 2019, 10, 379–388, doi:10.3762/bjnano.10.37

- , we focus on the growth of elongated SnO2 NWs with different cross sections such as circular, square, and rectangular (belt) using SnO2 quantum dots (QDs) as a precursor material. The waveguide behavior in square- and cylindrical-shaped NWs, uniform-sized nanobelts (NBs), tapered NBs and surface


Scanning probe microscopy for energy-related materials
Beilstein J. Nanotechnol. 2019, 10, 132–134, doi:10.3762/bjnano.10.12

- of performing KPFM measurements on nanoscale electrical devices [4]. In particular, the knowledge of the true potential of surfaces is required for the analysis of cross-sections of solar cell devices [5][6]. Thus, this work is the basis for future quantitative analysis of nanoscale devices even
Graphene–graphite hybrid epoxy composites with controllable workability for thermal management
Beilstein J. Nanotechnol. 2019, 10, 95–104, doi:10.3762/bjnano.10.9

- microscopy and energy-dispersive X-ray spectroscopy (EDS) Cross sections of composite samples were imaged by a high-resolution cold FEG scanning electron microscope (SEM, JSM-7400F, JEOL) equipped with an energy dispersive X-ray spectroscopy (EDS) instrument (Noran Vantage) operated in secondary electron


A new bioinspired method for pressure and flow sensing based on the underwater air-retaining surface of the backswimmer Notonecta
Beilstein J. Nanotechnol. 2018, 9, 3039–3047, doi:10.3762/bjnano.9.282

- the setae indeed occurs if pressure changes, confocal laser scanning microscopy (CLSM) was used (see Experimental section). In the projection through a stack of CLSM images, the setae as well as the reflecting air–water interface in between the setae could be monitored (Figure 6c). Cross sections
- pixel size of 3 µm. Synchrotron-µCT of basal hemelytra More detailed cross sections of parts of a hemelytron were created at the Swiss Light Source synchrotron of the Paul Scherrer Institute (PSI; Villigen, Switzerland; X02DA TOMCAT beamline). The X-rays, produced by a 2.9 T superbending magnet on a 2.4


Femtosecond laser-assisted fabrication of chalcopyrite micro-concentrator photovoltaics
Beilstein J. Nanotechnol. 2018, 9, 3025–3038, doi:10.3762/bjnano.9.281
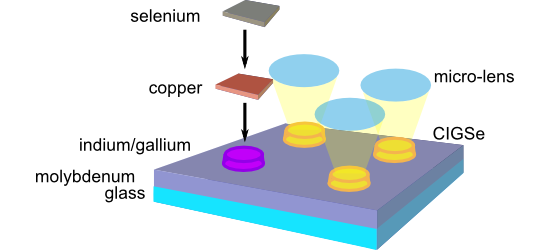
- . Figure 6 shows SEM images of individual laser spots on glass (top row) and their corresponding profilometric cross sections (bottom row). In the middle row, the spots are depicted after subsequent deposition of molybdenum and indium. The spots were created by applying different pulse numbers N and laser
- corresponding profilometric cross sections (bottom row). Spots after deposition of molybdenum and indium (middle row). Laser parameters from left to right: F = 1.63 J/cm2, N = 100; F = 1.83 J/cm2, N = 30; F = 1.83 J/cm2, N = 100; F = 2.04 J/cm2, N = 100. Optical micrographs of a laser-generated spot array on


Electrostatic force microscopy for the accurate characterization of interphases in nanocomposites
Beilstein J. Nanotechnol. 2018, 9, 2999–3012, doi:10.3762/bjnano.9.279

- panels). To avoid border effects, the EFM cross-sections were collected slightly far from the center and this is reflected by the change of the apparent particle width on the EFM average profiles. Approach 3 - Step C (PS + 50 nm SiO2 + 50 nm Al2O3 and PS + 100 nm Al2O3 samples). a) Average topography


