Search results
Search for "quality factor" in Full Text gives 116 result(s) in Beilstein Journal of Nanotechnology.
High-stress study of bioinspired multifunctional PEDOT:PSS/nanoclay nanocomposites using AFM, SEM and numerical simulation
Beilstein J. Nanotechnol. 2017, 8, 2069–2082, doi:10.3762/bjnano.8.207

- influencing the conductivity. The mechanical properties of the samples (PPSS, LAP and MTM) were compared using CRFM. In CRFM, the resonance frequency and quality factor of the mechanically-coupled tip–sample surface system are measured [46][47][48]. The contact-resonance frequency, which is higher than the
- free cantilever resonance frequency, is directly related to stiffness (larger stiffness leads to larger frequency and vice-versa) [49], while the quality factor maps the sample damping of the cantilever tip oscillation (greater dissipation leads to lower quality factor and vice-versa) [50]. The contact
- -resonance frequency and quality factor are often referred to as mechanical parameters. Although, there are methods to approximately calibrate for the Young’s modulus, they require a standard reference sample with similar properties to the unknown sample, and this includes the surface properties [51


A comparative study of the nanoscale and macroscale tribological attributes of alumina and stainless steel surfaces immersed in aqueous suspensions of positively or negatively charged nanodiamonds
Beilstein J. Nanotechnol. 2017, 8, 2045–2059, doi:10.3762/bjnano.8.205

- the inverse quality factor of the resonator, as will be described below. Data were recorded as follows. The QCM sample was first placed into the flow-cell initially filled with ambient air. The system was operated continuously until the frequency and amplitude stabilized to less than 1 ppm/min. Once
- . Following 1 h of exposure to the ND suspension, 20 mL of DI water was flushed into the cell by a second syringe pump. Quartz crystal microbalance data analysis Analogous to the description in [9], changes in the resonant frequency, δf , and the inverse quality factor, δ(Q−1), of a QCM reflect changes in the
- = −714 Hz drop in the resonant frequency and an increase of δ(Q−1) = 2.85 × 10⁻⁴ in the dissipation. For a QCM with quality factor Q = 50,000 in air this corresponds to a drop to Q = 3,280 after an immersion in water. The viscous drag forces on the QCM electrode are mechanical in nature; a decrease in Q


High-speed dynamic-mode atomic force microscopy imaging of polymers: an adaptive multiloop-mode approach
Beilstein J. Nanotechnol. 2017, 8, 1563–1570, doi:10.3762/bjnano.8.158

- tapping amplitude is close to the free vibration amplitude). Finally, the mean tip–sample interaction force (per tapping period T), , can be quantified as [1][10][11], where kc and m are the spring constant and the mass of the cantilever, respectively, Q is the quality factor of the cantilever, dtot(t


A review of demodulation techniques for amplitude-modulation atomic force microscopy
Beilstein J. Nanotechnol. 2017, 8, 1407–1426, doi:10.3762/bjnano.8.142

- appear in the amplitude error image, any imaging artifacts are either due to insufficient demodulator or cantilever bandwidth. In order to render the demodulator the bottleneck, the fundamental resonance at f1 ≈ 50 kHz of the DMASP cantilever is heavily damped with model-based quality factor control [68
- ]. The frequency responses from the cantilever actuation to tip displacement for various quality factor controller gains are shown in Figure 17 along side the corresponding tracking bandwidths obtained from drive amplitude modulation. Due to the integrated actuation of the cantilever, the control method
- achieved a quality factor as low as Q1 = 8, resulting in a tracking bandwidth of 3.3 kHz, adequately matching the first-order approximation f1/(2Q1) [36]. AFM images of a calibration grating (NT-MDT TGZ3) with periodic features of height h ≈ 500 nm were obtained at a speed of 627 μm/s and 1.25 mm/s


A top-down approach for fabricating three-dimensional closed hollow nanostructures with permeable thin metal walls
Beilstein J. Nanotechnol. 2017, 8, 1231–1237, doi:10.3762/bjnano.8.124

- ]. The sensing mechanism of the latter is based on a high quality factor MaGMR that allows larger light interaction with the liquid sample. It should be noted that the presented fabrication approach also provides a convenient method to introduce particular substances (load) of interest inside the


Scaling law to determine peak forces in tapping-mode AFM experiments on finite elastic soft matter systems
Beilstein J. Nanotechnol. 2017, 8, 968–974, doi:10.3762/bjnano.8.98

- mass of the fluid [39], and ω0, Q, k and Fts are the angular resonant frequency, quality factor, spring constant and tip–sample interaction forces, respectively. The latter has been modelled according to the Tatara contact mechanics [35][36][37] which is given by with the constitutive material


Near-field surface plasmon field enhancement induced by rippled surfaces
Beilstein J. Nanotechnol. 2017, 8, 956–967, doi:10.3762/bjnano.8.97

- the imagery part is a measure of the energy leakage in the system, quantified by the quality factor Qn = ωn/2γn. To measure the spatial extent of localized QNMs, i.e., the surface occupied by the hot spot modes and their localization transition, we use the so-called inverse participation ratio, χ


Functional dependence of resonant harmonics on nanomechanical parameters in dynamic mode atomic force microscopy
Beilstein J. Nanotechnol. 2017, 8, 883–891, doi:10.3762/bjnano.8.90

- A6 on the cantilever properties is more complex because the cantilever shape, the elastic constant kc, the resonance frequency f0 and the quality factor Q are interrelated parameters that all contribute to the dynamics of the oscillation. For simplicity, we characterize the cantilever by kc. Sader’s


Optimizing qPlus sensor assemblies for simultaneous scanning tunneling and noncontact atomic force microscopy operation based on finite element method analysis
Beilstein J. Nanotechnol. 2017, 8, 657–666, doi:10.3762/bjnano.8.70

- enable the simultaneous collection of local forces and tunneling currents, the exact realization of this wire connection has a major effect on sensor properties such as spring constant, quality factor, resonance frequency, and its deviation from an ideal vertical oscillation. Keywords: force sensor
- have to expect considerable additional viscous damping [28]. The model setup used for the FEM calculations is illustrated in Figure 1a. As in the earlier model of [26], boundary conditions for determining spring constant, quality factor, resonance frequency, and perturbation of the ideal vertical
- 2) since the force pulls on the tip apex rather than then prong, some deformation will occur in the tip and, in particular, inside the glue. To determine quality factor Q, eigenfrequency f0, and perturbation Δy/Δz of the first eigenmode oscillation from motion in the main x–z oscillation plane, an


Multimodal cantilevers with novel piezoelectric layer topology for sensitivity enhancement
Beilstein J. Nanotechnol. 2017, 8, 358–371, doi:10.3762/bjnano.8.38

- voltage to displacement is modeled as a set of second order modes. The transfer function from voltage V to displacement d is [52] where for the i-th mode, ωi is the natural frequency, Qi is the quality factor and αi is the gain. While under motion, the strain on the piezoelectric transducer induces charge


Flexible photonic crystal membranes with nanoparticle high refractive index layers
Beilstein J. Nanotechnol. 2017, 8, 203–209, doi:10.3762/bjnano.8.22

- % concentration exhibits a poor quality of resonances that could not be used for meaningful statements. Figure 2a shows the spectra for the different nanoparticle concentrations. The resonances exhibit a quality factor Q of ≈40. The resonance wavelength shifts with the nanoparticle concentration. This is expected
- reduces to: Using Equation 2 we calculate the effective refractive index neff of the mode for the different nanoparticle concentrations from the period Λ = 400 nm, resonance wavelength λ, and the order m = 1. The values are summarized in Table 1. The quality factor (Q) given in Table 1 is calculated with
- under strain. The experimental data shows on the example of the 6 wt % resonance that a 20% strain results in negligible decrease of the quality factor and a wavelength shift from 586 to 664 nm. This corresponds to 3.9 nm/% strain. This shift with strain is on the same order as values found in


Noise in NC-AFM measurements with significant tip–sample interaction
Beilstein J. Nanotechnol. 2016, 7, 1885–1904, doi:10.3762/bjnano.7.181
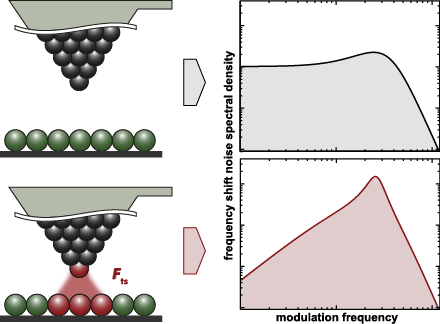
- temperature and a quality factor of Q0 = 43900 determined as described elsewhere [14]. The noise floor is determined to and the modal stiffness of the cantilever [20] to k0 = 32.4 N/m from a measurement of the thermally excited cantilever oscillation [11] with the spectrum analyser of the HF2LI device. The
- . The control loop within the PLL demodulator (not shown in Figure 2) is discussed in appendix C.2. In this frequency control loop feedback path, displacement noise propagating from the PLL to the cantilever excitation is weighted by the reciprocal of the quality factor Q0. This factor defines the ratio
- harmonic oscillator with the quality factor Q0 and the eigenfrequency ω0 = 2πf0. This function can be re-written with the modulation frequency ωm as the argument by substituting ω = ω0 + ωm and can for be approximated [9] to Note that Equation 20 is phase shifted by π/2 relative to Equation 19 [12


![[Graphic 32]](/bjnano/content/inline/2190-4286-7-181-i73.png?max-width=637&scale=1.18182) wit...
wit...

![[Graphic 34]](/bjnano/content/inline/2190-4286-7-181-i75.png?max-width=637&scale=1.18182) wit...
wit...


Signal enhancement in cantilever magnetometry based on a co-resonantly coupled sensor
Beilstein J. Nanotechnol. 2016, 7, 1033–1043, doi:10.3762/bjnano.7.96

- However, it is obvious that in the limit of small dissipation or correspondingly a high quality factor of the cantilever these frequencies coincide well. The resonance frequency of a beam can easily be determined from amplitude response curves and, since all our discussions will be based on such curves
- by [25]: Hereby kB denotes the Boltzmann constant, T the temperature, Bw the measurement bandwidth and Q the quality factor. f0 and k0 are the resonance frequency and spring constant of the cantilever and A is the amplitude at the free end of the cantilever. By following the reasoning of Gysin et al
- cantilever length, a high oscillation amplitude, a strong magnetic field, small spring constant, high resonance frequency and a large quality factor. Both cantilever length and amplitude have a major influence on the minimal detectable magnetic moment. Furthermore, mmin is maximized if Hext and Ha are high


![[Graphic 11]](/bjnano/content/inline/2190-4286-7-96-i21.png?max-width=637&scale=1.18182) on the interaction spring constant k3. Th...
on the interaction spring constant k3. Th...
Generalized Hertz model for bimodal nanomechanical mapping
Beilstein J. Nanotechnol. 2016, 7, 970–982, doi:10.3762/bjnano.7.89

- amplitude A and interaction phase as in while the cantilever quality factor Qc, the cantilever stiffness kc, and the reference amplitude Ar are all measured in the absence of tip–sample interactions (Ar is often referred to as the “free amplitude”). Phase modulation (PM) mode Alternatively, PM mode uses an
- Assuming that the drive force F is proportional to the drive amplitude D and that their relationship is frequency-independent implies that Substituting Equation 27 and Equation 31 into Equation 30 results in With the substitutions and that introduce the cantilever resonance frequency ωc and the quality
- factor Qc, Equation 32 can be rewritten in a more experimentally friendly form as Lastly, driving the cantilever on resonance prior to tip sample interactions (ωr = ωc; = 90°) simplifies the result to For AM operation, setting D = Dr and ω = ωc results in Equation 17. For PM operation, setting A = Ar


![[Graphic 4]](/bjnano/content/inline/2190-4286-7-89-i40.png?max-width=637&scale=1.18182) approximation applied to Equation 6 i...
approximation applied to Equation 6 i...


Nanoscale effects in the characterization of viscoelastic materials with atomic force microscopy: coupling of a quasi-three-dimensional standard linear solid model with in-plane surface interactions
Beilstein J. Nanotechnol. 2016, 7, 554–571, doi:10.3762/bjnano.7.49

- oscillation (Figure 8f). The cantilever parameters used in Figure 8 were as follows: resonance frequency 150 kHz, force constant 10 N/m, quality factor 150, free oscillation amplitude 100 nm, and tip radius of curvature 20 nm. The cantilever position above the sample was 76 nm for (a) and (b). The subsurface


High-bandwidth multimode self-sensing in bimodal atomic force microscopy
Beilstein J. Nanotechnol. 2016, 7, 284–295, doi:10.3762/bjnano.7.26

- the quality factor Qi, natural frequency ωi and gain αi. Similarly, when a piezoelectric transducer is subjected to mechanical strain it becomes electrically polarized, producing a charge on the surface of the material, described by Equation 10. This direct piezoelectric effect can be modeled as a


Large area scanning probe microscope in ultra-high vacuum demonstrated for electrostatic force measurements on high-voltage devices
Beilstein J. Nanotechnol. 2015, 6, 2485–2497, doi:10.3762/bjnano.6.258

- under UHV condition has the advantage of a high quality factor (Q ≈ 30,000) due to the suppression of viscous damping and therefore increases the force sensitivity by orders of magnitude [27][28]. To analyse complex and large micro-structures a large positioning and scanning unit is necessary, under


A simple and efficient quasi 3-dimensional viscoelastic model and software for simulation of tapping-mode atomic force microscopy
Beilstein J. Nanotechnol. 2015, 6, 2233–2241, doi:10.3762/bjnano.6.229

- of time, ωi is the resonance frequency of the eigenmode, Qi its quality factor and ki its dynamic force constant. Additionally, Fts is the total tip–sample force and the last term on the right hand side is the sum of the sinusoidal driving forces included for the various eigenmodes. Each term


Kelvin probe force microscopy for local characterisation of active nanoelectronic devices
Beilstein J. Nanotechnol. 2015, 6, 2193–2206, doi:10.3762/bjnano.6.225

- superior resolution of FM-KFM while maintaining robust topography feedback and minimal crosstalk, we introduce a novel FM-KFM controller based on a Kalman filter and direct demodulation of sidebands. We discuss the origin of sidebands in FM-KFM irrespective of the cantilever quality factor and how direct
- perturbed by the tip–sample interaction force , where z(t) is the cantilever deflection, ω0 the eigenfrequency, k the spring constant, and Q the quality factor of the cantilever. For an oscillation with amplitude A and drive frequency ωd ≈ ω0, the interaction force can be approximated to where z0 is the
- also depends on the resonant frequency and the quality factor, which may change while scanning. Furthermore, there may be differences in the sideband phase shift when Q or ω0 are not constant (cf. Figure 2). Together, such inaccuracies in the model easily translate into uncertainties of Ulcpd in an


![[Graphic 33]](/bjnano/content/inline/2190-4286-6-225-i48.png?max-width=637&scale=1.18182) for different modulation amplitu...
for different modulation amplitu...


Development of a novel nanoindentation technique by utilizing a dual-probe AFM system
Beilstein J. Nanotechnol. 2015, 6, 2015–2027, doi:10.3762/bjnano.6.205

- improvement over conventional AFM-based nanoindentation experiments that convolute XY motion into Z motion with laser-based detection of cantilever motion. Additionally, the use of a tuning fork gives excellent force sensitivity due to its significantly higher spring constant, quality factor, and ability to


Improved atomic force microscopy cantilever performance by partial reflective coating
Beilstein J. Nanotechnol. 2015, 6, 1450–1456, doi:10.3762/bjnano.6.150

- damping of the cantilever, leading to a lower mechanical quality factor (Q-factor). In dynamic mode operation in high vacuum, a cantilever with a high Q-factor is desired in order to achieve a lower minimal detectable force. The reflective coating can also increase the low-frequency force noise. In


Nanomechanical humidity detection through porous alumina cantilevers
Beilstein J. Nanotechnol. 2015, 6, 1332–1337, doi:10.3762/bjnano.6.137

- with a length of 800 μm and 10% porosity. The resonant frequency decreases from 117.7 kHz at 10% to 116.5 kHz at 21% humidity. Changing the humidity from 21 to 10% increases the resonant frequency by 1120 Hz and quality factor of the AAO cantilever increases from 61 to 82, respectively (Figure 3


Superluminescence from an optically pumped molecular tunneling junction by injection of plasmon induced hot electrons
Beilstein J. Nanotechnol. 2015, 6, 1100–1106, doi:10.3762/bjnano.6.111

- scattered to the far field. While the gap modes plasmon resonance is very broad, exhibiting a quality factor of only Q ≈ 15, the resonantly stored energy in the optical near field in the gap is extremely well localized, in a volume having an upper limit of approximately 4 × 4 × 1 nm3 (see Figure S8
- Information File 1) of the junction, Γ = (ω0/Q) its spectral bandwidth, Q its quality factor and Vm its spatial volume. The total emission rate γem comprises all optical emission processes in the gap, i.e., spontaneous and stimulated recombination as well as Raman scattering (ΦLσR). From the measured Raman


Optimization of phase contrast in bimodal amplitude modulation AFM
Beilstein J. Nanotechnol. 2015, 6, 1072–1081, doi:10.3762/bjnano.6.108

- be described by the system of two differential modal equations, with i = 1,2; ωi, ki, Qi, , Ai and A0i are, respectively, the angular frequency, the force constant, quality factor, phase shift, amplitude and free amplitude of mode i; m = 0.25mc is an effective mass while mc is the real cantilever–tip


Graphene on SiC(0001) inspected by dynamic atomic force microscopy at room temperature
Beilstein J. Nanotechnol. 2015, 6, 901–906, doi:10.3762/bjnano.6.93

- custom-built quartz-tuning fork sensor was used for the measurements. It had a main resonance frequency of 51294 Hz, a quality factor above 1000 and an estimated stiffness of ≈3800 N·m−1 [22]. The contact to the tungsten tip was made of a thin golden wire in order to avoid crosstalk with the deflection


![[Graphic 1]](/bjnano/content/inline/2190-4286-6-93-i1.png?max-width=637&scale=1.18182) × 6
× 6