Search results
Search for "spatial distribution" in Full Text gives 101 result(s) in Beilstein Journal of Nanotechnology.
The role of gold atom concentration in the formation of Cu–Au nanoparticles from the gas phase
Beilstein J. Nanotechnol. 2021, 12, 72–81, doi:10.3762/bjnano.12.6

- ) were found in the spatial distribution shown in [3] and a pure copper cluster melts at 1100 K [21], even with a size of 2200 atoms, the temperature of the system should be equivalent to the higher melting point (Tm = 1358 K for copper). Therefore, a comparative analysis between the spatial distribution
- simulation and the data on the size distribution of Cu3Au clusters obtained by laser deposition [3]. An analysis of the shape and distribution of the Cu3Au clusters on the substrate indicates that the agglomeration processes were suppressed in this case [3]. The reason for that may be the wide spatial
- distribution of the evaporated primary fragments of the cluster due to the high ambient temperature. This interferes with the combination of the resulting clusters as a result of the high kinetic energy of the atoms, and, possibly, also of the short time of approach to the substrate. As a result, in the case


Bulk chemical composition contrast from attractive forces in AFM force spectroscopy
Beilstein J. Nanotechnol. 2021, 12, 58–71, doi:10.3762/bjnano.12.5

- statistically. This is done by plotting them as histograms, individually or correlated as kr(xi,yi) as a function of Fattr(xi,yi), which leads to the kr/Fattr diagram, as shown in Figure 2c. By plotting the results in the kr/Fattr diagram, the information about the spatial distribution is lost. However, insight


Molecular dynamics modeling of the influence forming process parameters on the structure and morphology of a superconducting spin valve
Beilstein J. Nanotechnol. 2020, 11, 1776–1788, doi:10.3762/bjnano.11.160

- superconductor nanolayers. The aim was to study the influence of the main technological parameters including temperature, concentration and spatial distribution of deposited atoms over the nanosystem surface on the atomic structure and morphology of the nanosystem. The studies were carried out using the
- technological parameters (substrate temperature, concentration and spatial distribution of the deposited atoms over the interface) on the structure and morphology of the layered nanosystem. Mathematical Model and Theoretical Foundations The formation processes and the structure of multilayer systems for
- neighbors in a nanosystem, and therefore on its structure and properties. A significant decrease in the coordination number in the outer layers of the last nanofilm is associated with the surface effects and boundary phenomena appearance in that region. The spatial distribution of this parameter is shown in


Self-assembly and spectroscopic fingerprints of photoactive pyrenyl tectons on hBN/Cu(111)
Beilstein J. Nanotechnol. 2020, 11, 1470–1483, doi:10.3762/bjnano.11.130

- Figures S1–S5, Supporting Information File 1). The computations revealed that the pyrenes have large orbital coefficients at the 1-, 3-, 6-, and 8-positions, with the nodal plane going through the 2- and 7-positions (Figure 1) [69][70][71][72][73][74]. As a consequence of this spatial distribution, the


Controlling the proximity effect in a Co/Nb multilayer: the properties of electronic transport
Beilstein J. Nanotechnol. 2020, 11, 1336–1345, doi:10.3762/bjnano.11.118

- differ. The numerical solution of the boundary problem (Equation 2, Equation 3) provides the required spatial distribution of the pair potential, Δ(x), as well as the anomalous, Φ(x), and normal, G(x), Green’s functions at a given temperature. We found that the behavior of the system significantly
- strongly dependent on the distance from the bulk electrode. At temperature values above TC*, the spatial distribution has a similar shape, although a significant pairing amplitude appears only in the s-layers closest to the bulk semiconductor electrode. An additional possible consequence of such spatial
- external magnetic field do not occur simultaneously, but instead gradually from the outer to the inner layers of the structure. The calculated distribution of the anomalous Green’s function, F, allows for the estimation of the screening properties of the hybrid structure. The spatial distribution of the


Monolayers of MoS2 on Ag(111) as decoupling layers for organic molecules: resolution of electronic and vibronic states of TCNQ
Beilstein J. Nanotechnol. 2020, 11, 1062–1071, doi:10.3762/bjnano.11.91

- ], this appearance can be associated to the spatial distribution of the lowest unoccupied molecular orbital (LUMO). The molecular arrangement can be described by the lattice vectors a1 = 0.9 ± 0.1 nm, a2 = 1.0 ± 0.1 nm and the angle (96 ± 2)° (see model in Figure 3c). This structure is stabilized by
- used to calculate the tunneling matrix element Mts with an s-wave tip at a tip–molecule distance of 7.5 Å, work function of 5 eV. The map of the spatial distribution of is shown in the middle panel. a) STM topography image of a TCNQ island recorded at V = 1 V, I = 10 pA. b) Simulated (top panel) and


Hexagonal boron nitride: a review of the emerging material platform for single-photon sources and the spin–photon interface
Beilstein J. Nanotechnol. 2020, 11, 740–769, doi:10.3762/bjnano.11.61

- ][120] from low to high energy electrons, with the high energy electrons improving the yield and the spatial distribution of the emitters away from the edges in the center of the flake; oxygen plasma etching associated with annealing [121] and in particular a process of only two steps, including Ar


Four self-made free surface electrospinning devices for high-throughput preparation of high-quality nanofibers
Beilstein J. Nanotechnol. 2019, 10, 2261–2274, doi:10.3762/bjnano.10.218

- intensity of the MBE device decreases to near zero before it increases slightly at larger distances. To further compare the spatial distribution of the electric fields of the MBE, MFSE, OSFSE and SSFSE devices, a parameter ƒ is introduced as follows: where Emax is the maximum electric field intensity and


Liquid crystal tunable claddings for polymer integrated optical waveguides
Beilstein J. Nanotechnol. 2019, 10, 2163–2170, doi:10.3762/bjnano.10.209

- same LC structure was mounted on top of the MMIs. Modeling of mode propagation and electric field spatial distribution was performed employing the COMSOL® finite element suite loaded with electromagnetics modules. The electric field distribution in waveguides normal sections was calculated with a code


Gold-coated plant virus as computed tomography imaging contrast agent
Beilstein J. Nanotechnol. 2019, 10, 1983–1993, doi:10.3762/bjnano.10.195

- and size, indicating that they are resistant to solubilization or oxidation. The dual STEM and EDX spectra from the Antibody-PEG5000Au-CPMV gave useful information about the spatial distribution of gold and sulfur across the cellular surface. The simultaneously acquired EDX spectrum images confirmed


Fabrication of silver nanoisland films by pulsed laser deposition for surface-enhanced Raman spectroscopy
Beilstein J. Nanotechnol. 2019, 10, 882–893, doi:10.3762/bjnano.10.89

- D can be due to the formation of highly SERS active sites (in the gaps) but with a non-homogenous spatial distribution. The SERS activity of samples F, G and H, I behaves similar to that of samples A–E as the number of laser pulses increases. However, the use of a lower laser fluence during the


Periodic Co/Nb pseudo spin valve for cryogenic memory
Beilstein J. Nanotechnol. 2019, 10, 833–839, doi:10.3762/bjnano.10.83

- in the negative direction. Thus the use of the pseudo-spin-valve concept allows us to organize AP alignment without exchange or magnetostatic coupling of neighboring F layers. Figure 2a shows the spatial distribution of the pair potential amplitudes in the S/[F1/s/F2/s ]n/F1/S structure for the P and


Biomimetic synthesis of Ag-coated glasswing butterfly arrays as ultra-sensitive SERS substrates for efficient trace detection of pesticides
Beilstein J. Nanotechnol. 2019, 10, 578–588, doi:10.3762/bjnano.10.59

- ). (a) FE-SEM images of Ag-G.b.-20 SERS substrate (the region in the red circle is the selected area used in the 3D-FDTD simulation). (b) Simulation model Ag-G.b.-20 SERS substrate. (c) The spatial distribution of the electromagnetic field intensity simulation results. (a) Raman spectra of 10−4 M CV


Study of silica-based intrinsically emitting nanoparticles produced by an excimer laser
Beilstein J. Nanotechnol. 2019, 10, 211–221, doi:10.3762/bjnano.10.19

- information that was not possible to obtain in [18]. Figure 4f illustrates the CL mapping of the same group of nanoparticles. The comparison with the SEM image (Figure 4a) provides evidence for a correspondence between the CL signal and the spatial distribution of the nanoparticles. Indeed, regions containing
- the EDX analysis providing evidence of the essential correspondence between the morphology and the spatial distribution of the Ge, Si and O content independent from the energy per pulse. Such results suggest that the produced nanoparticles should be constituted of Ge/Si dioxide. The fact that we


Femtosecond laser-assisted fabrication of chalcopyrite micro-concentrator photovoltaics
Beilstein J. Nanotechnol. 2018, 9, 3025–3038, doi:10.3762/bjnano.9.281
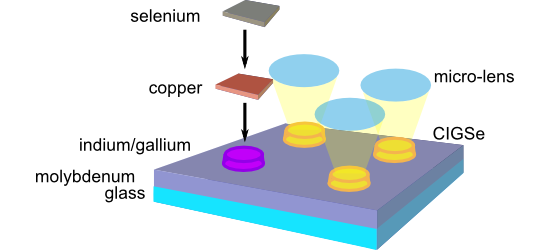
- -structured substrates. Indium has a strong tendency towards island growth during physical vapor deposition (PVD) on molybdenum substrates. On smooth molybdenum surfaces, indium islands nucleate with random spatial distribution. Indium prefers to accumulate on rough areas. Hence, preferential island


Size limits of magnetic-domain engineering in continuous in-plane exchange-bias prototype films
Beilstein J. Nanotechnol. 2018, 9, 2968–2979, doi:10.3762/bjnano.9.276

- ionic effects [6]. The change of the spatial distribution of the charge contrast, when varying from 0° (Figure 1a) to 90° (Figure 1d), results from the transition of monopolar to bipolar magnetic charge states. This is associated with a decrease of the charge contrast in the center of the DWs. The
- simulations was set for or a maximum step number of 2 × 10⁵ iterations. Appendix SRIM simulations of the ion energy loss distribution: To determine the distribution of ions and the spatial distribution of the transferred energy in the sample, simulations using the SRIM software framework have been performed


![[Graphic 63]](/bjnano/content/inline/2190-4286-9-276-i63.svg?max-width=637&scale=1.18182) .
. ![[Graphic 64]](/bjnano/content/inline/2190-4286-9-276-i64.svg?max-width=637&scale=1.18182) is the angle between the domain wall (DW) normal vector
is the angle between the domain wall (DW) normal vector ![[Graphic 65]](/bjnano/content/inline/2190-4286-9-276-i65.svg?max-width=637&scale=1.18182) and the local unidirectio...
and the local unidirectio...
Site-controlled formation of single Si nanocrystals in a buried SiO2 matrix using ion beam mixing
Beilstein J. Nanotechnol. 2018, 9, 2883–2892, doi:10.3762/bjnano.9.267

- uncertainty is represented by the standard deviation of NC diameter) and an in-plane spacing between the NCs of approximately 12 nm is obtained. Ion beam mixing by focused beam irradiation To realize a single Si NC instead of a 2D array of NCs, the spatial distribution of the mixed material has to be


Charged particle single nanometre manufacturing
Beilstein J. Nanotechnol. 2018, 9, 2855–2882, doi:10.3762/bjnano.9.266

- ): Equation 3 was fitted to the experimental results as shown in Figure 8e, giving a standard deviation of β = 67 nm for the spatial distribution of the backscattered energy for SHIBL, which is almost 50-times smaller than the corresponding EBL value. Thus, while there is some residual proximity effect in the
- parameters. Silvis-Cividjian [70] developed a Monte Carlo model for EBID, specifically for high-resolution deposits, taking into account the energy and spatial distribution of SEs. This elucidates the crucial role played by the SEs generated in the deposit itself in determining the final deposit size


Biomimetic surface structures in steel fabricated with femtosecond laser pulses: influence of laser rescanning on morphology and wettability
Beilstein J. Nanotechnol. 2018, 9, 2802–2812, doi:10.3762/bjnano.9.262

- many cases, ordered structures (namely ripples, grooves or spikes). The presence of these structures greatly influences the spatial distribution of the scattered light [26][28] and the coupling efficiency and propagation of surface plasmon polaritons. As a consequence, the spatial intensity


Contactless photomagnetoelectric investigations of 2D semiconductors
Beilstein J. Nanotechnol. 2018, 9, 2741–2749, doi:10.3762/bjnano.9.256

- , on the magnetic field as well as on the intensity and spatial distribution of illumination. The theoretical predictions agree with the results of the contactless investigations performed on non-suspended single-layer graphene. We use the contactless PME method for determining the dependence of
- illumination was determined using a Rigol Technologies DS1202CA oscilloscope. The spatial distribution of illumination (Figure 4b,c) was controlled using a beam diagnostics digital CCD camera LaserCam-HR II and BeamView version 4.8.1 software (Coherent). From this measurement, an effective diameter of 52 μm
- (86.5%) of the illumination beam was determined. The Gaussian fit (86.5%) coefficient of the spatial distribution of the light beam intensity was 0.988 (Figure 4b,c). The VPME voltage induced in the measuring coil was registered using an EG&G 5110 lock-in amplifier whose internal generator controlled

![[Graphic 1]](/bjnano/content/inline/2190-4286-9-256-i2.svg?max-width=637&scale=1.18182) evoked by the PME circulating current in a point-illuminated 2D...
evoked by the PME circulating current in a point-illuminated 2D...

![[Graphic 7]](/bjnano/content/inline/2190-4286-9-256-i8.svg?max-width=637&scale=1.18182) vs the illumination intensity for differe...
vs the illumination intensity for differe...

![[Graphic 15]](/bjnano/content/inline/2190-4286-9-256-i16.svg?max-width=637&scale=1.18182) vs the carrier lifetime for different values ...
vs the carrier lifetime for different values ...


Au–Si plasmonic platforms: synthesis, structure and FDTD simulations
Beilstein J. Nanotechnol. 2018, 9, 2599–2608, doi:10.3762/bjnano.9.241

- 200–1100 nm. Simulations of electromagnetic field propagation through the produced samples were performed using FDTD calculations [7][8]. The method allows one to find the spatial distribution of all components of electromagnetic field propagating through the investigated system, at selected time


Directional light beams by design from electrically driven elliptical slit antennas
Beilstein J. Nanotechnol. 2018, 9, 2361–2371, doi:10.3762/bjnano.9.221

- emitted upward than downward. Figure 8 shows that the flux of the Poynting vector integrated over the lower half space represents only 10–25% of the total radiation (i.e., integrated over 4π sr). Field distribution in the slit Finally, we calculate the theoretical spatial distribution of the square
- in the slit. (a–f) Spatial distribution of the square modulus of the total electric field |E|2 = |Ex|2 + |Ey|2 + |Ez|2 and of its components |Ex|2 and |Ey|2 along the x- and y-axes, as calculated inside the slit of structures 1 (circular) and 7 (elliptical, see Table 1). The excitation is modeled as
- beams on the air side, since the speed of photons in air, and of SPPs on an air–gold interface are similar. In contrast, the light beam emitted in glass must have an elliptical section. This is not directly visible in the Fourier-space images since they reveal the angular, and not the spatial


Two-dimensional photonic crystals increasing vertical light emission from Si nanocrystal-rich thin layers
Beilstein J. Nanotechnol. 2018, 9, 2287–2296, doi:10.3762/bjnano.9.213

- × 1017cm−2 was used in order to reach the desired refractive index value. The SiNC-rich layers were ca. 800 nm thick and exhibited an asymmetric Gaussian spatial distribution of SiNCs. The final values of the refractive index within the structure were extracted from the transmission measurement by
- carefully fitting the Fabry–Perot resonances in the transmission spectra. The distribution of refractive index naturally follows the spatial distribution of SiNCs and therefore it can be approximated by an asymmetric Gaussian function. The spatial profile of the refractive index is schematically depicted by
- the red line in Figure 1a. It peaks at around 600 nm below the surface with a value of 1.51, which perfectly fulfills the requirement imposed by the simulation. We would like to note that the spatial distribution of the refractive index has already been included in the simulation discussed above. The


High-throughput synthesis of modified Fresnel zone plate arrays via ion beam lithography
Beilstein J. Nanotechnol. 2018, 9, 2049–2056, doi:10.3762/bjnano.9.194

- . Figure 2b and Figure 2c show some hard Au grains remained relatively unharmed by the ion beam due to the strong dependence of the ion beam damage on the crystal orientation concerning anisotropic sputter yield and channeling effects [42]. These grains have a random spatial distribution, which renders


Tunable fractional Fourier transform implementation of electronic wave functions in atomically thin materials
Beilstein J. Nanotechnol. 2018, 9, 1828–1833, doi:10.3762/bjnano.9.174

- boundary conditions by patterned electrodes and/or gate electrodes, such as encountered in 2DEG electron-optics experiments (see [18] for a review). Alternatively, nonintentional potential inhomogeneities within the sample can influence the spatial distribution of the wave function. On the other hand


