Abstract
An anatase TiO2 material with hierarchically structured spheres consisting of ultrathin nanosheets with 100% of the [001] facet exposed was employed to fabricate dye-sensitized solar cells (DSCs). Investigation of the electron transport and back reaction of the DSCs by electrochemical impedance spectroscopy showed that the spheres had a threefold lower electron recombination rate compared to the conventional TiO2 nanoparticles. In contrast, the effective electron diffusion coefficient, Dn, was not sensitive to the variation of the TiO2 morphology. The TiO2 spheres showed the same Dn as that of the nanoparticles. The influence of TiCl4 post-treatment on the conduction band of the TiO2 spheres and on the kinetics of electron transport and back reactions was also investigated. It was found that the TiCl4 post-treatment caused a downward shift of the TiO2 conduction band edge by 30 meV. Meanwhile, a fourfold increase of the effective electron lifetime of the DSC was also observed after TiCl4 treatment. The synergistic effect of the variation of the TiO2 conduction band and the electron recombination determined the open-circuit voltage of the DSC.
Introduction
In the past two decades, dye-sensitized solar cells (DSCs) have received substantial attention from both academic and industrial communities as one of the most promising low-cost, high-efficiency third-generation photovoltaic devices [1,2]. A typical DSC consists of a dye-coated TiO2 electrode, which is deposited on a fluorine-doped tin oxide (FTO) conductive-glass substrate, a I−/I3− redox-couple-based electrolyte and a platinum counter electrode. Upon illumination, a photon with high energy (higher than the energy difference between the HOMO and LUMO level of the dye molecule) excites an electron from the ground state of the dye molecule to its excited state. The electron is then injected to the conduction band of the adjacent TiO2 material, owing to a favorable alignment of the energetics. The electron goes through a series of trapping/detrapping process in the TiO2 film before reaching the current collector, which is based on the conductive fluorine-doped tin oxide (FTO) substrate. Meanwhile, a parallel reaction, which involves transfer of the hole from the oxidized state of the dye (dye+) to the surrounding I− ions of the redox couple of the electrolyte, occurs to regenerate the dye molecule, resulting in the formation of I3− ions. The electrical circuit is completed through transfer of the electron, which arrives at the Pt counter electrode through the external circuit, to the I3− ions of the electrolyte.
Apparently, the operation of a DSC depends on several reactions that occur at the interface between different materials [3]. In particular, the process of electron injection at the TiO2/dye interface and the electron recombination reaction at the TiO2/dye/electrolyte interface are critical because they control both the short-circuit current and open-circuit voltage of the DSC. The surface properties of the TiO2 material play an important role in both processes. The process of electron injection in DSCs is controlled by the energy difference between the conduction band of the TiO2 material and the LUMO level of the dye, and the process of electron recombination is mainly dominated by the interaction between the electron at the surface of TiO2 and I3− ions in the electrolyte. Generally, the TiO2 used in DSCs is based on the anatase phase with the [101] facet exposed, due to the robust stability of this surface compared to other crystal facets [4]. It has been reported that the average surface energies of the different facets of anatase TiO2 lie in the order of [001] (0.90 J/m2) > [100] (0.53 J/m2) > [101] (0.44 J/m2) [5]. Apparently, the lowest surface energy of the [101] facet is the most stable surface of the TiO2 material. However, with the progress in synthesis techniques, other active facets of TiO2 crystals, such as [001], which is normally unstable due to a higher surface energy, can now be made [6]. In practice, TiO2 material with a large percentage of [001] high-energy surface has shown superior performance in applications such as water splitting and lithium-ion batteries [6-8]. Further investigation shows that the [001] surface is more beneficial to the photooxidization process through the O− centers compared to the [101] surface, which contains more Ti3+ centers [9].
The different surface properties of the [001] and [101] facets of TiO2 are expected to have a profound effect on the chemicophysical processes in DSCs as well. Fan et al. reported that the [001] surface can absorb more dye molecules compared to the [101] surface [10]. However, the influence of the TiO2 [001] facet on the kinetics of electron transfer and back reaction has not been reported. A deep understanding of the role of the TiO2 [001] facet in these key processes of electron transport and recombination of DSCs is of great importance for both practical applications and basic research.
In this work, anatase TiO2 spheres with a hierarchical structure consisting of ultrathin nanosheets with 100% of the [001] facet exposed were synthesized and applied in dye-sensitized solar cells (DSCs). The photovoltaic performance of the DSCs with different concentrations of the hierarchically structured TiO2 spheres was evaluated. The kinetics of electron transport and back reaction of the DSCs with the spheres were investigated by electrochemical impedance spectroscopy. In addition, the effect of treatment by an aqueous solution of TiCl4 on the performance of the DSCs with the TiO2 spheres was discussed.
Experimental
Synthesis of TiO2 nanosheet particles
Hierarchically structured TiO2 spheres of the nanosheets were synthesized by following the method originally reported by Chen et al. [6]. Briefly, a precursor solution containing titanium isopropoxide (Sigma-Aldrich; 1.15 mL) and diethylenetriamine (DETA; 0.02 mL) in 32 mL isopropanol was prepared by vigorous magnetic stirring of the mixture of the three components at room temperature. The precursor solution was then transferred to a Teflon-lined stainless steel autoclave (45 mL volume, Parr Instrument Co.) for the hydrothermal reaction. The hydrothermal process was carried out at 200 °C for 24 h in an electric oven. After that, the autoclave was allowed to cool to room temperature naturally. The as-collected white powder was washed with deionized water and then ethanol several times to remove the organic residues. The powder was then dried at 80 °C for 5 h and finally sintered at 400 °C for 3 h to improve the crystallinity.
Fabrication of TiO2 paste
TiO2 pastes for the DSCs were fabricated by mixing methylcellulose (Mw = 20,000), α-terpinol and the as-prepared TiO2 powder in a controlled amount, by using magnetic stirring at 80 °C for 48 h. Two sets of paste with different concentrations of the TiO2 powder were prepared. Paste A contained 13 wt % TiO2 powder, 2.6 wt % methylcellulose and 84.4 wt % α-terpinol. Paste B contained 25 wt % TiO2 powder, 2.5 wt % methylcellulose and 72.5 wt % α-terpinol. A commercial TiO2 paste (DSL-18-NR, Dyesol) consisting of anatase TiO2 nanoparticles with an average size of 20 nm was employed for comparison.
Assembly of dye-sensitized solar cells
The procedure for the fabrication of the dye-sensitized solar cells was reported in our previous work [11,12]. Briefly, a substrate based on fluorine-doped tin oxide (FTO) conductive glass (TEC15, Pilkington) was thoroughly washed with detergent water, distilled water, acetone, isopropanol and ethanol in sequence under sonication for 15 min. The cleaned FTO substrate was first coated with a compact layer of TiO2 film by spray pyrolysis to reduce the electron back reaction at the interface between the bare FTO and the electrolyte. The substrate was then deposited with the as-prepared TiO2 paste or the commercial paste by a doctor-blading method using adhesive tape as a spacer to control the thickness of the film. The TiO2 film was dried on a hotplate at 90 °C for 10 min before being sintered at 450 °C for 30 min to form a mesoporous structure. The average thickness of the TiO2 film was 13 μm. TiCl4 post-treatment of the TiO2 film was carried out by immersing the sintered film in TiCl4 aqueous solution (40 mM) at 70 °C for 30 min. The film was washed with distilled water thoroughly and blow dried with N2 gas. The film was then resintered at 450 °C for 30 min. The geometrical area of the TiO2 film was 0.25 cm2.
The TiO2 film (with or without TiCl4 treatment) when it was still warm (around 80 °C) was immersed in a dye solution containing 0.25 mM cis-bis(isothiocyanato) bis(2,2´- bipyridyl-4,4´-dicarboxylate) ruthenium(II) bis-tetrabutylammonium (N719, Dyesol) in ethanol for 16 h to form a dye-coated photoanode. A platinum counter electrode was prepared by dropping 5 μL isopropanol solution containing H2PtCl6·6H2O (5 mM) onto a cleaned FTO substrate (1.5 × 1.0 cm2). After being allowed to dry in air, the substrate was then sintered at 390 °C for 15 min in an electric oven to form a thin Pt layer on the FTO substrate. A dye-sensitized solar cell was assembled by sealing the dye-coated TiO2 electrode with the platinum-coated FTO counter electrode by using a thermal plastic (Surlyn 1705) at 130 °C. The electrolyte composed of 0.6 M 1-propyl-3-methylimidiazolium iodide, 0.05 M I2, 0.1 M guanidinium thiocyanate, 0.2 M NaI, 0.1 M N-methyl benzimidazole in 3-methoxypropionitrile was introduced into the space between the electrodes through the holes that were predrilled in the Pt counter electrode by a vacuum-assisted technique. The holes were then sealed by using a Surlyn film covered with a microscope slip.
Characterization
The morphology and the crystal structure of the as-prepared TiO2 powder were investigated by scanning electron microscope (SEM, FEI Quanta 200) and powder X-ray diffraction (XRD, PANanalytical Xpert Pro), respectively. Transmission electron microscopy (TEM, Philips CM 200) was used to monitor the detailed structure of the TiO2 powder. The thickness of the TiO2 films for the DSCs was determined by a profilometer (Dektak 150). The photocurrent density–voltage (J–V) characteristics of the DSCs were obtained by using a Xe lamp (150 W) based solar simulator (Newport), by recording the current produced by the cells as a function of the applied bias under AM1.5 illumination (100 mW/cm2) with a computer-controlled digital source meter (Keithley 2420). The illumination intensity of the incident light from the solar simulator was measured with a silicon photodiode, which was calibrated with an optical meter (1918-C, Oriel). Aluminum foil with a size comparable to the active area of the TiO2 film was used as a reflector on the counter electrode side of the DSCs during the J–V measurement.
The electrochemical impedance spectroscopy (EIS) of the DSCs was measured in the frequency range of 50,000–0.1 Hz at room temperature by a Versa-stat 3 electrochemical workstation (Princeton Applied Research). The EIS measurement was carried out under illumination, which was provided by a light emitting diode (LED, 627 nm) at open-circuit. The intensity of the incident illumination on the front side of the DSC (TiO2 side) was adjusted by using a combination of neutral density filters. The EIS spectrum was analyzed with a Zview software, by using a transmission-line-based equivalent circuit to obtain the information of chemical capacitance, electron-recombination resistance and electron-transport resistance of the DSCs [12,13].
Results and Discussion
Figure 1a shows the image of the as-prepared TiO2 powder by SEM. The material consists of microsized particles with spherical shape. The surface of the sphere is very rough and appears fluffy. The diameter of the sphere is around 1.6 μm as determined by TEM (Figure 1b). TEM images (Figure 1b, Figure 1c) also illustrate that the sphere has a substructure, which consists of ultrathin nanosheets packed together. It is speculated that the sphere is formed through self-assembly of the nanosheets to realize a minimum surface energy. Some spheres have pits on the surface, which may be due to the insufficient reaction duration. The measurement of the N2 adsorption/desorption isotherms of the TiO2 powder shows that the specific surface area of the TiO2 spheres is 82 m2/g, which is slightly higher than the specific surface area of the film made from the commercial TiO2 paste (DSL-18NR, Dyesol. Surface area: 72.9 m2/g) [14]. The large surface area of the material suggests that the nanosheets are probably loosely packed such that a greater surface area is exposed. The XRD pattern of the material (Figure 1d) shows that the as-prepared TiO2 powder is anatase with a tetragonal structure and space group I41/amd (JCPDS card, No. 71-1169). Both the TEM images and the XRD results are in good agreement with the results reported by Chen et al. According to Chen et al., the TiO2 spheres synthesized by this method have 100% of the [001] surface exposed [6].
![[2190-4286-3-44-1]](/bjnano/content/figures/2190-4286-3-44-1.png?scale=2.0&max-width=1024&background=FFFFFF)
Figure 1: Images of TiO2 particles by SEM (a) and by TEM (b, c) as well as XRD pattern of the TiO2 particles (d) and morphology of the TiO2 film consisting of the as-prepared sphere particles (e, f).
Figure 1: Images of TiO2 particles by SEM (a) and by TEM (b, c) as well as XRD pattern of the TiO2 particles ...
The SEM image of the TiO2 film consisting of the spheres is shown in Figure 1e and Figure 1f. Apparently, the TiO2 particles are connected to each other in the film. Figure 1f shows that the film contains a large number of small pores. However, the sphere of the TiO2 particles is rarely seen in the film. This indicates that the mechanical force of grinding and sonication employed in the preparation of the film broke up the spheres into small particles, probably in the form of nanosheets. Nevertheless, the same XRD pattern of the sintered TiO2 film (not shown) indicates that the film has the same surface properties as the spheres.
J–V characteristics of the DSCs
The J–V characteristics of the DSCs with the TiO2 film made from paste A, which contained 13 wt % TiO2 spheres with and without TiCl4 post-treatment, is shown in Figure 2a. The DSC solely based on paste A without TiCl4 treatment (curve A) produced a short-circuit current density (Jsc) of 8.79 mA/cm2 and open-circuit voltage (Voc) of 0.76 V. In contrast, when the TiO2 film was subjected to TiCl4-solution treatment, the Jsc of the DSC (curve B) increased to 12.1 mA/cm2, which is 37.5% higher than that of curve A.
![[2190-4286-3-44-2]](/bjnano/content/figures/2190-4286-3-44-2.png?scale=2.0&max-width=1024&background=FFFFFF)
Figure 2: J–V characteristics of the dye-sensitized solar cells made from paste A containing 13 wt % TiO2 spheres (a) and from paste B containing 25 wt % spheres (b) with (curve B and D) and without (curve A and C) TiCl4 treatment.
Figure 2: J–V characteristics of the dye-sensitized solar cells made from paste A containing 13 wt % TiO2 sph...
Figure 2b shows the J–V performance of the DSCs made from paste B, which contained 25 wt % as-prepared TiO2 nanosheet-based particles. The Jsc of the cell was 15.6 mA/cm2 and Voc = 0.70 V (Figure 2b, curve C) when there was no TiCl4 treatment. Compared to curve A, it was found that the ratio of the Jsc of curve C to that of curve A ((15.6 mA/cm2)/(12.1 mA/cm2) = 1.77) is very close to the ratio of the concentration of the TiO2 spheres in the two pastes ((TiO2 wt % in paste B)/(TiO2 wt % in paste A) = 25/13 = 1.92). This suggests that the higher Jsc of the DSC made from paste B is due to the availability of more TiO2 particles in the film, which can absorb more dye molecules, leading to a stronger light absorption. The Jsc of the DSC made from paste B was further increased from 15.6 mA/cm2 (Figure 2b, curve C) to 18.2 mA/cm2 when the TiO2 film was processed with TiCl4 solution (Figure 2b, curve D). Meanwhile, the Voc of curve D was 20 mV higher than that of curve C, suggesting a beneficial effect of the TiCl4 post-treatment on Voc as well. The best performance was obtained in the case of curve D with power conversion efficiency = 7.57% (Figure 2b), which is comparable to the efficiency (η = 7.52%) of the DSCs made from the commercial paste (I–V curve is not shown). The detailed characteristic parameters of the performance of the DSCs with different TiO2 pastes are shown in Table 1.
Table 1: Characteristic performance parameters of the dye-sensitized solar cells.
| cell name | Jsc (mA/cm2) | Voc (V) | FF | efficiency (%) |
|---|---|---|---|---|
| 13 wt % TiO2 nanosheet (curve A) | 8.79 | 0.757 | 0.700 | 4.66 |
| 13 wt % TiO2 nanosheet with TiCl4 treatment (curve B) | 12.07 | 0.754 | 0.646 | 5.88 |
| 25 wt % TiO2 nanosheet (curve C) | 15.60 | 0.700 | 0.610 | 6.66 |
| 25 wt % TiO2 nanosheet with TiCl4 treatment (curve D) | 18.20 | 0.720 | 0.580 | 7.57 |
| DSC made from TiO2 nanoparticles | 16.50 | 0.755 | 0.604 | 7.52 |
Electrochemical impedance spectroscopy
Information on the charge-transfer and charge-transport process in DSCs can be measured by small-perturbation-based transient methods, such as electrochemical impedance spectroscopy (EIS) or intensity modulated photocurrent spectroscopy (IMPS) and intensity modulated photovoltage spectroscopy (IMVS) [13,15]. Compared to IMPS and IMVS, the advantage of the EIS method for characterization of DSCs lies in the fact that both the effective electron lifetime, τn, and the effective electron diffusion coefficient, Dn, can be obtained in one measurement. This is achieved by fitting the EIS spectrum using a suitable equivalent circuit that mimics the physical process in the device. The equivalent circuit that depicts the process of electron trapping/detrapping in DSCs is shown in Figure 3a. It contains a series resistance, Rs, a capacitance at the Pt electrode/electrolyte interface, CPt, and a resistance for the charge-transfer process between electrons at the Pt electrode and I3− ions of the electrolyte, RPt. Zw is the Warburg resistance arising from the ion transport in the electrolyte and Ztl is a distribution line describing the electron transport and recombination in the mesoporous TiO2 film [13,16]. A typical EIS spectrum of a DSC is shown in Figure 3b for the Nyquist plot and Figure 3c for the Bode plot. The corresponding fitting results (green line) using the equivalent circuit are also shown in Figure 3b and Figure 3c. The distorted semicircle in the high frequency range (above 10 Hz) is ascribed to the electron transfer process at the interface of Pt counter electrode/electrolyte combined with the electron-transport process in the TiO2 film (the semicircle corresponding to the electron transport process in TiO2 is buried in the semicircle of the charge-transfer process at the Pt/electrolyte interface in the spectrum) [3]. The large semicircle in the lower frequency range (10–0.1 Hz) is due to the electron recombination process in the TiO2 film. Under a high incident illumination intensity, the density of the photogenerated electron in the TiO2 film is very high (up to 1018/cm3) and the TiO2 film becomes conductive [17]. In this case, the resistance corresponding to the electron-transport process becomes too small to be observed in the EIS spectrum. Consequently, the EIS spectrum is mainly dominated by the electron recombination process. Nevertheless, under low incident illumination intensity, the conductivity of the TiO2 film is very low due to a low density of photogenerated electrons. In this case, the main feature of the EIS spectrum is due to the transport of electrons in the TiO2 film. Hence, an accurate fitting of the EIS spectrum of a DSC using the equivalent circuit is normally obtained in the illumination range in which both the electron-transport resistance and the electron-recombination resistance are substantial [13]. Only the results of good fits are shown in this work.
![[2190-4286-3-44-3]](/bjnano/content/figures/2190-4286-3-44-3.png?scale=2.0&max-width=1024&background=FFFFFF)
Figure 3: Equivalent circuit (a) and the Nyquist plot (b) and Bode plot (c) of the impedance spectrum of a dye-sensitized solar cell.
Figure 3: Equivalent circuit (a) and the Nyquist plot (b) and Bode plot (c) of the impedance spectrum of a dy...
Comparison of electron transport and recombination of the DSC based on TiO2 spheres and nanoparticles
The electron-recombination process in DSCs is reflected by the effective electron lifetime, τn, whereas the electron-transport process is manifested by the effective electron diffusion coefficient Dn. Bisquert et al. showed that both τn and Dn of a DSC are dependent on the distribution of the density of electrons in the conduction band (free electron) and in the trap states (trapped electron) of the TiO2 film as well as the lifetime and diffusion coefficient of free electron (τ0 and D0), through the following consideration:
![[2190-4286-3-44-i1]](/bjnano/content/inline/2190-4286-3-44-i1.svg?max-width=590&scale=1.18182)
and
![[2190-4286-3-44-i2]](/bjnano/content/inline/2190-4286-3-44-i2.svg?max-width=590&scale=1.18182)
where nt and nc are the densities of the trapped electron and free electron, respectively [18].
The charge distribution, g(E), in a mesoporous TiO2 film is described by [18,19]:
![[2190-4286-3-44-i3]](/bjnano/content/inline/2190-4286-3-44-i3.svg?max-width=590&scale=1.18182)
where nEF is the quasi Fermi level of TiO2, Ec the conduction band of TiO2, EF,redox the potential energy of the redox couple, Nt,0 the total density of the trapped electrons, kB is the Boltzmann constant and T0 the characteristic temperature that reflects the profile of the charge distribution in TiO2.
Therefore, comparison of the change of τn and Dn in DSCs due to the different material composition should be made by using the density of charge as the reference, provided that the distribution profile of charge density is the same [20].
The density of charge in the TiO2 film is reflected by the chemical capacitance, Cμ, which is measured by EIS, through the relationship [18]:
![[2190-4286-3-44-i4]](/bjnano/content/inline/2190-4286-3-44-i4.svg?max-width=590&scale=1.18182)
where Ev is the valence band of TiO2. Thus, we employ the density of chemical capacitance as a reference for the investigation of the variation of τn and Dn in the following.
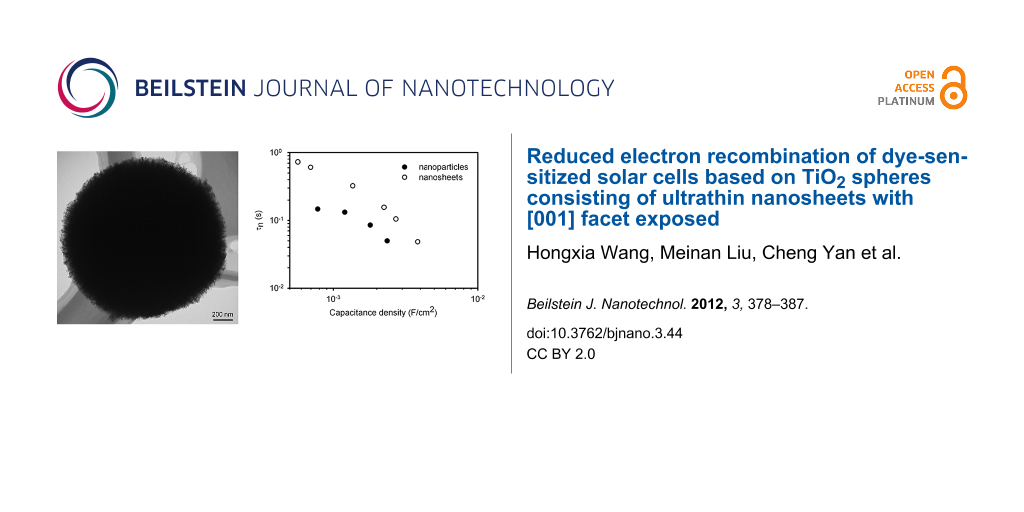
Figure 4a shows the τn of the DSCs with the TiO2 films consisting of the nanosheet-based spheres and the conventional nanoparticles as a function of the chemical capacitance density. It is found the τn of the nanosheets based DSC is nearly threefold higher than that of the nanoparticles for a constant capacitance density. This suggests that the TiO2 film with the spheres has a lower electron-recombination reaction rate compared to the film with the nanoparticles. Besides τn, the effective electron diffusion coefficient, Dn, is another important parameter that determines the performance of a DSC. The comparison of the Dn of the cell based on the spheres and the nanoparticles is shown in Figure 4b. It is interesting that both materials show the same Dn, suggesting that the electron transport is not affected by the morphology and the exposed crystal facet of the TiO2 material. The identical Dn also suggests that the diffusion coefficient of the free electron is the same for the two materials, according to Equation 2 [13]. It also justifies the assumption that the profile of the distribution of charge density is the same in the two types of TiO2 film. In contrast, the different τn suggests that the free-electron lifetime of the spheres is different to that of the nanoparticles. The high τn of the spheres could be related to the properties of the [001] facet, but clarification of this issue requires further investigation. As a consequence, the electron diffusion length, Ln, which depends on both the τn and Dn by ![[Graphic 1]](/bjnano/content/inline/2190-4286-3-44-i5.svg?max-width=637&scale=1.18182) , is up to 1.6-fold higher for the nanosheet-based TiO2 spheres compared to that of the nanoparticles (Figure 4c). It is found that the Ln of the DSC based on the nanoparticles is only around 16 μm (Figure 4c), which is comparable to the thickness of the TiO2 film (13 μm). A previous study has shown that the Ln of a DSC needs to be at least three times the thickness of the TiO2 film in order to collect most of the photogenerated electrons [13]. Therefore, the short Ln may limit the performance of the DSC. The higher Ln of the spheres-based DSC should lead to a higher electron collection efficiency compared to its nanoparticles counterpart.
, is up to 1.6-fold higher for the nanosheet-based TiO2 spheres compared to that of the nanoparticles (Figure 4c). It is found that the Ln of the DSC based on the nanoparticles is only around 16 μm (Figure 4c), which is comparable to the thickness of the TiO2 film (13 μm). A previous study has shown that the Ln of a DSC needs to be at least three times the thickness of the TiO2 film in order to collect most of the photogenerated electrons [13]. Therefore, the short Ln may limit the performance of the DSC. The higher Ln of the spheres-based DSC should lead to a higher electron collection efficiency compared to its nanoparticles counterpart.
![[2190-4286-3-44-4]](/bjnano/content/figures/2190-4286-3-44-4.png?scale=2.0&max-width=1024&background=FFFFFF)
Figure 4: Comparison of the effective electron lifetime, τn, (a) and effective electron diffusion coefficient, Dn, (b) and electron diffusion length, Ln, (c) of the DSCs with TiO2 nanosheets (open circle) and with conventional nanoparticles (solid circle). (d) Variation of the chemical capacitance density of the nanosheets and nanoparticles as a function of voltage.
Figure 4: Comparison of the effective electron lifetime, τn, (a) and effective electron diffusion coefficient...
Besides Jsc, Voc is another key performance parameter of a DSC. The maximum voltage of a DSC is determined by the potential difference between the conduction band of TiO2 and the redox potential of I−/I3− in the electrolyte. Obviously, the position of the TiO2 conduction band edge, Ec, has a direct impact on the open-circuit voltage (Voc) of the DSC. Thus, it is important to know the relative position of the Ec of the nanosheet-based spheres relative to the nanoparticles in order to determine the reason for the different Voc. According to Equation 3, the change of Ec of TiO2 can be monitored by the variation of the voltage (V) of the DSC at a constant electron density.
As shown in Figure 4d, the Ec of the nanosheet-based spheres is found to be 100 meV lower than that of the nanoparticles. The lower Ec of the spheres is probably due to the different dye loading on the TiO2 films. According to Fan et al. [10], the TiO2 [001] facet can absorb more dye than the [101] facet. Nazeeruddin et al. confirmed that the dye molecule is adsorbed on TiO2 particles mainly through the carboxylic acid group (–COOH) [4], leading to the protonation of the surface of TiO2 and the downward shift of the Ec. The more dye molecules are adsorbed on the TiO2 film, the more downward shift is expected for the Ec.
Effect of TiCl4 treatment
The strategy of treating TiO2 mesoporous films with TiCl4 aqueous solution has been extensively employed to improve the performance of DSCs. In most cases, it is found that the Jsc of the DSC is enhanced, while the Voc is reduced after the TiCl4 treatment of the film. O’Regan et al. found that TiCl4 treatment caused 80 meV downward shift of the TiO2 conduction band, resulting in an increased driving force for the electron-injection process. They reported that the enhanced Jsc was owing to an improved electron-injection efficiency of the DSC [21,22]. In the following section, the influence of the TiCl4 solution treatment on the Ec of the TiO2-spheres-based film and on the kinetics of electron transport and back reaction of the corresponding DSCs is investigated.
Figure 5a illustrates the chemical capacitance density of the DSCs made from paste B with and without TiCl4 treatment, as a function of the voltage. It is found that, at a constant charge density, the voltage of the cell with TiCl4 treatment is lower than that of the DSC without the treatment. The maximum difference in voltage between the cells is around 30 mV. Provided that the distribution profile of the charge density is the same for the TiO2 film with and without TiCl4 treatment, the reduced potential of the DSC with TiCl4 treatment means that the TiCl4 treatment caused a downward shift of the TiO2 conduction band by 30 meV, which may decrease the maximum voltage the DSC can achieve. This observation is in good agreement with the results reported by O’Regan et al. [21]. However, the Voc of the cell with TiCl4 treatment is actually 20 mV higher than the DSC without the treatment, as shown in Figure 2b. This indicates that the electron recombination of the DSC is probably affected by the TiCl4 treatment.
![[2190-4286-3-44-5]](/bjnano/content/figures/2190-4286-3-44-5.png?scale=2.0&max-width=1024&background=FFFFFF)
Figure 5: Comparison of dye-sensitized solar cells based on hierarchically structured TiO2 spheres with and without TiCl4 post-treatment. (a) Chemical capacitance vs voltage; (b) effective electron lifetime, τn, as a function of density of chemical capacitance; (c) effective electron diffusion coefficient, Dn, as a function of density of chemical capacitance; and (d) electron diffusion length, Ln as a function of voltage.
Figure 5: Comparison of dye-sensitized solar cells based on hierarchically structured TiO2 spheres with and w...
Figure 5b shows the τn as a function of capacitance density of the DSC with and without TiCl4 treatment. It is found that τn is enhanced by a factor of 3.8 after TiCl4 treatment. In contrast, Dn of the DSCs is relatively unchanged with the TiCl4 treatment (Figure 5c). Owing to the enhanced τn, the electron diffusion length, Ln, of the DSC is enhanced by a factor of two through TiCl4 treatment (Figure 5d). Hence, the improved voltage (20 mV) of the DSC (Figure 2b, curve D) with TiCl4 treatment compared to the cell without TiCl4 treatment (curve C in Figure 2b) should be a result of a synergistic effect of the decreased TiO2 conduction band and the increased electron lifetime. Apparently, the beneficial effect of the enhanced electron lifetime on Voc surpasses the negative effect of the downward shift of the Ec of TiO2, leading to a higher Voc.
Conclusion
Dye-sensitized solar cells with a TiO2 electrode made from hierarchically structured TiO2 spheres, consisting of nanosheets with 100% of the [001] facet exposed, were assembled and characterized in terms of the device performance, the kinetics of electron transport and back reaction. It was found that the TiO2-spheres-based DSCs generated an energy conversion efficiency of 7.57%, which is comparable to the conventional TiO2 nanoparticles. Investigation of the kinetics of electron transport and back reaction of the DSCs showed that the spheres had a threefold higher effective electron lifetime compared to the nanoparticles. However, the effective electron diffusion coefficient, Dn, of the DSCs was not affected by the different morphology and exposed crystal facets of the TiO2 material. Monitoring of the variation of the conduction band of the dyed TiO2 film disclosed that the Ec of the spheres-based TiO2 electrode was 100 meV lower than that of the nanoparticles.
This work also investigated the influence of treatment with TiCl4 aqueous solution on the Ec of the TiO2 spheres and on the τn and Dn of the corresponding DSCs. It was found that TiCl4 treatment caused a downward shift (30 meV) of the TiO2 conduction band and a fourfold increase of the τn, whereas the Dn of the cell was not significantly affected by the TiCl4 treatment.
References
-
O’Regan, B.; Grätzel, M. Nature 1991, 353, 737–740. doi:10.1038/353737a0
Return to citation in text: [1] -
Wang, H.; Li, H.; Xue, B.; Wang, Z.; Meng, Q.; Chen, L. J. Am. Chem. Soc. 2005, 127, 6394–6401. doi:10.1021/ja043268p
Return to citation in text: [1] -
Wang, H.; Bell, J.; Desilvestro, J.; Bertoz, M.; Evans, G. J. Phys. Chem. C 2007, 111, 15125–15131. doi:10.1021/jp075305f
Return to citation in text: [1] [2] -
Nazeeruddin, M. K.; Humphry-Baker, R.; Liska, P.; Grätzel, M. J. Phys. Chem. B 2003, 107, 8981–8987. doi:10.1021/jp022656f
Return to citation in text: [1] [2] -
Liu, M.; Chang, J.; Yan, C.; Bell, J. Int. J. Smart Nano Mater. 2012, 3, 72–80. doi:10.1080/19475411.2011.638345
Return to citation in text: [1] -
Chen, J. S.; Tan, Y. L.; Li, C. M.; Cheah, Y. L.; Luan, D.; Madhavi, S.; Boey, F. Y. C.; Archer, L. A.; Lou, X. W. J. Am. Chem. Soc. 2010, 132, 6124–6130. doi:10.1021/ja100102y
Return to citation in text: [1] [2] [3] [4] -
Yang, H. G.; Sun, C. H.; Qiao, S. Z.; Zou, J.; Liu, G.; Smith, S. C.; Cheng, H. M.; Lu, G. Q. Nature 2008, 453, 638–641. doi:10.1038/nature06964
Return to citation in text: [1] -
Zhu, J.; Wang, S.; Bian, Z.; Xie, S.; Cai, C.; Wang, J.; Yang, H.; Li, H. CrystEngComm 2010, 12, 2219–2224. doi:10.1039/c000128g
Return to citation in text: [1] -
D'Arienzo, M.; Carbajo, J.; Bahamonde, A.; Crippa, M.; Polizzi, S.; Scotti, R.; Wahba, L.; Morazzoni, F. J. Am. Chem. Soc. 2011, 133, 17652–17661. doi:10.1021/ja204838s
Return to citation in text: [1] -
Fan, J.; Cai, W.; Yu, J. Chem.–Asian J. 2011, 6, 2481–2490. doi:10.1002/asia.201100188
Return to citation in text: [1] [2] -
Wang, H.; Liu, M.; Zhang, M.; Wang, P.; Miura, H.; Cheng, Y.; Bell, J. Phys. Chem. Chem. Phys. 2011, 13, 17359–17366. doi:10.1039/C1CP22482D
Return to citation in text: [1] -
Villanueva-Cab, J.; Wang, H.; Oskam, G.; Peter, L. M. J. Phys. Chem. Lett. 2010, 1, 748–751. doi:10.1021/jz1000243
Return to citation in text: [1] [2] -
Wang, H.; Peter, L. M. J. Phys. Chem. C 2009, 113, 18125–18133. doi:10.1021/jp906629t
Return to citation in text: [1] [2] [3] [4] [5] [6] -
Samadpour, M.; Giménez, S.; Zad, A. I.; Taghavinia, N.; Mora-Seró, I. Phys. Chem. Chem. Phys. 2012, 14, 522–528. doi:10.1039/c1cp22619c
Return to citation in text: [1] -
Bisquert, J. J. Phys. Chem. B 2002, 106, 325–333. doi:10.1021/jp011941g
Return to citation in text: [1] -
Wang, H.; Nicholson, P. G.; Peter, L.; Zakeeruddin, S. M.; Grätzel, M. J. Phys. Chem. C 2010, 114, 14300–14306. doi:10.1021/jp105753k
Return to citation in text: [1] -
Nguyen, T. T. O.; Peter, L. M.; Wang, H. J. Phys. Chem. C 2009, 113, 8532–8536. doi:10.1021/jp901213f
Return to citation in text: [1] -
Bisquert, J.; Vikhrenko, V. S. J. Phys. Chem. B 2004, 108, 2313–2322. doi:10.1021/jp035395y
Return to citation in text: [1] [2] [3] -
Peter, L. M. J. Phys. Chem. C 2007, 111, 6601–6612. doi:10.1021/jp069058b
Return to citation in text: [1] -
Wang, H.; Peter, L. M. J. Phys. Chem. C 2012, in press. doi:10.1021/jp211807w
Return to citation in text: [1] -
O'Regan, B. C.; Durrant, J. R.; Sommeling, P. M.; Bakker, N. J. J. Phys. Chem. C 2007, 111, 14001–14010. doi:10.1021/jp073056p
Return to citation in text: [1] [2] -
Sommeling, P. M.; O'Regan, B. C.; Haswell, R. R.; Smit, H. J. P.; Bakker, N. J.; Smits, J. J. T.; Kroon, J. M.; van Roosmalen, J. A. M. J. Phys. Chem. B 2006, 110, 19191–19197. doi:10.1021/jp061346k
Return to citation in text: [1]
| 21. | O'Regan, B. C.; Durrant, J. R.; Sommeling, P. M.; Bakker, N. J. J. Phys. Chem. C 2007, 111, 14001–14010. doi:10.1021/jp073056p |
| 1. | O’Regan, B.; Grätzel, M. Nature 1991, 353, 737–740. doi:10.1038/353737a0 |
| 2. | Wang, H.; Li, H.; Xue, B.; Wang, Z.; Meng, Q.; Chen, L. J. Am. Chem. Soc. 2005, 127, 6394–6401. doi:10.1021/ja043268p |
| 6. | Chen, J. S.; Tan, Y. L.; Li, C. M.; Cheah, Y. L.; Luan, D.; Madhavi, S.; Boey, F. Y. C.; Archer, L. A.; Lou, X. W. J. Am. Chem. Soc. 2010, 132, 6124–6130. doi:10.1021/ja100102y |
| 13. | Wang, H.; Peter, L. M. J. Phys. Chem. C 2009, 113, 18125–18133. doi:10.1021/jp906629t |
| 16. | Wang, H.; Nicholson, P. G.; Peter, L.; Zakeeruddin, S. M.; Grätzel, M. J. Phys. Chem. C 2010, 114, 14300–14306. doi:10.1021/jp105753k |
| 5. | Liu, M.; Chang, J.; Yan, C.; Bell, J. Int. J. Smart Nano Mater. 2012, 3, 72–80. doi:10.1080/19475411.2011.638345 |
| 3. | Wang, H.; Bell, J.; Desilvestro, J.; Bertoz, M.; Evans, G. J. Phys. Chem. C 2007, 111, 15125–15131. doi:10.1021/jp075305f |
| 4. | Nazeeruddin, M. K.; Humphry-Baker, R.; Liska, P.; Grätzel, M. J. Phys. Chem. B 2003, 107, 8981–8987. doi:10.1021/jp022656f |
| 6. | Chen, J. S.; Tan, Y. L.; Li, C. M.; Cheah, Y. L.; Luan, D.; Madhavi, S.; Boey, F. Y. C.; Archer, L. A.; Lou, X. W. J. Am. Chem. Soc. 2010, 132, 6124–6130. doi:10.1021/ja100102y |
| 3. | Wang, H.; Bell, J.; Desilvestro, J.; Bertoz, M.; Evans, G. J. Phys. Chem. C 2007, 111, 15125–15131. doi:10.1021/jp075305f |
| 13. | Wang, H.; Peter, L. M. J. Phys. Chem. C 2009, 113, 18125–18133. doi:10.1021/jp906629t |
| 15. | Bisquert, J. J. Phys. Chem. B 2002, 106, 325–333. doi:10.1021/jp011941g |
| 6. | Chen, J. S.; Tan, Y. L.; Li, C. M.; Cheah, Y. L.; Luan, D.; Madhavi, S.; Boey, F. Y. C.; Archer, L. A.; Lou, X. W. J. Am. Chem. Soc. 2010, 132, 6124–6130. doi:10.1021/ja100102y |
| 12. | Villanueva-Cab, J.; Wang, H.; Oskam, G.; Peter, L. M. J. Phys. Chem. Lett. 2010, 1, 748–751. doi:10.1021/jz1000243 |
| 13. | Wang, H.; Peter, L. M. J. Phys. Chem. C 2009, 113, 18125–18133. doi:10.1021/jp906629t |
| 10. | Fan, J.; Cai, W.; Yu, J. Chem.–Asian J. 2011, 6, 2481–2490. doi:10.1002/asia.201100188 |
| 14. | Samadpour, M.; Giménez, S.; Zad, A. I.; Taghavinia, N.; Mora-Seró, I. Phys. Chem. Chem. Phys. 2012, 14, 522–528. doi:10.1039/c1cp22619c |
| 9. | D'Arienzo, M.; Carbajo, J.; Bahamonde, A.; Crippa, M.; Polizzi, S.; Scotti, R.; Wahba, L.; Morazzoni, F. J. Am. Chem. Soc. 2011, 133, 17652–17661. doi:10.1021/ja204838s |
| 6. | Chen, J. S.; Tan, Y. L.; Li, C. M.; Cheah, Y. L.; Luan, D.; Madhavi, S.; Boey, F. Y. C.; Archer, L. A.; Lou, X. W. J. Am. Chem. Soc. 2010, 132, 6124–6130. doi:10.1021/ja100102y |
| 7. | Yang, H. G.; Sun, C. H.; Qiao, S. Z.; Zou, J.; Liu, G.; Smith, S. C.; Cheng, H. M.; Lu, G. Q. Nature 2008, 453, 638–641. doi:10.1038/nature06964 |
| 8. | Zhu, J.; Wang, S.; Bian, Z.; Xie, S.; Cai, C.; Wang, J.; Yang, H.; Li, H. CrystEngComm 2010, 12, 2219–2224. doi:10.1039/c000128g |
| 11. | Wang, H.; Liu, M.; Zhang, M.; Wang, P.; Miura, H.; Cheng, Y.; Bell, J. Phys. Chem. Chem. Phys. 2011, 13, 17359–17366. doi:10.1039/C1CP22482D |
| 12. | Villanueva-Cab, J.; Wang, H.; Oskam, G.; Peter, L. M. J. Phys. Chem. Lett. 2010, 1, 748–751. doi:10.1021/jz1000243 |
| 18. | Bisquert, J.; Vikhrenko, V. S. J. Phys. Chem. B 2004, 108, 2313–2322. doi:10.1021/jp035395y |
| 17. | Nguyen, T. T. O.; Peter, L. M.; Wang, H. J. Phys. Chem. C 2009, 113, 8532–8536. doi:10.1021/jp901213f |
| 13. | Wang, H.; Peter, L. M. J. Phys. Chem. C 2009, 113, 18125–18133. doi:10.1021/jp906629t |
| 4. | Nazeeruddin, M. K.; Humphry-Baker, R.; Liska, P.; Grätzel, M. J. Phys. Chem. B 2003, 107, 8981–8987. doi:10.1021/jp022656f |
| 21. | O'Regan, B. C.; Durrant, J. R.; Sommeling, P. M.; Bakker, N. J. J. Phys. Chem. C 2007, 111, 14001–14010. doi:10.1021/jp073056p |
| 22. | Sommeling, P. M.; O'Regan, B. C.; Haswell, R. R.; Smit, H. J. P.; Bakker, N. J.; Smits, J. J. T.; Kroon, J. M.; van Roosmalen, J. A. M. J. Phys. Chem. B 2006, 110, 19191–19197. doi:10.1021/jp061346k |
| 13. | Wang, H.; Peter, L. M. J. Phys. Chem. C 2009, 113, 18125–18133. doi:10.1021/jp906629t |
| 10. | Fan, J.; Cai, W.; Yu, J. Chem.–Asian J. 2011, 6, 2481–2490. doi:10.1002/asia.201100188 |
| 18. | Bisquert, J.; Vikhrenko, V. S. J. Phys. Chem. B 2004, 108, 2313–2322. doi:10.1021/jp035395y |
| 13. | Wang, H.; Peter, L. M. J. Phys. Chem. C 2009, 113, 18125–18133. doi:10.1021/jp906629t |
| 18. | Bisquert, J.; Vikhrenko, V. S. J. Phys. Chem. B 2004, 108, 2313–2322. doi:10.1021/jp035395y |
| 19. | Peter, L. M. J. Phys. Chem. C 2007, 111, 6601–6612. doi:10.1021/jp069058b |
| 20. | Wang, H.; Peter, L. M. J. Phys. Chem. C 2012, in press. doi:10.1021/jp211807w |
© 2012 Wang et al; licensee Beilstein-Institut.
This is an Open Access article under the terms of the Creative Commons Attribution License (http://creativecommons.org/licenses/by/2.0), which permits unrestricted use, distribution, and reproduction in any medium, provided the original work is properly cited.
The license is subject to the Beilstein Journal of Nanotechnology terms and conditions: (http://www.beilstein-journals.org/bjnano)