Search results
Search for "array" in Full Text gives 400 result(s) in Beilstein Journal of Nanotechnology. Showing first 200.
Synthesis of highly active ETS-10-based titanosilicate for heterogeneously catalyzed transesterification of triglycerides
Beilstein J. Nanotechnol. 2019, 10, 2039–2061, doi:10.3762/bjnano.10.200


Review of advanced sensor devices employing nanoarchitectonics concepts
Beilstein J. Nanotechnol. 2019, 10, 2014–2030, doi:10.3762/bjnano.10.198

- an organic field-effect transistor, which was used for the sensitive detection of small organic acid molecules, such as citric acid [142]. Hattori and co-workers fabricated an ATP/ADP sensitive image sensor by immobilization of apyrase as a self-assembled monolayer on a 128 × 128 pixel array


Nanostructured and oriented metal–organic framework films enabling extreme surface wetting properties
Beilstein J. Nanotechnol. 2019, 10, 1994–2003, doi:10.3762/bjnano.10.196

- array of pillar-like structures with a cross-section of 20–30 nm and evident gaps between the pillars of about 150 nm for both samples (see Figure 2B,C). Cross-section SEM micrographs clearly visualize an array of vertically aligned MOF needles on the surface plane. In addition, a uniform film thickness


Porous silver-coated pNIPAM-co-AAc hydrogel nanocapsules
Beilstein J. Nanotechnol. 2019, 10, 1973–1982, doi:10.3762/bjnano.10.194

- delivery, biosensing, chemical separation, nanoscale reactors, and catalysis [31][32][33][34][35][36][37][38][39][40]. While these examples represent a vast array of potential applications using nanocapsules, one particularly interesting application involves the use of NIR-responsive metal nanoparticles to


Kelvin probe force microscopy work function characterization of transition metal oxide crystals under ongoing reduction and oxidation
Beilstein J. Nanotechnol. 2019, 10, 1596–1607, doi:10.3762/bjnano.10.155

- nanowire array embedded in an insulator matrix, and to properly disentangle the electronic properties of both structures a technique with nanoscale resolution is needed. Indeed with the use of the LC-AFM technique, the conductivity of the developed nanostructures at the nanoscale can be characterized
- influence the work function (WF) on the nanoscale. a) 3D view of the combined topography and the WF of TiO/SrTiO3. b,c) Topography and work function profiles of two areas on the same TiO nanowire. KPFM lateral resolution on high TiO/STO structures. a) Topography and b) work function of TiO nanowire array on


Materials nanoarchitectonics at two-dimensional liquid interfaces
Beilstein J. Nanotechnol. 2019, 10, 1559–1587, doi:10.3762/bjnano.10.153

- their lateral surface pressure at the air–water interface. The fabricated array structures of nanodisks can be also transferred to metal surfaces such as platinum surfaces. The examples demonstrated that the combination of rather ambiguous molecular interactions and transfer processes can create precise


Unipolar magnetic field pulses as an advantageous tool for ultrafast operations in superconducting Josephson “atoms”
Beilstein J. Nanotechnol. 2019, 10, 1548–1558, doi:10.3762/bjnano.10.152

- quantum (RSFQ) circuits. Namely, a Josephson transmission line realized as a parallel array of lumped Josephson junctions coupled by superconducting inductances was chosen as a control line supporting the flux to be quantized. One cell of the transmission line was magnetically coupled with the qubit so


Direct observation of oxygen-vacancy formation and structural changes in Bi2WO6 nanoflakes induced by electron irradiation
Beilstein J. Nanotechnol. 2019, 10, 1434–1442, doi:10.3762/bjnano.10.141

- an array mask. The masked pattern represents the filtered phase and the unmasked pattern represents the precipitates. Figure 3 shows a series of SAED patterns recorded after electron irradiation for up to 62 min. Note that prior to irradiation some very weak scattering signals (red circles in Figure


Fabrication of phase masks from amorphous carbon thin films for electron-beam shaping
Beilstein J. Nanotechnol. 2019, 10, 1290–1302, doi:10.3762/bjnano.10.128

- ). Pyramid-shaped trenches are generated beneath the thin films by anisotropic wet-etching of Si in a heated KOH solution (KOH + H2O in a ratio of 2:3, 80 °C, Figure 1a,c). The lithography mask was designed such that a 3 × 3 array of square-shaped SixNy thin films was produced on a single wafer (Figure 1b,c
- is not to scale as the SixNy windows and the Si wafer have a thickness of 120 nm and 200 µm, respectively. SEM images of the (b) top and (c) bottom surface reveal the 3 × 3 array of SixNy membranes and the pyramid-shaped trenches caused by anisotropic wet-etching of Si. The fabrication steps to


Green fabrication of lanthanide-doped hydroxide-based phosphors: Y(OH)3:Eu3+ nanoparticles for white light generation
Beilstein J. Nanotechnol. 2019, 10, 1200–1210, doi:10.3762/bjnano.10.119

- vary for each material depending on its chemistry), fast crystal growth takes place. This fast growth may force a high density of crystal defects, i.e., the atoms do not have enough time for placement in the crystal array and the metal atom misplacement may occur during the fast growth. These defects


Towards rare-earth-free white light-emitting diode devices based on the combination of dicyanomethylene and pyranine as organic dyes supported on zinc single-layered hydroxide
Beilstein J. Nanotechnol. 2019, 10, 760–770, doi:10.3762/bjnano.10.75

- consists of a quasi-planar triangular array of octahedral divalent metal ions separated by anions, e.g., acetate. Those anions coordinate the metal atoms and water molecules. The intercalation of new guest molecules or ions that substitute the acetate anions located in the interlayer space brings small
- measured at room temperature in an integrating sphere with a diode array rapid analyser system (GL Optic integrating sphere GLS 500). In order to carry out the measurements, the film was placed on a 450 nm LED at a distance of 0.3 cm from the chip (OCC-X010S01A Optogan GmbH type, 1000 lm at 1 A, T: 3000


On the transformation of “zincone”-like into porous ZnO thin films from sub-saturated plasma enhanced atomic layer deposition
Beilstein J. Nanotechnol. 2019, 10, 746–759, doi:10.3762/bjnano.10.74

- materials [5][6]. In the literature, a wide array of hybrid films has been reported, adopting several metallic precursors (such as Al [7][8][9][10], Ti [11][12], Zr [11], Hf [13], Zn [14][15][16][17], V [18][19], Li [20], Fe [21][22], Mo [23] and Er [24]). Generally, the thin films comprise the metal


Self-assembly and wetting properties of gold nanorod–CTAB molecules on HOPG
Beilstein J. Nanotechnol. 2019, 10, 696–705, doi:10.3762/bjnano.10.69

- lower stripes. Surprisingly, this striped phase has an even more regular structure, with stripes of ≈0.15 nm high and separation width ≈2.5 nm. As such, the width of each stripe is ≈3 nm and composed of a single molecular array adsorbed parallel to the surface (Figure 6C). Such an arrangement differs


Biomimetic synthesis of Ag-coated glasswing butterfly arrays as ultra-sensitive SERS substrates for efficient trace detection of pesticides
Beilstein J. Nanotechnol. 2019, 10, 578–588, doi:10.3762/bjnano.10.59

- synchronous reduction process, Zhang et al. [28] successfully synthesized metallic replicas of a 3D butterfly wing array. They demonstrated that by further tuning the experimental parameters, a higher SERS performance could be achieved. With the significant progress in SERS, there emerges a pressing need for


Hydrophilicity and carbon chain length effects on the gas sensing properties of chemoresistive, self-assembled monolayer carbon nanotube sensors
Beilstein J. Nanotechnol. 2019, 10, 565–577, doi:10.3762/bjnano.10.58

- in a sensor array should be helpful for detecting polar and nonpolar species and to fight ambient moisture interference. Finally, some examples of functionalized and pristine MWCNTs employed in gas sensors operating at room temperature are summarized in Table 1, showing a comparison of sensitivities


Direct observation of the CVD growth of monolayer MoS2 using in situ optical spectroscopy
Beilstein J. Nanotechnol. 2019, 10, 557–564, doi:10.3762/bjnano.10.57

- along the axis of the CVD reactor and detected by a spectrometer equipped with a CCD detector array. In order to enhance the sensitivity, the differential transmittance spectrum (DTS) at time t was calculated using the following equation (Equation 2): where T0 and Tt denote the transmittance spectra of


Advanced scanning probe lithography using anatase-to-rutile transition to create localized TiO2 nanorods
Beilstein J. Nanotechnol. 2019, 10, 412–418, doi:10.3762/bjnano.10.40

- . Hence, the shape of a worn tip becomes more stable after a certain period of use. In the presented structure, the shape of the tip was almost stabilized on its path to the starting point of the line array structure. Consequently, the line width is constant for the whole sample area. Furthermore, the
- fabrication (panel B1, using electron-beam lithography), and before hydrothermal growth; line array consisting of nanorods created with the hydrothermal growth process (panel A2 and panel B2 for scanning probe and electron-beam lithography, respectively). The stripe width is less than 100 nm, the pitch is 1


Geometrical optimisation of core–shell nanowire arrays for enhanced absorption in thin crystalline silicon heterojunction solar cells
Beilstein J. Nanotechnol. 2019, 10, 322–331, doi:10.3762/bjnano.10.31

- crystalline silicon bulk. Results: Proof-of-concept devices on a p-type mono-crystalline silicon wafer were manufactured and compared to flat references, showing improved absorption of light, while the final 11.8% (best-device) efficiency was hindered by sub-optimal passivation of the nanowire array. A
- modelling analysis of the optical performance of the proposed solar cell architecture was also carried out. Results showed that nanowires act as resonators, amplifying interference resonances and exciting additional wave-guided modes. The optimisation of the array geometrical dimensions highlighted a strong
- dependence of absorption on the nanowire cross section, a weaker effect of the nanowire height and good resilience for angles of incidence of light up to 60°. Conclusion: The presence of a nanowire array increases the optical performance of ultra-thin crystalline silicon solar cells in a wide range of


Electromagnetic analysis of the lasing thresholds of hybrid plasmon modes of a silver tube nanolaser with active core and active shell
Beilstein J. Nanotechnol. 2019, 10, 294–304, doi:10.3762/bjnano.10.28

- circular shell. Alternatively, such configurations can be seen as a quantum wire loaded with a plasmonic open resonator. An infinite array of circular quantum nanowires was considered with LEP in [27] where it was shown that such a periodic open active resonator can support so-called lattice modes with


![[Graphic 29]](/bjnano/content/inline/2190-4286-10-28-i46.svg?max-width=637&scale=1.18182) λ = 565.03...
λ = 565.03...

![[Graphic 36]](/bjnano/content/inline/2190-4286-10-28-i53.svg?max-width=637&scale=1.18182) ...
...


Site-specific growth of oriented ZnO nanocrystal arrays
Beilstein J. Nanotechnol. 2019, 10, 274–280, doi:10.3762/bjnano.10.26

- collected on the substrate. However, in applications like solar cells based on core/shell ZnO nanocrystals, site-specific growth of the well-aligned nanocrystals is quite important. Therefore, the position-controlled oriented growth of ZnO NC array architectures is highly desirable for practical
- of a patterned pore size in controlling the growth of array vs branched ZnO NCs is shown. A mechanism based on the nucleation and growth is proposed to understand the oriented/branched twin ZnO NC morphologies. Experimental Growth of ZnO nanocrystals An electrodeposition technique was employed to
- grow ZnO nanocrystals on both bare and on an array of pores patterned on the polymer-coated indium-doped tin oxide (ITO) conducting substrates. The patterning process for the polymer, poly(Disperse Red 1 acrylate), involves laser interference lithography and oxygen plasma etching and has been reported


Mechanism of silica–lysozyme composite formation unravelled by in situ fast SAXS
Beilstein J. Nanotechnol. 2019, 10, 182–197, doi:10.3762/bjnano.10.17

- Pilatus 2M (2D large-area pixel array detector) using an acquisition time of 50 ms per frame. Transmission was measured by means of a photodiode installed in the beam stop of the SAXS detector. A sample-to-detector distance of ca. 3 m allowed for a usable q-range of 0.04 < q < 4.5 nm−1. The scattering


Pull-off and friction forces of micropatterned elastomers on soft substrates: the effects of pattern length scale and stiffness
Beilstein J. Nanotechnol. 2019, 10, 79–94, doi:10.3762/bjnano.10.8

- with a spherical shape, separated by hourglass-shaped walls. These voids penetrate the terminal layer, resulting in an array of holes at the surface. We found that on soft substrates, generally, the size of the dimples did not affect pull-off forces. The positive effects of sub-microscale features on
- dimple depth was equal to half of the dimple diameter. The cross section of samples with a terminal layer showed voids with a spherical shape, separated by hourglass-shaped walls (Figure 3, right, inset). These voids penetrate the terminal layer, resulting in an array of holes at the surface (Figure 3


Bidirectional biomimetic flow sensing with antiparallel and curved artificial hair sensors
Beilstein J. Nanotechnol. 2019, 10, 32–46, doi:10.3762/bjnano.10.4

- orientation. This is overcome in nature so that an oscillatory flow imposed in addition to a steady flow can be sensed using two sensory cells with opposite excitatory stimulus best directions [16]. The fish lateral line then further deploys these sensors to decouple multiple flow stimuli by using an array of
- separation of ≈250 μm, the flow sensor array described by Bruinink et al. [35] achieved very high sensitivity (minimal detectable flow amplitude) down to 2 mm s−1 in air flow. The 100-fold increase in acoustic sensitivity in comparison to their first-generation capacitive-based flow-sensor arrays [33][34
- sensor array in parallel to two opposing, bent beams, air flow direction was determined by measuring the variation of platinum resistance between different cantilever beams with an external LCR meter (inductance L, capacitance C, and resistance R). The least resistance variation was caused by the upwind


A new bioinspired method for pressure and flow sensing based on the underwater air-retaining surface of the backswimmer Notonecta
Beilstein J. Nanotechnol. 2018, 9, 3039–3047, doi:10.3762/bjnano.9.282

- 15 cm (Figure 8). The sample covered an area of 5 × 5 mm2 with an array of 3 × 3 needles of 3 mm height surrounded by a 3 mm high rim. A laser pointer (Logitech R800) was placed at one side of the experimental tank such that the beam reached the air–water interface at an angle of about 30°. The beam


Femtosecond laser-assisted fabrication of chalcopyrite micro-concentrator photovoltaics
Beilstein J. Nanotechnol. 2018, 9, 3025–3038, doi:10.3762/bjnano.9.281
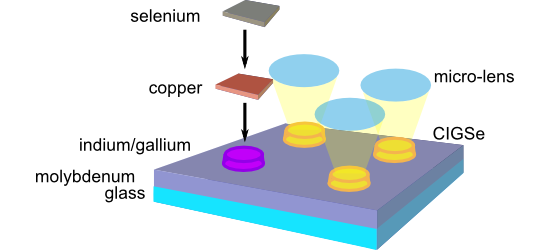
- principle is illustrated for the case of dot-shaped solar cells. Concentrator photovoltaics (CPV) require significantly less absorber material and, at the same time, the concentration of light allows for a more efficient energy conversion. The material saving potential for a squared array of microabsorbers
- at well-defined spots. Figure 4 shows an optical micrograph (OM) of an array of laser-generated material modifications on glass, whereby pulse number and peak fluence of the laser (30-fs laser pulses at 800 nm center wavelength and 1 kHz repetition rate) were varied along rows and columns of the
- array. The series of spots at the surface illustrates, that a stronger surface modification or even the formation of a crater can be achieved by increasing the number of laser pulses per spot as well as by increasing the laser fluence (energy density). Selected scanning electron microscopy (SEM) images


