Search results
Search for "frequency response" in Full Text gives 56 result(s) in Beilstein Journal of Nanotechnology.
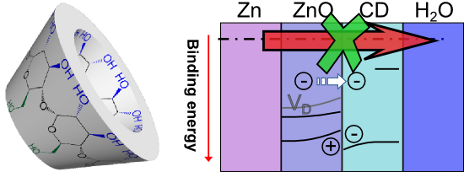
Cyclodextrin inhibits zinc corrosion by destabilizing point defect formation in the oxide layer
Beilstein J. Nanotechnol. 2018, 9, 936–944, doi:10.3762/bjnano.9.86
- are referenced against Ag/AgCl/3 M KCl. Experiments were conducted using a Solatron multichannel potentiostat system (Solatron 1255B Frequency Response Analyser, Solatron Muliplexer 1281, and Solatron 1286 Electrochemical Interface). EIS was executed with an AC amplitude of 10 mV vs open-circuit


Lyapunov estimation for high-speed demodulation in multifrequency atomic force microscopy
Beilstein J. Nanotechnol. 2018, 9, 490–498, doi:10.3762/bjnano.9.47

- the point in a frequency response where the output of the demodulator drops by −3 dB with respect to the input modulating signal. Off-mode rejection (OMR) is a term that describes the attenuation of unwanted frequencies present in the input signal, which lie outside the modeled carrier of interest. It
- (Zürich Instruments HF2LI) was used in-conjunction with a laboratory function generator (Agilent 33521A waveform generator) to experimentally verify the performance of the implemented Lyapunov filter. These investigations include a frequency response experiment to measure the tracking bandwidth and
- implemented system. For each frequency response, the modulating signal A(t) in Equation 1 was swept from DC to 1.5 MHz while the carrier frequency was held constant. The tracking bandwidth experiment examines the relationship between the −3 dB point and γ for a 1 MHz carrier frequency and γ values ranging


High-speed dynamic-mode atomic force microscopy imaging of polymers: an adaptive multiloop-mode approach
Beilstein J. Nanotechnol. 2017, 8, 1563–1570, doi:10.3762/bjnano.8.158

- the above control law, (Uff+fb,k(jω) − Uff+fb,k−1(jω))/(Zk(jω) − Zk−1(jω)), essentially equals the inverse of the frequency response of the z-piezo actuator, and is updated line-by-line iteratively throughout the whole imaging process. Furthermore, the design of Hffd,k(·) in Equation 2 takes into


A review of demodulation techniques for amplitude-modulation atomic force microscopy
Beilstein J. Nanotechnol. 2017, 8, 1407–1426, doi:10.3762/bjnano.8.142

- fs is much higher than fc, the frequency response of the interpolation filter can be neglected. It is clear that if the integration window length is chosen to be integer multiples of the oscillation period, the sinc filter will have zeros at the harmonics of the oscillation frequency. If the
- be viewed as a FIR filter with a triangular impulse response obtained from the convolution of the two FIR integration filters, resulting in a sinc2 frequency response with significantly reduced side-lobes (for a direct comparison see Appendix B. While simulation results show that low latency and high
- the Kalman filter [44][48], which does not use any continuous states or LabVIEW specific blocks. Tracking bandwidth The tracking bandwidth of each demodulator is determined by measuring the amplitude tracking frequency response. This was performed using a laboratory function generator (Agilent 33521A


First examples of organosilica-based ionogels: synthesis and electrochemical behavior
Beilstein J. Nanotechnol. 2017, 8, 736–751, doi:10.3762/bjnano.8.77

- behavior corresponds to the freezing of the ion mobility at lower temperature where the semi-circle represents the inside bulk that fades when increasing the temperature until the presence of polarization and diffusion is only visible by the straight line. More specifically, the lower frequency response
- visualized as a straight line is representative of the electrode polarization, while the higher frequency response forming the depressed circle is due to the dielectric properties of the bulk. The first part can be described as a non-ideal capacitor (constant phase element) in series with the interfacial


Multimodal cantilevers with novel piezoelectric layer topology for sensitivity enhancement
Beilstein J. Nanotechnol. 2017, 8, 358–371, doi:10.3762/bjnano.8.38

- , M2 and M4 and location 2 for the torsional mode M3. The system response (Vi→Vo) is the combination of a motional and feedthrough component. To observe the motional component feedthrough cancellation is performed offline. A third order transfer function is fitted to the measured frequency response in
- From the magnitude frequency response of C1 (Figure 6a), the frequency of the cantilever’s first four modes are at 44.02 kHz, 133.7 kHz, 186.8 kHz and 402.9 kHz respectively. Fabrication tolerances and the mechanical action of the piezoelectric layer account for the frequency differences compared to


Noise in NC-AFM measurements with significant tip–sample interaction
Beilstein J. Nanotechnol. 2016, 7, 1885–1904, doi:10.3762/bjnano.7.181
- the sample surface [2], typically a cantilever, a tuning fork, or a needle sensor [8]. The resolution of force measurements is limited by the noise in the frequency shift signal [9][10], which strongly depends on the noise floor of the detection system, the frequency response of the frequency
- properties and temperature [11]. Third, the frequency response Hfilter of the PLL system is used for describing the propagation of noise from the cantilever oscillation to the frequency shift signal at the output of the frequency demodulator. This frequency response function strongly depends on the PLL
- filter settings [11] and will here be modelled for a typical experimental setup described in section “Noise propagation model” and appendix C. Fourth, we determine the explicit frequency response functions HA and Hz of the amplitude and topography control loops, respectively. This allows an adjustment of


![[Graphic 32]](/bjnano/content/inline/2190-4286-7-181-i73.png?max-width=637&scale=1.18182) wit...
wit...

![[Graphic 34]](/bjnano/content/inline/2190-4286-7-181-i75.png?max-width=637&scale=1.18182) wit...
wit...


Finite-size effect on the dynamic and sensing performances of graphene resonators: the role of edge stress
Beilstein J. Nanotechnol. 2016, 7, 685–696, doi:10.3762/bjnano.7.61

- . This can be elucidated from the scaling law given by Equation 30, which shows that the nonlinearity of vibration for a graphene resonator appears as its length increases, while this nonlinearity is likely to disappear when the length of the resonator decreases. We proceed to characterize the frequency
- response of two graphene resonators with length L = 40 nm and ACH-ZZ57 or AC56-ZZH edge structure. The consideration of a relatively large graphene resonator is attributed to the result from Equation 30 that a larger graphene resonator is likely to more easily undergo nonlinear vibration, and to our


Charge and heat transport in soft nanosystems in the presence of time-dependent perturbations
Beilstein J. Nanotechnol. 2016, 7, 439–464, doi:10.3762/bjnano.7.39


High-bandwidth multimode self-sensing in bimodal atomic force microscopy
Beilstein J. Nanotechnol. 2016, 7, 284–295, doi:10.3762/bjnano.7.26

- excitation of higher order eigenmodes of a microcantilever [1][2][3] and as such, present a number of practical challenges to cantilever instrumentation. Both high-bandwidth cantilever actuation and deflection sensing are necessary, ideally without distorting the frequency response of the cantilever and
- involving a minimum amount of external equipment. For example, the commonly used piezoelectric actuator at the base of the cantilever leads to a highly distorted frequency response with numerous resonances which renders the identification and subsequent analysis of higher eigenmodes exceedingly difficult
- transform yields a sum of second order modes to describe the frequency response of the first n flexural modes of the beam relating the actuator voltage V(s) to cantilever deflection D(s) [24] where each second order mode is associated with a specific vibrational mode shape and is characterized in terms of


A simple and efficient quasi 3-dimensional viscoelastic model and software for simulation of tapping-mode atomic force microscopy
Beilstein J. Nanotechnol. 2015, 6, 2233–2241, doi:10.3762/bjnano.6.229

- adjusted to match the experimental observations. An example of this could be the construction of a frequency response curve (amplitude vs frequency) under different values of the static deflection (with the deflection setpoint fixed for every simulation), which can be directly compared to CR-AFM


Development of a novel nanoindentation technique by utilizing a dual-probe AFM system
Beilstein J. Nanotechnol. 2015, 6, 2015–2027, doi:10.3762/bjnano.6.205

- ]. Nowakowski et al. demonstrate a nanoindentation system with high precision where capacitive gauges are used for displacement measurement in the system [12]. The proximity of the indenter to the surface is sensed by tuning forks through their frequency response shift, showing the capabilities of accurate


Nanomechanical humidity detection through porous alumina cantilevers
Beilstein J. Nanotechnol. 2015, 6, 1332–1337, doi:10.3762/bjnano.6.137

- specific mechanical response. To predict the behavior of the cantilever in the gas/liquid phase we investigated alterations of the amplitude–frequency characteristics when changing pressure and humidity. The frequency response of elastic beam is strongly dependent on the fluid it is vibrating in [2]. In


Entropy effects in the collective dynamic behavior of alkyl monolayers tethered to Si(111)
Beilstein J. Nanotechnol. 2015, 6, 583–594, doi:10.3762/bjnano.6.60

- reverse bias values. The strong decrease of both relaxation frequencies with increasing reverse dc bias reveals increasing motional constraints, attributed to electrostatic pressure applied to the densely-packed nanometer-thick monolayer. Spectral decomposition of the frequency response shows a power-law
- monolayer (denoted as Si/acid 5), using the photochemical reaction at 300 nm for 3 h of Si(111):H with a mixture of undecylenic acid/1-dodecene (molar ratio 5/95). Admittance measurements Admittance measurements were performed with a frequency response analyzer (Alpha-A High Resolution, Novocontrol


Probing viscoelastic surfaces with bimodal tapping-mode atomic force microscopy: Underlying physics and observables for a standard linear solid model
Beilstein J. Nanotechnol. 2014, 5, 1649–1663, doi:10.3762/bjnano.5.176

- the sample storage and loss moduli. Similarly, in contact resonance methods [4][5][6][7][8] the user generally measures the cantilever frequency response to small amplitude excitations, from which an effective resonance frequency and quality factor can be computed and post-processed to also give the
- in Figure 5c). The dissipation loops in the force curves for the case of constant maximum depth (Figure 5a) show a gradual transition from a low frequency response to a high frequency response, qualitatively similar to what is observed for single-eigenmode oscillations (Figure 4a), but with irregular


Multi-frequency tapping-mode atomic force microscopy beyond three eigenmodes in ambient air
Beilstein J. Nanotechnol. 2014, 5, 1637–1648, doi:10.3762/bjnano.5.175

- amplitude or phase response is not necessarily preserved for different eigenmodes (this is especially true when not all eigenmodes operate in the same imaging regime, as illustrated in Figure 4d). Engaged frequency response A key consideration regarding the acquisition of meaningful results with multimodal
- physically meaningful, since it does not guarantee that the contrast eigenmodes conform to the assumed ideal response. In contrast, if frequency modulation methods are used to drive the higher modes [5][7][27], it is necessary that the frequency response be well behaved both to ensure the stability of the
- . Additionally, the frequency response curve gradually deviates from the ideal curve, suggesting that the stability of frequency modulation operations may be compromised unless slower scanning speeds are used, which permit greater averaging in the signals. Finally, the results of Figure 5c show that the


Methods for rapid frequency-domain characterization of leakage currents in silicon nanowire-based field-effect transistors
Beilstein J. Nanotechnol. 2014, 5, 964–972, doi:10.3762/bjnano.5.110

- methods is verified by experimental measurements from an n-type SiNW FET. Keywords: admittance spectroscopy; excitation design; frequency characterization; frequency response; silicon nanowire; Introduction Recent development in sensing biochemical molecules has been rapid. Among many sensing
- frequencies. This makes it possible to simultaneously measure a frequency response at those frequencies through Fourier methods [13]. Therefore, instead of measuring a response separately at each frequency, all the required information can be captured within one measurement. This drastically reduces the
- reservoir pipeline-valve system [16], and in frequency-response measurement of switched-mode power supplies [17]. This paper presents fast frequency-domain methods with which to measure and characterize the leakage current in SiNW FETs. The primary aim of the work is to present a cost-effective


Challenges and complexities of multifrequency atomic force microscopy in liquid environments
Beilstein J. Nanotechnol. 2014, 5, 298–307, doi:10.3762/bjnano.5.33

- the same underlying cause. As extensively studied through simulation and experiment by Raman and coworkers, momentary excitation occurs when the spectrum of the tip–sample forces overlaps with the frequency response (transfer) function of the higher eigenmodes, which is more likely to occur in low-Q
- three different second mode amplitudes. As expected, there is a significant change in tip–sample penetration as the second mode amplitude increases [11][37], leading to different force spectra (Figure 8b). Since all three spectra overlap at least with the third eigenmode frequency response, they all
- discussed in the text). Example of measurement artifacts previously observed in single-mode AFM operation in liquids: distortion of the frequency response (a) and phase response (b) curves with base excitation (the “Tip Exc” traces provide the true response); momentary excitation of higher eigenmodes and


Frequency, amplitude, and phase measurements in contact resonance atomic force microscopies
Beilstein J. Nanotechnol. 2014, 5, 278–288, doi:10.3762/bjnano.5.30

- generally measured through excitation frequency “sweeps” for quantitative determination of the same elastic and viscous responses of the material. More recently, other methods have been introduced to more rapidly infer the frequency response (amplitude vs frequency curves) of the tip–sample contact. In the
- band excitation (BE) method, a time-dependent signal containing a band of frequencies around the desired resonance is applied at each pixel of the scan, such that the frequency response at that location can be rapidly obtained through a Fourier transform of the cantilever tip response and a fit to a
- Lorentzian curve [10][11]. This calculation allows mapping of the resonance frequency and quality factor across the sample, from which viscoelastic properties can also be inferred. In contrast, in the dual-amplitude resonance tracking (DART) method, the frequency response curve is rapidly inferred from the


Dynamic nanoindentation by instrumented nanoindentation and force microscopy: a comparative review
Beilstein J. Nanotechnol. 2013, 4, 815–833, doi:10.3762/bjnano.4.93

- frequency response of the instrument is controlled by the magnitude of the moving mass, the stiffness of the support springs and the damping of the head. Here INI has some advantages over AFM, for instance the widely used capacitive or electrostatic sensing of the indenter motion is stable over time and


Size-dependent characteristics of electrostatically actuated fluid-conveying carbon nanotubes based on modified couple stress theory
Beilstein J. Nanotechnol. 2013, 4, 771–780, doi:10.3762/bjnano.4.88

- regarding this field and validated the results obtained from modeling through experimental data [18]. In addition, Ouakad and Younis studied the dynamic behavior of the CNTs under electrostatic actuation and presented the frequency response of the systems as a function of different applied voltages [19


Novel composite Zr/PBI-O-PhT membranes for HT-PEFC applications
Beilstein J. Nanotechnol. 2013, 4, 481–492, doi:10.3762/bjnano.4.57

- curves All electrochemical measurements were performed by the use of an Autolab PGSTAT 302 (Eco Chemie) potentiostat/galvanostat with a built-in frequency response analyser module FRA 2. Steady state galvanostatic polarization curves were measured in a current density range from 0 to 0.4 A·cm−2 at 160 °C


High-resolution nanomechanical analysis of suspended electrospun silk fibers with the torsional harmonic atomic force microscope
Beilstein J. Nanotechnol. 2013, 4, 243–248, doi:10.3762/bjnano.4.25

- -interaction forces twist the cantilever by a detectible amount. The high bandwidth of torsional motion allows accessing higher harmonics of the tip–sample-interaction forces to reconstruct tip–sample-force waveforms. This process involves calibration of the frequency response of the torsional mode by
- frequency response and gain of the torsional mode allows the reconstruction of the tip–sample-force waveforms. A computer program carries out these calculations in real time during the tapping-mode imaging process. The program also corrects for nonlinearities of the position-sensitive diode and for


Bimodal atomic force microscopy driving the higher eigenmode in frequency-modulation mode: Implementation, advantages, disadvantages and comparison to the open-loop case
Beilstein J. Nanotechnol. 2013, 4, 198–207, doi:10.3762/bjnano.4.20

- amplitude (oscillation or drive), 2nd phase or frequency shift (see Figure 3 for parameters). Simulation of the change in frequency response for the second eigenmode of a cantilever with fundamental eigenfrequency of 60.8 kHz (Q ≈ 150), second eigenfrequency of 380.8 kHz (Q ≈ 450), and fundamental force


Towards 4-dimensional atomic force spectroscopy using the spectral inversion method
Beilstein J. Nanotechnol. 2013, 4, 87–93, doi:10.3762/bjnano.4.10

- frequency deviates from the resonance frequency (recall that harmonic oscillators exhibit a Lorentzian frequency response). As a result, the high-frequency peaks in Zp(ω) become smaller and smaller as ω increases, such that their signal-to-noise ratio decreases rapidly as ω increases. Thus, in order to


