Abstract
In order to investigate the joint influence of the conformation flexibility and the matching of the energies of the charge-transfer (CT) and the localized triplet excited (3LE) states on the thermally activated delayed fluorescence (TADF) in electron donor–acceptor molecules, a series of compact electron donor–acceptor dyads and a triad were prepared, with naphthalimide (NI) as electron acceptor and phenothiazine (PTZ) as electron donor. The NI and PTZ moieties are either directly connected at the 3-position of NI and the N-position of the PTZ moiety via a C–N single bond, or they are linked through a phenyl group. The tuning of the energy order of the CT and LE states is achieved by oxidation of the PTZ unit into the corresponding sulfoxide, whereas conformation restriction is imposed by introducing ortho-methyl substituents on the phenyl linker, so that the coupling magnitude between the CT and the 3LE states can be controlled. The singlet oxygen quantum yield (ΦΔ) of NI-PTZ is moderate in n-hexane (HEX, ΦΔ = 19%). TADF was observed for the dyads, the biexponential luminescence lifetime are 16.0 ns (99.9%)/14.4 μs (0.1%) for the dyad and 7.2 ns (99.6%)/2.0 μs (0.4%) for the triad. Triplet state was observed in the nanosecond transient absorption spectra with lifetimes in the 4–48 μs range. Computational investigations show that the orthogonal electron donor–acceptor molecular structure is beneficial for TADF. These calculations indicate small energetic difference between the 3LE and 3CT states, which are helpful for interpreting the ns-TA spectra and the origins of TADF in NI-PTZ, which is ultimately due to the small energetic difference between the 3LE and 3CT states. Conversely, NI-PTZ-O, which has a higher CT state and bears a much more stabilized 3LE state, does not show TADF.

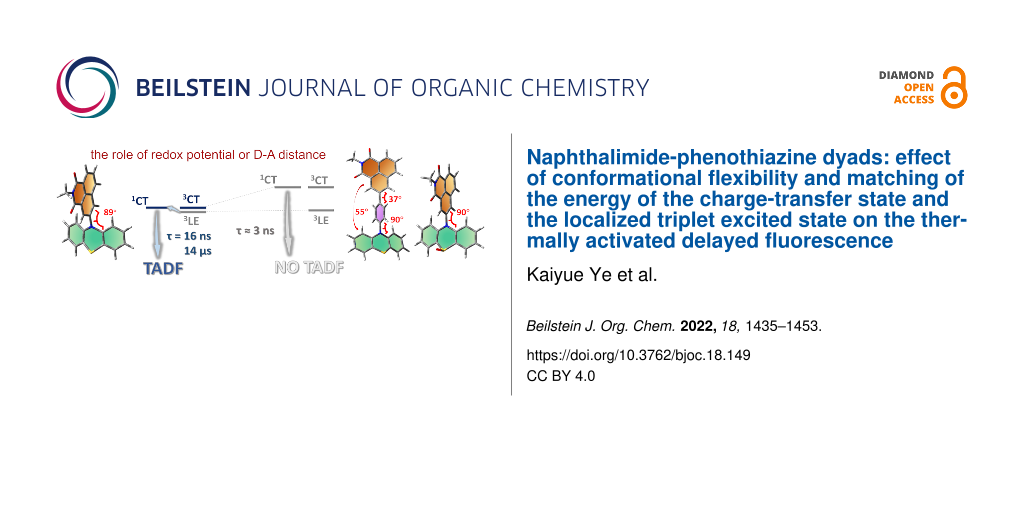
Graphical Abstract
Introduction
Thermally activated delayed fluorescence (TADF) has attracted much attention in recent years, not only for its application in organic light emitting diodes (OLED) [1-3] but also as a mean for studying of charge-transfer (CT) and intersystem-crossing (ISC) phenomena [4,5]. Compounds showing TADF are usually presenting an orthogonal electron donor–acceptor molecular structure, i.e., the π-planes of the electron donor and acceptor adopt an orthogonal geometry [6,7]. Such an architecture is beneficial to spatially split HOMO and LUMO orbitals, thus reducing the electron-exchange integral (J) for the two electrons in the frontier molecular orbitals which reduced the energy gap (2J) between these two states. lt is widely considered that this small energy gap (a few dozens of meV) is beneficial for both ISC and the reverse ISC (rISC) in TADF [1-3,8-13].
However, it is noted that in some electron donor–acceptor dyads, TADF is not observed even when the CT state is accessible [14,15]. This is typically because the direct ISC between 1CT and 3CT is forbidden and non-efficient, and this hyperfine interaction-driven ISC is slow. Recently, it was proposed that an intermediate localized triplet state (3LE) is essential to enhance the ISC and rISC, through the so-called spin-vibronic coupling effect [8,16-19]. However, the effect of the molecular geometry on the ISC and rlSC is complicated, and additional investigations are required to verify the above postulate and to unravel the TADF mechanism.
Recently, we and others found that the orthogonal donor–acceptor dyad derived from 1,8-naphthalimide (NI) and phenothiazine (PTZ) shows TADF in the red spectral range [20-22]. Our purpose of designing that dyad was to study the spin–orbit charge-transfer ISC (SOCT-ISC), i.e., to determine, if the ISC is enhanced by the charge recombination (CR) in the orthogonal dyad. Indeed, CR is accompanied by orbital angular momentum change, which off-sets the electron spin angular momentum change, allowing the angular momentum to be conserved and, consequently, ISC to be enhanced [23-31]. We underline that the orthogonal geometry of this dyad reduces the 1CT/3CT states energy gap while simultaneously enhancing the ISC for the 1CT→3LE process. Therefore, we propose that the TADF is actually a special case of SOCT-ISC, when the three 1CT/3CT/3LE states have similar energies. Nevertheless, in most orthogonal dyads showing SOCT-ISC, the 3LE state has a much lower energy than the CT states, especially in triplet photosensitizers, for which a final 3LE state is desired [32,33]. As explained above, an orthogonal geometry is beneficial to achieve SOCT-ISC. However, for TADF, it was proposed that the rotational freedom is beneficial for the rISC, and that too rigid molecular structures may favor phosphorescence and therefore limit rISC and TADF [34,35]. Studies with time-resolved electron paramagnetic resonance (TREPR) spectra and theoretical methods also support that conformation fluctuations are beneficial to TADF [16]. This is in stark contrast with the SOCT-ISC mechanism.
To further explore these contradictory requirements for SOCT-ISC and TADF, we designed herein a series of NI-PTZ dyads, and the synthesis route is mentioned in the following section of molecular design and structural confirmation. These dyads are different from the previously reported dyads by the substitution position, and the number of PTZ moieties attached on the NI unit, as well as the redox potential of the PTZ moiety. NI-PTZ has a linkage at the 3-position of the NI moiety, for the recently reported analogous dyad, however, the substitution is at the 4-position [20]. For the current NI-PTZ dyad, the torsion between the NI and PTZ has a larger freedom, due to the reduced steric hindrance originating from the peri-H atoms on the two chromophores. We also tuned the redox potentials by oxidation of the electron donor PTZ (NI-PTZ-O). Thus, the energy of CT states and the matching with their 3LE counterpart can be altered. We underline that the approach of oxidation of the PTZ unit, which has minimal impacts on the geometry and the 3LE state energy in the dyad, was rarely explored [8]. We also modified the energy of the CT states by increasing the distance between the electron donor and acceptor by using an intervening phenyl linker between the NI and the PTZ moieties (NI-Ph-PTZ and NI-PhMe2-PTZ) [36]. The electronic coupling between the NI and PTZ units differ these two dyads. Finally, in NI-PhMe2-PTZ with methyl substituents, the phenyl linker adopts an orthogonal geometry with respect to the NI moiety, inducing a weaker coupling than that in NI-Ph-PTZ. The photophysical properties of the dyads were studied with steady-state and time-resolved spectroscopic methods, as well as theoretical calculations.
Results and Discussion
Molecular design and structure confirmation
In order to study the effect of conformational flexibility on TADF, NI-PTZ was designed (Scheme 1). As dicussed above, various approaches (different connection, linkers, oxidation of the PTZ, and addition of methyl groups) have been used to tune the relative energies of the key states and the geometry. Scheme 1 summarizes the synthetic routes used to obtain the various compounds and shows the molecular structures. The synthesis of the dyads is based on the ordinary derivatization of the NI and PTZ chromophores [20]. The molecular structures were confirmed by 1H NMR, 13C NMR, and HRMS methods (Experimental section).
![[1860-5397-18-149-i1]](/bjoc/content/inline/1860-5397-18-149-i1.svg?scale=2.0&max-width=1024&background=FFFFFF)
Scheme 1: Synthesis of the compoundsa. aKey: (a) phenothiazine, sodium tert-butoxide, dried toluene (TOL), tri-tert-butylphosphine tetrafluoroborate, Pd(OAc)2, 120 °C, 8 h, 93.1%; (b) H2O2 (30%), CH3COOH, 40 °C, 1 h, yield: 87.2%; (c) similar to step (a), yield: 80.0%; (d) bis(pinacolato)diboron, KOAc, Pd(dppf)Cl2, toluene, N2, 110 °C, 16 h, yield: 11.9%.; (e) 1-bromo-4-iodobenzene, Pd(PPh3)4, K2CO3, TOL, EtOH, H2O, N2, reflux, 8 h, yield: 92.9%; (f) similar to step (a), yield: 62.4%; (g) 5-bromo-2-iodo-1,3-dimethylbenzene, Pd(PPh3)4, K2CO3, TOL, EtOH, H2O, N2, 110 °C, 9 h, yield: 60.6%; (h) similar to step (a), yield: 28.3%.
Scheme 1: Synthesis of the compoundsa. aKey: (a) phenothiazine, sodium tert-butoxide, dried toluene (TOL), tr...
UV–vis absorption and fluorescence emission spectra
The UV–vis absorption spectra of the compounds were studied (Figure 1 and Figure S25 in Supporting Information File 1). NI-PTZ shows structured absorption bands in the 300–350 nm range, which are attributed to the NI moiety [20]. Moreover, there is a broad, structureless absorption band centered at 412 nm (ε = 1.30 × 10³ M−1 cm−1), which is assigned to a CT absorption band, i.e., to the S0→1CT transition. This is an indication of the strong electronic coupling between the electron donor (PTZ) and acceptor (NI). Indeed, in the absence of such coupling, the S0→1CT transition would be forbidden, and no CT absorption band would be observed [14,37-41].
![[1860-5397-18-149-1]](/bjoc/content/figures/1860-5397-18-149-1.png?scale=2.0&max-width=1024&background=FFFFFF)
Figure 1: UV–vis absorption spectra of NI-PTZ, NI-PTZ-O, NI-PTZ2, NI-Ph-PTZ, and NI-PhMe2-PTZ in HEX. c = 1.0 × 10⁻⁵ M at 20 °C.
Figure 1: UV–vis absorption spectra of NI-PTZ, NI-PTZ-O, NI-PTZ2, NI-Ph-PTZ, and NI-PhMe2-PTZ in HEX. c = 1.0...
Interestingly, the CT absorption is similar to the previously reported NI-N-PTZ dyad with a linkage at the 4-position of the NI moiety [20], for which the CT absorption band is centered at 411 nm. Interesting in the NI-PTZ2 triad, the absorption band at 300–350 nm is different from that of NI-PTZ, and the CT absorption band centered at 423 nm is much more intense than that of NI-PTZ, indicating that the electronic effect of the substituents does not have a simple additive effect on the photophysical properties [42]. The CT absorption band of NI-PTZ-O is much weaker, confirming that the CT absorption band strongly depends on the electron-donating ability of the donor. In both NI-Ph-PTZ and NI-PhMe2-PTZ, the CT band is negligible, due to the large separation between the NI and PTZ moieties. Note that in NI-Ph-PTZ, the electronic coupling between the NI and the phenyl linker is non-negligible, which results in a CT absorption in which the phenyl moiety acts as the donor. This analysis is supported by the UV–vis absorption spectrum of the 3-phenyl NI [43]. A careful examination of the UV–vis absorption spectra indicates that the PTZ moiety in NI-Ph-PTZ induces a slight redshift of the CT absorption band (centered at 405 nm) as compared to that of 3-phenyl NI [43].
These results show that our methods for tuning the electronic coupling between the donor and acceptor groups by alternation of the redox potentials of the donor (or acceptor), variation of the distance between the donor and acceptor, and conformational restriction, are all successful [44-46].
The fluorescence of the dyads was studied (Figure 2 and Figure S26 in Supporting Information File 1). As compared to that in cyclohexane (CHX) and HEX, the fluorescence of NI-PTZ is strongly quenched in TOL and solvents with higher polarity. This trend is similar to the one previously reported for the NI-N-PTZ analog [20]. We note that the CT emission band of NI-PTZ is slightly red-shifted as compared to that of the previously reported dyad. Upon oxidation of the PTZ moiety, i.e., for NI-PTZ-O, the fluorescence quenching in polar solvents is less significant than that of NI-PTZ (Figure 2b), and the CT emission band is blue-shifted as compared to that of NI-N-PTZ [20], a likely consequence of the reduced electron-donating ability of the PTZ moiety.
![[1860-5397-18-149-2]](/bjoc/content/figures/1860-5397-18-149-2.png?scale=2.0&max-width=1024&background=FFFFFF)
Figure 2: Fluorescence spectra of the compounds (a) NI-PTZ; (b) NI-PTZ-O; (c) NI-PTZ2, and (d) NI-Ph-PTZ in different solvents. The solvents used are: CHX, HEX, TOL and acetonitrile (ACN). Optically matched solutions were used, A = 0.100, λex = 330 nm, 20 °C.
Figure 2: Fluorescence spectra of the compounds (a) NI-PTZ; (b) NI-PTZ-O; (c) NI-PTZ2, and (d) NI-Ph-PTZ in d...
For NI-PTZ2, a solvent polarity-dependent fluorescence band was observed (Figure 2c), which is similar to that of NI-PTZ. For NI-Ph-PTZ, a structured fluorescence band was observed in the 400–600 nm range (Figure 2d), which is assigned to LE emission. In toluene, however, a broad emission band centered at 624 nm was observed, which we attribute to the CT emission (with the phenyl moiety as donor group). The emission maximum (624 nm) is blue-shifted as compared to that of NI-PTZ (731 nm in toluene), indicating that the CT state energy of NI-Ph-PTZ is higher than that of NI-PTZ [47]. Similar results were observed for NI-PhMe2-PTZ (Supporting Information File 1, Figure S26).
As a preliminary study to assess the existence of TADF for the dyads and the triad, the fluorescence spectra of the compounds in N2-saturated and air-saturated solution were recorded (Figure 3 and Figure S27 in Supporting Information File 1). For both NI-PTZ and NI-PTZ2, the fluorescence intensity was quenched significantly in aerated solution as compared to that in deaerated solution (Figure 3a and 3c and Figure S27a and S27c in Supporting Information File 1). For NI-PTZ-O and NI-Ph-PTZ (Figure 3b and 3d), however, the fluorescence intensity is less dependent on the atmosphere.
![[1860-5397-18-149-3]](/bjoc/content/figures/1860-5397-18-149-3.png?scale=2.0&max-width=1024&background=FFFFFF)
Figure 3: Fluorescence spectra of (a) NI-PTZ, (b) NI-PTZ-O, (c) NI-PTZ2, and (d) NI-Ph-PTZ in HEX under different atmospheres (N2, air). Optically matched solutions were used, A = 0.100, λex = 330 nm, c = 1.0 × 10⁻⁵ M, 20 °C.
Figure 3: Fluorescence spectra of (a) NI-PTZ, (b) NI-PTZ-O, (c) NI-PTZ2, and (d) NI-Ph-PTZ in HEX under diffe...
However, one should be careful with the interpretation of such data, as the quenching of the fluorescence in aerated solution does not necessarily imply TADF, since fluorescence species with long fluorescence lifetime can be also quenched by O2 (a paramagnetic species). This is in particular relevant for the present compounds, since the fluorescence of NI-PTZ and NI-PTZ2 originate from CT states, whereas the emissions of NI-PTZ-O and NI-Ph-PTZ come from an emissive 1LE state (due to the oxidation of the PTZ unit, or the phenyl linker, the CT state energy increases, and the 1LE state becomes the lowest-lying state). Longer lifetimes are typically found for CT emission than LE emission, because of the forbidden feature of the 1CT→S0 transition.
Therefore, the fluorescence decay trace of the compounds was recorded (Figure 4). The fluorescence decay trace of NI-PTZ shows a distinct biexponential signature, the lifetime is 16.0 ns (99.9%)/14.4 μs (0.1%) in deaerated n-hexane (Figure 4a). In aerated solution, the luminescence lifetime is reduced to 7.6 ns (99.8%)/0.19 μs (0.2%) (Figure 4d). These are footprints for TADF. Similar features were reported for an analogous NI-PTZ dyad [20]. NI-PTZ2 displays similar characteristic TADF lifetimes (Figure 4b and 4e). Clearly, besides the conformational flexibility, other factors do play a role in the photophysical properties of the dyad, i.e., the magnitudes of CT/3LE energy gap, and related spin–vibronic couplings. Increasing the CT state energy either through oxidation of the PTZ moiety (for NI-PTZ-O) or by using a longer linker (NI-Ph-PTZ and NI-PhMe2-PTZ), leads to a normal fluorescence decay. Specifically, the luminescence lifetimes of NI-PTZ-O and NI-Ph-PTZ are 3.1 ns (99%)/22.1 ns (1%) and 1.2 ns (77%)/4.5 ns (23%), respectively (Figure 4c and 4f). The fluorescence lifetimes of NI-PhMe2-PTZ in CHX, HEX, and TOL were determined to be 1.6 ns (56%)/12.9 ns (44%), 1.2 ns (51%)/7.2 ns (49%), and 2.7 ns (22%)/18.7 ns (78%), respectively (Figure S28 in Supporting Information File 1).
![[1860-5397-18-149-4]](/bjoc/content/figures/1860-5397-18-149-4.png?scale=2.0&max-width=1024&background=FFFFFF)
Figure 4: Fluorescence lifetime of NI-PTZ under (a) N2 atmosphere and (d) air atmosphere (λem = 610 nm, c = 5.0 × 10⁻⁵ M). Fluorescence lifetime of NI-PTZ2 under (b) N2 atmosphere and (e) air atmosphere (λem = 610 nm, c = 5.0 × 10⁻⁵ M). Fluorescence lifetime of (c) NI-PTZ-O (λem = 472 nm, c = 1.0 × 10⁻⁵ M) and (f) NI-Ph-PTZ (λem = 482 nm, c = 1.0 × 10⁻⁵ M). Excited with a picoseconds pulsed laser (λex = 340 nm), in HEX, 20 °C.
Figure 4: Fluorescence lifetime of NI-PTZ under (a) N2 atmosphere and (d) air atmosphere (λem = 610 nm, c = 5...
In order to determine the 3NI energy in the dyads and in the triad, the phosphorescence emission spectra of NI-PTZ-O in frozen solution at 77 K were recorded (Figure 5 and Figure S29 in Supporting Information File 1). No phosphorescence was detected for NI-PTZ nor NI-PTZ2. For NI-PTZ-O (Figure 5a), a structured emission with significant vibrational progression was observed in the 520–650 nm range, which is attributed to the 3LE state, as the emission band is similar to the one of 4-bromo NI [48]. Thus, the 3NI state energy can be approximated to be 2.29 eV from the 0–0 band of the phosphorescence. The 3NI energy of NI-Ph-PTZ, NI-PhMe2-PTZ, and NI-3Br were determined to be 2.24 eV, 2.27 eV, and 2.27 eV, respectively (see Supporting Information File 1, Figure S29). For NI-PTZ-O (Figure 5b), the phosphorescence lifetime of the frozen solution attains 363 ms, which is similar to the phosphorescence lifetime of unsubstituted NI (ca. 410.3 ms) [48]. The phosphorescence lifetime of NI-Ph-PTZ, NI-PhMe2-PTZ, and NI-3Br are 432 ms (Figure S30a, Supporting Information File 1), 376 ms (Figure S30b), and 4 ms (Figure S30c), respectively.
![[1860-5397-18-149-5]](/bjoc/content/figures/1860-5397-18-149-5.png?scale=2.0&max-width=1024&background=FFFFFF)
Figure 5: (a) Phosphorescence spectra of NI-PTZ-O; (b) decay traces of the phosphorescence of the compounds NI-PTZ-O. λex = 340 nm, at 77 K, in 2-methyltetrahydrofuran, c = 1.0 × 10⁻⁵ M.
Figure 5: (a) Phosphorescence spectra of NI-PTZ-O; (b) decay traces of the phosphorescence of the compounds N...
The photophysical properties of all compounds are compiled in Table 1. The fluorescence quantum yields of the dyads (1.0% to ≈4.5%) are generally much lower than those of the amino-NI derivatives (60% to ≈70%) [20]. In order to have a preliminary evaluation of the ISC of the compounds, the singlet oxygen quantum yields (ΦΔ) were studied in several solvents (Table 1 and Table 2). For NI-PTZ, ΦΔ is high in HEX (19%), which is similar to the value previously reported for the analogous dyad NI-N-PTZ (ΦΔ = 16%) [20]. However, ΦΔ is lower in CHX (ΦΔ = 8%) and negligible in other solvents with higher polarity. In contrast, NI-PTZ-O, NI-PTZ2, NI-Ph-PTZ, and NI-PhMe2-PTZ show much larger ΦΔ values in HEX (20% to ≈50%), respectively. For NI-3Br and NI-Ph-Br, ΦΔ are much larger, up to 100% in dichloromethane (DCM) and ACN, likely due to the heavy-atom effect.
Table 1: Photophysical parameters of the compounds.
| Compound | Solvent | λabs (nm)a | εb | λem (nm)c | τF (ns)d | τP (ms)e | ΦF (%)f | ΦΔ (%)g |
| NI-PTZ | CHX | 327 | 1.5 | 605 |
9.9 (99.7%)
250 (0.3%) |
–h | 1.9 | 8 |
| HEX | 325 | 1.5 | 644 |
7.6 (99.8%)
190 (0.2%) |
1.7 | 19 | ||
| NI-PTZ-O | CHX | 329 | 2.0 | 468 |
3.4 (99%)
18.1 (1%) |
363 | 2.0 | 33 |
| HEX | 327 | 2.0 | 472 |
3.1 (99%)
21.2 (1%) |
1.2 | 37 | ||
| TOL | 335 | 2.0 | 542 |
4.3 (99%)
19.8 (1%) |
2.0 | 53 | ||
| NI-PTZ2 | CHX | 295 | 2.7 | 630 |
5.8 (99.6%)
260 (0.4%) |
–h | 1.9 | 1 |
| HEX | 301 | 2.4 | 644 |
4.9 (99.6%)
200 (0.4%) |
1.7 | 38 | ||
| NI-Ph-PTZ | CHX | 332 | 1.4 | 490 |
1.3 (54%)
5.4 (46%) |
432 | 4.2 | 31 |
| HEX | 332 | 1.4 | 482 |
1.2 (77%)
4.5 (23%) |
4.1 | 28 | ||
| TOL | 336 | 1.3 | 585 |
0.9 (31%)
14.1 (69%) |
4.5 | 34 | ||
| NI-PhMe2-PTZ | CHX | 328 | 1.6 | 479 |
1.6 (56%)
12.9 (44%) |
376 | 1.3 | 35 |
| HEX | 329 | 1.6 | 478 |
1.2 (51%)
7.2 (49%) |
1.0 | 42 | ||
| TOL | 333 | 1.6 | 595 |
2.7 (22%)
18.7 (78%) |
1.3 | 40 | ||
aMaximal UV–vis absorption wavelength, c =1.0 × 10⁻⁵ M, 20 °C; bmolar absorption coefficient at absorption maxima, ε: 104 M−1 cm−1; cemission wavelength; dfluorescence lifetime, λex = 340 nm; ephosphorescence lifetime, λex = 340 nm, in 2-methyltetrahydrofuran; ffluorescence quantum yields determined, λex = 330 nm; gsinglet oxygen quantum yields, Ru(bpy)3[PF6]2 was used as standard compound (ΦΔ = 57% in DCM); hnot observed.
Table 2: Singlet oxygen quantum yields (ΦΔ, in%) in different solventsa.
| Compound | CHX | HEX | TOL | DCM | ACN |
| NI-PTZ | 8 | 19 | –b | –b | –b |
| NI-PTZ-O | 33 | 37 | 53 | 90 | 9 |
| NI-PTZ2 | 1 | 38 | –b | –b | –b |
| NI-Ph-PTZ | 31 | 28 | 34 | –b | –b |
| NI-PhMe2-PTZ | 35 | 42 | 40 | –b | –b |
| NI-3Br | 33 | 38 | 46 | 100 | 100 |
| NI-Ph-Br | 30 | 39 | 50 | 100 | 100 |
aThe ET (30) values of the solvents are 30.9 (CHX), 31.0 (HEX), 33.9 (TOL), 40.7 (DCM), and 45.6 (ACN), respectively, in kcal mol−1. Singlet oxygen quantum yield (ΦΔ) with Ru(bpy)3[PF6]2 as standard (ΦΔ = 0.57 in DCM) in different solvents, λex = 437 nm; bnot observed.
Electrochemistry study
The redox potentials of the dyads were studied with cyclovoltammetry (Figure 6, Table 3), and the Gibbs free energy changes of the charge separation (ΔGCS) and charge separation states energy levels (ECS) of the compounds were calculated (Table 4). A reversible oxidation wave at +0.36 V (vs Fc/Fc+) was observed for NI-PTZ, which is attributed to the oxidation of the PTZ units. A reversible reduction wave at −1.75 V (vs Fc/Fc+) was observed, which is attributed to the reduction of the NI moiety. These reduction potentials are similar to the ones previously reported for the NI-N-PTZ dyad (+0.39, −1.72). However, for NI-PTZ-O, an irreversible oxidation wave at +1.09 V (vs Fc/Fc+) was observed, which indicates that, upon oxidation, the PTZ moiety becomes a poor electron donor. A reversible reduction wave at −1.57 V was observed, which is cathodically shifted as compared to that of NI-PTZ, an expected trend considering the poor electron-donating ability of the oxidized PTZ moiety.
![[1860-5397-18-149-6]](/bjoc/content/figures/1860-5397-18-149-6.png?scale=2.0&max-width=1024&background=FFFFFF)
Figure 6: Cyclic voltammograms of the compounds. NI-PTZ, NI-PTZ2, NI-Ph-PTZ, and NI-PhMe2-PTZ were studied in deaerated DCM; NI-PTZ-O in deaerated ACN. Ferrocene (Fc) was used as internal reference (set as 0 V in the cyclic voltammograms). 0.10 M Bu4NPF6 as supporting electrolyte. Scan rates: 100 mV/s, c = 1.0 × 10⁻³ M, 20 °C.
Figure 6: Cyclic voltammograms of the compounds. NI-PTZ, NI-PTZ2, NI-Ph-PTZ, and NI-PhMe2-PTZ were studied in...
Table 3: Electrochemical redox potentials of the compounds.a
| Compound | E(ox)/V | E(red)/V |
| NI-PTZb | +0.36 | −1.75 |
| NI-PTZ-Oc | +1.09 | −1.57 |
| NI-PTZ2b | +0.38 | −1.63 |
| NI-Ph-PTZb | +0.29 | −1.82 |
| NI-PhMe2-PTZb | +0.25 | −1.84 |
| NI-3Brb | –d | −1.56 |
| NI-N-PTZb | +0.39 | −1.72 |
aCyclic voltammetry in N2-saturated solvents containing 0.10 M Bu4NPF6. Pt electrode as the counter electrode, glassy carbon electrode as the work electrode, ferrocene (Fc/Fc+) as the internal reference (set as 0 V in the cyclic voltammograms), and Ag/AgNO3 couple as the reference electrode; bin DCM; cin ACN; dnot observed.
Table 4: Gibbs free energy changes of the charge separation (ΔGCS) and charge separation states energy (ECS) of the compoundsa.
| Compound | ΔGCS (eV) | ECS (eV) | |||||||
| HEX | TOL | DCM | ACN | HEX | TOL | DCM | ACN | ||
| NI-PTZb | −0.38 | −0.51 | −0.85 | −0.95 | 2.28 | 2.15 | 1.81 | 1.71 | |
| NI-PTZ-Oc | −0.23 | −0.29 | −0.47 | −0.52 | 2.88 | 2.81 | 2.63 | 2.58 | |
| NI-PTZ2d | −0.29 | −0.34 | −0.93 | −1.06 | 2.39 | 2.24 | 1.75 | 1.62 | |
| NI-Ph-PTZe | −0.04 | −0.28 | −1.10 | −1.31 | 2.98 | 2.74 | 1.92 | 1.71 | |
| NI-PhMe2-PTZf | −0.07 | −0.32 | −1.16 | −1.37 | 3.00 | 2.75 | 1.91 | 1.70 | |
aCyclic voltammetry in deaerated solutions containing 0.10 M Bu4NPF6. Pt electrode as counter electrode, glassy carbon electrode as working electrode, and Ag/AgNO3 couple as the reference electrode; bE00 = 2.66 eV; cE00 = 3.11 eV; dE00 = 2.68 eV; eE00 = 3.02 eV; fE00 = 3.07 eV. E00 (E00 = 1240/λ) is the singlet state energy of compounds, λ is the wavelength of the crossing point of normalized UV–vis absorption spectra and fluorescence emission spectra.
However, the data of NI-PTZ2 shows less intuitive trends, as a reversible reduction wave is observed at −1.63 V (vs Fc/Fc+), which is not in line with the presence of two electron-donating PTZ moieties – one would expect, the reduction potential of NI-PTZ2 should be more negative than the one for NI-PTZ. Slightly lower oxidation potentials were observed for NI-Ph-PTZ and NI-PhMe2-PTZ. However, the 0.04 eV difference in the oxidation potentials of these two dyads indicates that the different conformational restriction affects the electronic coupling between the NI and PTZ moieties. To help the assignment of the possible CT states in the time-resolved spectra (see later section), the spectroelectrochemistry of the compounds was studied (Figure 7).
![[1860-5397-18-149-7]](/bjoc/content/figures/1860-5397-18-149-7.png?scale=2.0&max-width=1024&background=FFFFFF)
Figure 7: Spectroelectrochemistry traces of the UV–vis absorption spectra for (a) NI-PTZ observed from neutral (red) to monoanion (purple) with a potential of −1.83 V applied; (b) NI-PTZ observed from neutral (red) to monocationic (purple) at a potential of 0.53 V applied; (c) NI-PTZ-O observed from neutral (red) to monoanion (purple) at controlled-potential of −1.80 V; (d) NI-PTZ-O observed from neutral (red) to monocationic (purple) at controlled-potential of 2.00 V. In deaerated DCM containing 0.10 M Bu4[NPF6] as supporting electrolyte and with Ag/AgNO3 as reference electrode, 20 °C.
Figure 7: Spectroelectrochemistry traces of the UV–vis absorption spectra for (a) NI-PTZ observed from neutra...
For NI-PTZ, when a positive potential of +0.53 V (vs Ag/AgNO3) was applied, the hallmark absorption bands of the PTZ•+ radical cation centered at 516, 794, and 891 nm are observed [20]. These bands are similar to the ones observed for the previously reported NI-N-PTZ dyad. Upon a negative potential at −1.83 V (vs Ag/AgNO3) applied, the absorption bands of the NI•− radical anion at 424, 492, 720, and 801 nm are observed, which are also similar to the ones of the analogous dyad [20]. For NI-PTZ-O, similar NI•− absorption bands were observed. However, the PTZ•+ absorption bands of NI-PTZ-O are less resolved as compared to those of NI-PTZ (Figure 7a). These results indicate the effect of oxidation of the PTZ moiety.
The spectroelectrochemistry traces of NI-Ph-PTZ, NI-PTZ2, and NI-PhMe2-PTZ were also studied (Supporting Information File 1, Figure S31). For NI-Ph-PTZ, the NI•− absorption bands in the 350–600 nm range are less resolved than for NI-PTZ. This likely comes from the effect of the π-conjugation of the phenyl ring with the NI moiety in NI-Ph-PTZ. In contrast, the PTZ•+ absorption band of NI-Ph-PTZ resembles the one of NI-PTZ, indicating that the spin density of PTZ•+ in NI-Ph-PTZ is confined on the PTZ moiety, and does not significantly spread on the phenyl linker. The spectroelectrochemistry of NI-PhMe2-PTZ shows that the NI•− absorption band in this dyad is similar to that of NI-PTZ, but not to the one of NI-Ph-PTZ. This illustrates the impact of the conformational restriction on the photophysical properties of NI-PhMe2-PTZ.
We underline that the absorption of the CT states of the dyads may not be the “simple sum” of the absorption of the radical cation and the radical anion of the dyads, obtained by the spectroelectrochemistry (Figure 7). The reason is that, in spectroelectrochemistry, one forms either D•+–A or D–A•−, but not D•+–A•−. When photoexciting the dyads, however, the CT (D•+–A•−) state is formed resulting in a different exciton binding energy related to the interaction between the radical anion and cation; this interaction being far from negligible in compact dyads.
Nanosecond transient absorption (ns-TA) spectra
In order to identify the lowest-lying transient species of the dyads and the triad formed upon photoexcitation, the ns-TA spectra of the compounds were recorded (Figure 8). For the reference NI-3Br (Figure S33a, Supporting Information File 1), sharp excited state absorption (ESA) bands centered at 360 and 470 nm were observed in HEX, and a 63 μs lifetime was determined. For NI-PTZ, positive absorption bands centered at 360, 470, 390, and 520 nm were observed upon pulsed laser in HEX (Figure 8a). This absorption profile drastically differs from the absorption of the radical anion and the cation (see Figure 7a and b) and that of NI-3Br. It is also different from the previously studied analogous dyad, for which a CT state was observed [20]. Thus, we tentatively propose that a 3LE state was observed for NI-PTZ. The lifetime of the transient species was determined as 16 μs. This lifetime is much longer than that observed for the analogous dyad (2.6 μs), which was assigned to a CT state [20]. This conclusion is supported by the fact that the 3LE state energy (2.27 eV) of NI-PTZ is slightly lower than its CT state (2.34 eV, approximated from the CT emission band, Figure 3a). Discrepancy results were observed for NI-PTZ2 (Figure 8c) and the lifetime was determined to be 4 μs (Figure 8f). In this case the 3LE and CT states share similar energy, the CT state energy is 2.25 eV (approximated from the CT emission band, Figure 3c), and the 3LE state energy, 2.27 eV. Observation of a long-lived CT state in compact donor–acceptor dyads is rare [49-51], the CR of 3CT→S0 is spin forbidden, the 3CT state should be longer-lived than the 1CT state, which is attributed to the electron spin control effect [15,52-57]. These results confirm that the molecules showing TADF can have either a lowest-lying CT state or a lowest-lying 3LE state.
![[1860-5397-18-149-8]](/bjoc/content/figures/1860-5397-18-149-8.png?scale=2.0&max-width=1024&background=FFFFFF)
Figure 8: Nanosecond transient absorption spectra of (a) NI-PTZ (c = 1.5 × 10⁻⁴ M), (b) NI-PTZ-O (c = 2.5 × 10⁻⁴ M), and (c) NI-PTZ2 (c = 5.0 × 10⁻⁵ M). The corresponding decay traces are (d) NI-PTZ (c = 5.0 × 10⁻⁶ M) at 520 nm, (e) NI-PTZ-O (c = 2.0 × 10⁻⁶ M) at 530 nm, and (f) NI-PTZ2 (c = 6.0 × 10⁻⁶ M) at 510 nm. In deaerated HEX, λex = 355 nm, 20 °C.
Figure 8: Nanosecond transient absorption spectra of (a) NI-PTZ (c = 1.5 × 10⁻⁴ M), (b) NI-PTZ-O (c = 2.5 × 10...
The ns-TA spectra of NI-PTZ-O were also studied (Figure 8b). Upon oxidation of the PTZ moiety, the CT state energy increases by 0.6 eV as compared to that of NI-PTZ (Table 4). However, the ESA bands of NI-PTZ-O are close to those of NI-PTZ. Thus, we tentatively assign the transient species as 3LE state of NI-PTZ-O, and that the 3LE state stands as the lowest-lying triplet state with an energy of 2.29 eV based on the low temperature phosphorescence, significantly below the estimated value of 2.88 eV for the CT state (approximated from the CT absorption band, Figure 1). The longer lifetime of NI-PTZ-O infers that for NI-PTZ, CT state sharing similar energy with 3LE may drain the excited state and shorten the triplet state lifetime.
The ns-TA spectra of NI-Ph-PTZ and NI-PhMe2-PTZ were also studied (Figure S32 in Supporting Information File 1). For these two dyads, especially NI-PhMe2-PTZ, the ESA bands and the triplet state lifetimes (43 μs) are similar to those of NI-3Br, and the 3LE state is therefore observed in these two dyads. Interestingly, the conformation restriction in NI-PhMe2-PTZ leads to literally the same ESA bands as in NI-3Br. Due to the large separation of the electron donor and acceptor, the CT state energy is increased by ca. 0.7 eV as compared to that of NI-PTZ (Table 4). In NI-PhMe2-PTZ, the CT state energy is 3.02 eV (approximated from the CT emission band, Figure S26 in Supporting Information File 1), and the 3LE state energy attains 2.27 eV (approximated from the low temperature phosphorescence). For NI-Ph-PTZ, the CT state energy is 2.99 eV (approximated from the CT emission band, Figure 3d), and the 3LE state energy is 2.24 eV (approximated from the low temperature phosphorescence). Therefore, it is evident that the 3LE state is the lowest-lying triplet state in both NI-Ph-PTZ and NI-PhMe2-PTZ.
It is known that the CT state energy decreases substantially when increasing the solvent polarity. For instance, in NI-PTZ, the CT state lies at 2.28 eV in HEX (Table 4), but only at 1.71 eV in ACN, whereas the 3LE state is much less sensitive to the polarity and remains at ca. 2.27 eV. Therefore, the ns-TA spectra of the dyads in ACN were studied as well (Figure S34 in Supporting Information File 1). For NI-PTZ, positive absorption bands centered at 420 nm and a minor band at 510 nm were observed. These absorption bands are different from the ns-TA of NI-PTZ in HEX, however, a feature which is similar to the one found in NI-N-PTZ [20]. In other words, the transient species of NI-PTZ in ACN upon photoexcitation corresponds to be a CT rather than the 3LE state. The CT state lifetime was determined to be 0.37 μs (Figure S34b, Supporting Information File 1), and it is ca. twice longer than the CT state lifetime of NI-N-PTZ measured in the same experimental conditions (ca. 0.16 μs, Figure S34d). The CT state lifetime of NI-PTZ is rather long, considering the compact dyad structure and the low CT energy in ACN (ca. 1.71 eV). For NI-PTZ2, the CT state was measured in ACN as well, and a 189 ns lifetime was determined (Figure S35a in Supporting Information File), hinting that the CT state observed in the NI-PTZ2 ns-TA experiments is in fact a 3CT state, rather than a 1CT state. Indeed, the luminescence studies have shown that the lifetime of 1CT state is short with prompt fluorescence on ns timescale.
In comparison, we also studied the triplet state ns-TA spectra of the reference compound NI-3Br in ACN (see Supporting Information File 1, Figure S33c), and the data were compared to the ns-TA spectra in HEX. The results show that NI-3Br has similar ns-TA spectral features in both HEX and ACN, and the triplet state lifetime are similar in both solvents (63 μs and 118 μs, respectively). Similar results were observed for NI-Ph-Br, the triplet state lifetimes are 45 μs and 108 μs in HEX and ACN, respectively (Figure S36, Supporting Information File 1). For NI-PTZ-O, 3LE and 3CT states were observed in ACN, and the lifetime was determined as 71 μs (Figure S35c).
Computational investigations
To explain the experimental results, quantum chemical calculations were used to obtain additional insights into both the excited states involved and the photo-deactivation dynamics. First, the ground state geometry of the compounds was optimized (Figure 9). For the compact NI-PTZ and NI-PTZ-O dyads, the two units adopt almost orthogonal geometry. A similar result was observed for the triad NI-PTZ2. For the dyads containing a phenyl linker between the NI and the PTZ moieties, the steric hindrance imposed by the methyl substituents on the phenyl linker is significant: the dihedral angle between the NI and the phenyl linker is 37° only in NI-Ph-PTZ, but it increases up to 84° in NI-PhMe2-PTZ. In NI-Ph-PTZ, the dihedral angle between the NI and the PTZ is ca. 55°, and it increases up to 87° in NI-PhMe2-PTZ.
![[1860-5397-18-149-9]](/bjoc/content/figures/1860-5397-18-149-9.png?scale=2.0&max-width=1024&background=FFFFFF)
Figure 9: Optimized ground state geometry of (a) NI-PTZ, (b) NI-PTZ-O, (c) NI-PTZ2, (d) NI-Ph-PTZ, and (e) NI-PhMe2-PTZ; the green and orange sheets show the planes of the donor and the receptor.
Figure 9: Optimized ground state geometry of (a) NI-PTZ, (b) NI-PTZ-O, (c) NI-PTZ2, (d) NI-Ph-PTZ, and (e) NI...
As shown in Table S1 (Supporting Information File 1), for all compounds, S1 corresponds to a HOMO→LUMO electronic transition (see the molecular orbitals involved in Figure 10) at the Franck–Condon region. The spatial separation between the HOMO and LUMO orbitals along with the very small calculated oscillator strengths (see Table S1 and Table S2, Supporting Information File 1) are clear indicators of a CT character for S1. Relaxation on the lowest triplet excited state potential energy surfaces leads to different scenarios for the studied compounds as shown in Table S2: a 3CT character is found for the lowest triplet excited state (T1) of NI-PTZ and a considerable 3CT character is found for the T1 of NI-N-PTZ and NI-PTZ2. Conversely, for NI-PhMe2-PTZ, NI-Ph-PTZ, and NI-PTZ-O a predominant 3LE character is found at the T1 optimized minima (see Table S2). Note that, at the Frank–Condon region, T1 corresponds to a 3LE state for all the compounds (see Table S1). Thus, in NI-PTZ-O, the relaxation on the T1 and T2 potential energy surfaces leads to the same state ordering between the 3LE and 3CT states with respect to the Franck–Condon region, i.e., the 3LE state remains the lowest triplet excited state at both the Franck–Condon region and at its optimized geometry. T1 corresponds to a 3LE state localized on the acceptor ligand and it predominantly involves a HOMO-2-to-LUMO electronic excitation (see Figure 10 for the orbitals). For the same compound, T2 corresponds to a HOMO→LUMO transition with a predominant 3CT character. The computed triplet energies (see Table S2) are in reasonable agreement with the experimental ones. More in details, the experimental emission maximum for the for 3LE band peaks at 2.29 eV, which reasonably matches the computed one (2.02 eV). Note that experimentally, the 3LE state was still observed to be the lowest triplet state for NI-PTZ. In this respect, the computed energetic difference between T1 and T2 falls within the typical TD-DFT error bar (ca. 0.3 eV), which explains the difference in state ordering between experiments and calculations. Note also, that the experimental results point to a small energetic difference between the 3LE and 3CT states, as triplet state lifetime is shorter than the pristine 3NI state.
![[1860-5397-18-149-10]](/bjoc/content/figures/1860-5397-18-149-10.png?scale=2.0&max-width=1024&background=FFFFFF)
Figure 10: Kohn–Sham frontier molecular orbitals (CAM-B3LYP/6-31G(d) in gas phase) involved in S1, T1, and T2 of NI-N-PTZ, NI-PTZ, NI-PTZ-O, NI-PTZ2, NI-Ph-PTZ, and NI-PhMe2-PTZ, based on the optimized ground state geometries. An isovalue of 0.02 is used.
Figure 10: Kohn–Sham frontier molecular orbitals (CAM-B3LYP/6-31G(d) in gas phase) involved in S1, T1, and T2 ...
For completeness, Table S3 (Supporting Information File 1) reports the adiabatic and vertical energies of the 3LE and 3CT states for NI-PTZ and NI-PTZ-O (as representative cases of the different photophysical scenarios within the series of compounds) along with the state ordering at the 1CT optimized geometries. Comparing NI-PTZ-O with NI-PTZ at their 1CT optimized geometries, a different ordering of the triplet excited states is obtained. More in details, for NI-PTZ-O, both 3LE (2.63 eV) and 3CT (3.09 eV) are lower in energy than the 1CT state (3.12 eV), but for NI-PTZ the 3LE state (2.74 eV) is higher in energy than the 1CT state (2.60 eV), while 3CT remains slightly lower in energy (2.57 eV). This has some important consequences on the TADF mechanisms.
Table 5 lists spin–orbit couplings matrix elements (SOCMEs) between 1CT, 3LE, and 3CT states. The SOCMEs between 1CT and 3CT are small, 0.03 cm−1 at most, which was expected as they involve the same electronic transitions. Conversely, the SOCMEs between 1CT and 3LE amount up to 0.47 cm−1 in the case of NI-PTZ-O. For NI-PTZ the computed ISC rate from 1CT towards 3LE attains to 2.92 × 10⁷ s−1, which is two orders of magnitude larger than the ISC rate towards 3CT (8.51 × 10⁵ s−1). The RISC from 3CT (2.79 ×10⁵ s−1) back to 1CT is large enough to compete with other photodeactivation processes, so TADF is likely. In order to further proof this, we also calculated the phosphorescence rate (kphos; see Experimental section, Computational details). The computed kphos amounts up to 6.85 × 10⁻¹ s−1, thus confirming that phosphorescence from 3CT is not competitive with RISC, also in agreement with the experimental evidences. For NI-PTZ-O, the fastest rate of ISC is found for the 1CT→3LE transition (4.12 × 10⁶ s−1). Conversely, the RISC process from the 3LE state is very unlikely to occur, as the back process to 1CT is characterized by a large energy gap (ca. 0.49 eV, see Table S3 in Supporting Information File 1), thus explaining the different TADF properties experimentally measured for NI-PTZ-O and NI-PTZ. The analysis of the computed reorganization energies for selected (R)ISC processes of NI-PTZ-O and NI-PTZ and the activation barriers derived from these values clearly highlight the same trends obtained with the rate calculations [58]. For instance, a negligible RISC decay rate for the 3LE→1CT process in NI-PTZ-O roots on a large adiabatic energy difference and an even larger reorganization energy (0.75 and 1.92 eV, respectively), which lead to an activation barrier of ca. 3.42 eV (see details in Supporting Information File 1). Conversely, the sizable value of the RISC rate for the for the 3LE→1CT process in NI-PTZ roots on a small adiabatic energy difference and a similar value for the reorganization energy (0.23 vs 0.53 eV, respectively). This results in an activation barrier for the RISC process of ca. 0.076 eV, which is small enough to enable the RISC process at room temperature.
Table 5: Calculated SOCMEs (cm−1) and computed rates (s−1) along with selected reorganization energies (values between brackets in eV) for the (R)ISC processes NI-PTZ and NI-PTZ-O.
| Molecule | SOCME (cm−1) | kISC (s−1)a | kRISC (s−1)a | |||||
| 1CT–3LE | 1CT–3CT | 1CT–3LE | 1CT–3CT | 1CT–3LE | 1CT–3CT | |||
| NI-PTZ | 0.33 | 0.03 | 2.92 × 10⁷ | 8.51 × 10⁵ |
3.79 × 10⁵
(0.53)b |
2.79 × 10⁵ | ||
| NI-PTZ-O | 0.47 | 0.02 | 4.12 × 10⁶ | 1.23 × 10⁵ |
0
(1.92)b |
8.13 × 10⁴ | ||
aRates obtained by making use of the vertical hessian model as implemented in FCclasses. All computations are performed in the gas phase. bReorganization energies (in eV) for the RISC processes.
In Scheme 2, a summary of the photodeactivation pathways for NI-PTZ and NI-PTZ-O is presented. In addition, the impact of solvent on the energy of the states is included. When moving from apolar to polar solvents a little increase in the energy gap between 1CT and 3LE is observed (amounting to up to 0.13 eV in acetonitrile), which is mostly due to the stabilization of 3LE (0.23 eV for NI-PTZ and 0.30 eV for NI-PTZ-O) while the 1CT state is only stabilized by 0.10 eV and 0.17 eV, respectively for both NI-PTZ and NI-PTZ-O. Comparing the computed energies (Scheme 2) with the experimental energies (see Table 4) results in a reasonable agreement, especially in a polar solvent (ACN), where the experimental energy of NI-PTZ for the 1CT state is 1.71 eV and the computed energy, 1.74 eV. For NI-PTZ-O the experimental energy of the 3CT in ACN is 2.58 eV, while the computed energy, 2.82 eV, deviates more from the experiment (0.24 eV), but remains in a reasonable agreement with the measured values. The CT character of the 1CT and 3CT states is visible in the electronic density difference (EDDs) plots shown in Scheme 2, which clearly indicates the flow of electron density from the PTZ to the NI moieties. Conversely, the LE states are fully localized within the acceptor fragment.
![[1860-5397-18-149-i2]](/bjoc/content/inline/1860-5397-18-149-i2.png?scale=2.0&max-width=1024&background=FFFFFF)
Scheme 2: Jablonski diagram of (a) NI-PTZ and (b) NI-PTZ-O, including electron density difference (EDD) at T2 (3LE) geometry and computed in gas phase. EDD isovalues are 0.02 au. The cyan and blue lobes of the EDD indicate increase and decrease of electron density, respectively. The energies in eV were obtained with single point calculations on optimized S1, T1, and T2 geometry in HEX, DCM, TOL, and ACN.
Scheme 2: Jablonski diagram of (a) NI-PTZ and (b) NI-PTZ-O, including electron density difference (EDD) at T2...
Conclusion
In order to study the impact of the energy matching between the charge-transfer (CT) and localized triplet excited (3LE) states on the thermally activated delayed fluorescence (TADF), a series of compact electron donor–acceptor dyads and a triad were prepared. In the dyads and the triad, naphthalimide (NI) was used as electron acceptor and phenothiazine (PTZ) as electron donor. The NI and PTZ moieties are either directly connected at the 3-position of NI and the N-position of the PTZ moiety via a C–N single bond, or connected through an intervening phenyl linker. Tuning the electron-donating ability of the PTZ unit, and consequently the CT state energy, was achieved by its oxidation to yield the corresponding sulfoxide. The conformation restriction was imposed through introducing ortho-methyl substituents on the phenyl linker. TADF was observed for the dyads and the triad, indicated by the biexponential fluorescence decay, for instance 16.0 ns (99.9%)/14.4 μs (0.1%). Singlet oxygen photosensitizing experiments showed that the ΦΔ of NI-PTZ is moderate in HEX (ΦΔ = 19%), but that upon oxidation of the PTZ unit in the dyad much larger values were observed for the resulted dyad NI-PTZ-O (up to 90% in DCM) due to the increase of the CT state energy. In nanosecond transient absorption spectra in HEX, in general a 3LE state was observed (lifetime: 16–48 μs). For all the compounds, CT emission bands were observed in HEX. In polar solvents, CT state was observed for NI-PTZ, NI-N-PTZ, and NI-PTZ2 (lifetime: 156–365 ns). Computational investigations unambiguously unraveled the origins of TADF in NI-PTZ. Our investigations also underpin the striking photophysical behavior of NI-PTZ-O (i.e., phosphorescence and absence of TADF) which originates from a different excited state ordering between the 3CT and 3LE states in NI-PTZ and NI-PTZ-O. The tuning of the energy order of the 3CT and 3LE state is achieved by the feasible oxidation of the PTZ unit in the dyads, while the other factors kept intact; this approach may become a promising methodology in the study of the entangled excited states and the photophysical processes of TADF molecules based on the electron donor–acceptor dyads structure motif. These studies are also useful to understand the subtle entanglement of the 1LE, 1CT, 3CT, and 3LE states of TADF based on electron donor–acceptor dyads, as well as the photophysical processes of these dyads upon photoexcitation.
Experimental
General methods
All the chemicals used in synthesis are analytical pure and were used as received without purification. UV–vis absorption spectra were measured on a UV-2550 spectrophotometer (Shimadzu Ltd., Japan). Fluorescence emission spectra were recorded with an FS5 spectrofluorometer (Edinburgh instruments Ltd., U.K.). Fluorescence quantum yields (ΦF) were measured by an absolute photoluminescence quantum yield spectrometer (Quantaurus-QY Plus C13534-11, Hamamatsu Ltd., Japan). Luminescence lifetimes of compounds were recorded with an OB920 luminescence lifetime spectrometer (Edinburgh Instruments Ltd., U.K.). NI-PTZ, NI-PTZ-O, NI-PTZ2, NI-Ph-PTZ, and NI-PhMe2-PTZ were prepared according to the literature methods [21,59].
Synthesis of NI-PTZ
Compound NI-PTZ was synthesized in a manner similar to [21]. Under N2 atmosphere, NI-3Br (468.0 mg, 1.209 mmol), phenothiazine (289.0 mg, 1.452 mmol), Pd(OAc)2 (49.2 mg, 0.219 mmol) and sodium tert-butoxide (760.0 mg, 7.908 mmol) were dissolved in dry toluene (22 mL). Then tri-tert-butylphosphine tetrafluoroborate (66.4 mg, 0.229 mmol) was added. The mixture was refluxed and stirred for 8 h under N2. After cooling, water (20 mL) was added, and the mixture was extracted with ethyl acetate (80 mL). The organic layer was separated and washed with water and brine (3 × 30 mL), respectively. The organic layer was combined, dried over anhydrous Na2SO4, and the solvent was evaporated under reduced pressure. The crude product was purified by column chromatography (silica gel, DCM/PE 1:3, v:v). Compound NI-PTZ was obtained as orange solid. Yield: 570 mg (93.1%). Mp 61.9–62.7 °C; 1H NMR (CDCl3, 400 MHz) δ 0.88 (t, J = 14.17 Hz, 3H), 0.94 (t, J = 14.89 Hz, 3H), 1.29–1.34 (m, 4H), 1.36–1.41 (m, 4H), 1.93–1.97 (m, 1H), 4.07–4.17 (m, 2H), 6.61 (d, J = 7.99 Hz, 2H), 6.97–7.03 (m, 4H), 7.22 (d, J = 7.63 Hz, 2H), 7.75–7.77 (m, 1H), 8.08 (s, 1H), 8.13 (d, J = 8.18 Hz, 1H), 8.57 (s, 1H), 8.58 (s, 1H); 13C NMR (CDCl3, 125 MHz) δ 164.40, 163.96, 141.60, 138.00, 133.34, 130.84, 130.44, 129.54, 127.72, 127.22, 126.37, 125.31, 125.01, 124.16, 122.85, 119.77, 44.36, 37.97, 30.77, 29.70, 28.71, 24.08, 23.10, 10.66; HRMS–MALDI (m/z): [M + H]+ calcd for C32H30N2O2S, 506.2028; found, 506.2023.
Synthesis of NI-PTZ-O
Compound NI-PTZ-O was synthesized in a manner similar to [59]. Compound NI-PTZ (200 mg, 0.4 mmol) was dissolved in glacial acetic acid (28 mL), H2O2 (8.2 mL, 30%, 6.5 mmol) was added dropwise. The mixture was stirred at 40 °C overnight. The mixture was poured into water and the pH of the mixture was brought to 7 with a saturated aqueous solution of Na2CO3. After cooling, water (20 mL) was added, and the mixture was extracted with ethyl acetate (80 mL). The organic layer was separated and washed with water and brine solution (3 × 30 mL), respectively. The organic layer was dried over anhydrous Na2SO4 and the solvent was evaporated under reduced pressure. The crude product was purified by column chromatography (silica gel, DCM/MeOH 50:1, v:v). NI-PTZ-O was obtained as yellow solid. Yield: 180 mg (87.2%). Mp 176.2–177.2 °C; 1H NMR (CDCl3, 400 MHz) δ 0.88–0.98 (m, 6H), 1.27–1.43 (m, 8H), 1.95–2.01 (m, 1H), 4.11–4.22 (m, 2H), 6.67 (d, J = 8.26 Hz, 2H), 7.29 (d, J = 7.38 Hz, 2H), 7.38–7.42 (m, 2H), 7.88–7.92 (m, 1H), 8.05 (d, J = 7.38 Hz, 2H), 8.28 (d, J = 8.00 Hz, 1H), 8.42 (s, 1H), 8.62 (s, 1H), 8.76 (d, J = 7.13 Hz, 1H); 13C NMR (CDCl3, 125 MHz) δ 164.51, 139.11, 138.73, 138.17, 133.68, 133.51, 132.44, 131.95, 131.22, 130.44, 127.36, 123.27, 122.83, 121.64, 44.27, 37.98, 30.75, 28.71, 24.07, 23.10, 20.81, 10.66; HRMS–MALDI (m/z): [M + H]+ calcd for C32H30N2O3S, 522.1977; found, 523.2050.
Synthesis of NI-PTZ2
Compound NI-PTZ2 was synthesized in a manner similar to [21]. Under N2 atmosphere, compound 1 (190.0 mg, 0.409 mmol), phenothiazine (294.5 mg, 1.478 mmol), Pd(OAc)2 (36 mg, 0.160 mmol), and sodium tert-butoxide (317.0 mg, 3.299 mmol) were dissolved in dry toluene (12 mL). Then, tri-tert-butylphosphine tetrafluoroborate (53.0 mg, 0.183 mmol) was added. The mixture was refluxed and stirred for 24 h under N2. After cooling, water (20 mL) was added, and the mixture was extracted with ethyl acetate (80 mL). The organic layer was separated and washed with water and brine (3 × 30 mL), respectively. The organic layer was dried over anhydrous Na2SO4 and the solvent was evaporated under reduced pressure. The crude product was purified by column chromatography (silica gel, DCM/PE 1:4, v:v). Compound NI-PTZ2 was obtained as orange solid. Yield: 230 mg (80.0%). Mp 100.1–101.0 °C; 1H NMR (CDCl3, 400 MHz) δ 0.86–0.94 (m, 6H), 1.30–1.41 (m, 8H), 1.90–1.96 (m, 1H), 4.03–4.14 (m, 2H), 6.77 (m, 4H), 7.01–7.11 (m, 8H), 7.25 (d, J = 1.51 Hz, 2H), 7.86 (d, J = 2.12 Hz, 2H), 8.46 (d, J = 2.12 Hz, 2H); 13C NMR (CDCl3, 125 MHz) δ 163.94, 142.79, 135.00, 127.96, 127.82, 126.96, 126.23, 124.62, 123.50, 121.13, 44.52, 37.95, 30.75, 29.70, 28.72, 24.06, 23.10, 10.66; HRMS–MALDI (m/z): [M + H]+ calcd for C44H37N3O2S2, 703.2327; found, 703.2322.
Synthesis of NI-Ph-PTZ
Compound NI-Ph-PTZ was synthesized in a manner similar to [21]. Under N2 atmosphere, compound 2 (51 mg, 0.110 mmol), phenothiazine (26.3 mg, 0.132 mmol), Pd(OAc)2 (4.5 mg, 0.020 mmol), and sodium tert-butoxide (69.1 mg, 0.720 mmol) were dissolved in dry toluene (3 mL). Then, tri-tert-butylphosphine tetrafluoroborate (6.1 mg, 0.021 mmol) was added. The mixture was refluxed and stirred for 8 h under N2. After cooling, water (20 mL) was added, and the mixture was extracted with ethyl acetate (80 mL). The organic layer was separated and washed with water and brine solution (3 × 30 mL), respectively. The organic layer was dried over anhydrous Na2SO4 and the solvent was evaporated under reduced pressure. The crude product was purified by column chromatography (silica gel, DCM/PE 6:1, v:v). The product NI-Ph-PTZ was obtained as yellow solid. Yield: 40 mg (62.4%). Mp 126.7–128.3 °C; 1H NMR (CDCl3, 400 MHz) δ 0.94–0.97 (m, 6H), 1.33–1.42 (m, 8H), 1.97 (s, 1H), 4.12–4.22 (m, 2H), 6.41 (d, J = 6.75 Hz, 2H), 6.87–6.93 (m, 4H), 7.10 (d, J = 6.63 Hz, 2H), 7.54 (d, J = 7.13 Hz, 2H), 7.80–7.83 (m, 1H), 7.99 (d, J = 6.63 Hz, 2H), 8.29 (d, J = 8.13 Hz, 1H), 8.46 (s, 1H), 8.62 (d, J = 6.38 Hz, 1H), 8.94 (s, 1H); 13C NMR (CDCl3, 125 MHz) δ 164.54, 139.04, 138.63, 133.96, 132.17, 131.18, 130.58, 129.86, 127.54, 127.46, 126.82, 123.47, 122.80, 117.10, 44.25, 38.01, 30.80, 29.36, 28.75, 24.11, 23.09, 10.69; HRMS–MALDI (m/z): [M + H]+ calcd for C38H34N2O2S, 582.2341; found, 582.2336.
Synthesis of NI-PhMe2-PTZ
Compound NI-PhMe2-PTZ was synthesized in a manner similar to [21]. Under N2 atmosphere, compound 3 (142 mg, 0.290 mmol), phenothiazine (69.3 mg, 0.348 mmol), Pd(OAc)2 (11.7 mg, 0.052 mmol), and sodium tert-butoxide (182.4 mg, 1.898 mmol) were dissolved in dry toluene (5 mL). Then, tri-tert-butylphosphine tetrafluoroborate (16.1 mg, 0.055 mmol) was added. The mixture was refluxed and stirred for 8 h under N2. After cooling, water (20 mL) was added and the mixture was extracted with ethyl acetate (80 mL). The organic layer was separated and washed with water and brine solution (3 × 30 mL), respectively. The organic layer was dried over anhydrous Na2SO4 and the solvent was evaporated under reduced pressure. The crude product was purified by column chromatography (silica gel, DCM/PE 1:5, v:v). The product NI-PhMe2-PTZ was obtained as yellow solid. Yield: 50 mg (28.3%). Mp 121.2–122.4 °C; 1H NMR (CDCl3, 400 MHz) δ 0.89–0.97 (m, 6H), 1.33–1.43 (m, 8H), 1.94–2.01 (m, 1H), 1.98 (t, 1H), 2.12 (s, 6H), 4.11–4.22 (m, 2H), 6.36 (s, 2H), 6.91 (s, 3H), 7.00–7.05 (m, 3H), 7.20 (s, 2H), 7.80–7.84 (m, 1H), 8.12 (s, 1H), 8.25 (d, J = 8.13 Hz, 1H), 8.50 (s, 1H), 8.65 (d, J = 7.26 Hz, 1H); 13C NMR (CDCl3, 125 MHz) δ 164.55, 139.69, 139.45, 138.85, 133.63, 132.71, 132.03, 131.20, 127.35, 126.84, 123.29, 122.89, 116.24, 44.24, 38.01, 30.78, 29.70, 28.71, 24.11, 23.09, 21.19, 10.67; HRMS–MALDI (m/z): [M + H]+ calcd for C40H38N2O2S, 610.2654; found, 610.2649.
Electrochemical studies
The cyclic voltammetry curves were recorded with a CHI610D electrochemical workstation (CHI instruments, Inc., Shanghai, China) using N2-purged saturated solutions (NI-PTZ, NI-PTZ2, NI-Ph-PTZ, and NI-PhMe2-PTZ in deaerated dichloromethane, NI-PTZ-O in deaerated acetonitrile) containing 0.10 M Bu4NPF6 as a supporting electrolyte, a platinum electrode as counter electrode, a glassy carbon electrode as working electrode, and the Ag/AgNO3 (0.1 M in ACN) couple as the reference electrode. The ferrocenium/ferrocene (Fc+/Fc) redox couple was used as an internal reference. Spectroelectrochemistry was performed using a 0.1 cm path length quartz electrochemical cell equipped with gauze platinum as working electrode, a platinum wire as counter electrode, and Ag/AgNO3 as reference electrode. Bu4N[PF6] was used as the supporting electrolyte. The potential was regulated with a CHI610D electrochemical workstation (CHI instruments, Inc., Shanghai, China), and the spectra were recorded with an Agilent 8453E UV–vis spectrophotometer (Agilent Technologies Inc., USA). Samples were deaerated with N2 for ca. 5 min before measurement and the N2 atmosphere was kept during the measurements.
Nanosecond transient absorption spectroscopy
The nanosecond transient absorption spectra were recorded on a LP920 laser flash photolysis spectrometer (Edinburgh Instruments, Ltd., U.K.). The data (kinetic decay traces and the transient difference absorption spectra) were analyzed with the L900 software. All samples were deaerated with N2 for ca. 15 min in collinear configuration of the pump and probe beams measurements before measurement, and excited with a nanosecond pulsed laser (Quantel Nd: YAG nanosecond pulsed laser). The typical laser power is 65 mJ per pulse.
Computational study
The ground state (S0) geometries of compounds NI-N-PTZ, NI-PTZ, NI-PTZ-O, NI-PTZ2, NI-Ph-PTZ, and NI-PhMe2-PTZ, were optimized with Density Functional Theory (DFT) using the CAM-B3LYP rane-separated hybrid functional in combination with the 6-31G(d) atomic basis set [60]. The excited states geometries of S1, T1, and T2 were optimized with time-dependent DFT (TD-DFT) in its Tamm–Dancoff approximation (TDA) using the same functional and basis sets as in the ground-state optimizations [61]. TDA-TD-DFT is preferred over standard (or “full”) TD-DFT as the former is often more reliable for triplet excited states. Solvent effects were included using the polarizable continuum model (PCM) [62-64]. The above calculations were performed with Gaussian 16 [65]. The spin–orbit matrix elements (SOCME) between the manifold of singlet and triplet excited states were calculated with the pSOC-TD-DFT method, as implemented in ORCA 5.0.2. [61,66,67]. The latter calculations were also performed with CAM-B3LYP using the TDA approximation [61]. In the pSOC-TD-DFT calculations, relativistic effects were considered using the zero-order relativistic approximation (ZORA) and the ZORA-def2-TZVP basis sets [66,68,69]. pSOC-TD-DFT calculations were performed at the S1 optimized geometry [66] for the rate calculations and at the T1 optimized geometry in the case of the phosphorescence rate calculation. The rates of intersystem crossing (ISC) and reverse ISC (RISC) along with the reorganization energies were calculated with FCclasses making use of the vertical hessian vibronic model [70,71]. For the phosphorescence rate (kphos) calculation a simplified Einstein-based expression, i.e,
![[1860-5397-18-149-i3]](/bjoc/content/inline/1860-5397-18-149-i3.svg?max-width=590&scale=1.18182)
was used, where ν is the energy gap between the involved states (in cm−1) and f is the oscillator strength for the T1→S0 process, which was obtained from the pSOC-TD-DFT calculations.
Supporting Information
| Supporting Information File 1: General experimental methods, 1H NMR, 13C NMR, HRMS spectra of the compounds, theoretical computation data and the photophysical data. | ||
| Format: PDF | Size: 2.6 MB | Download |
Acknowledgements
D.J. is indebted to the CCIPL computational center installed in Nantes for the very generous allocation of computational time.
Funding
J. Z. thanks the NSFC (U2001222), the Fundamental Research Funds for the Central Universities (DUT22LAB610) and the State Key Laboratory of Fine Chemicals for financial support. D.E. acknowledges the Research Foundation - Flanders (FWO) and internal KU Leuven funds. D.E., and D.J. are indebted to the PHC program QCQY for supporting their collaboration.
References
-
Cai, X.; Su, S.-J. Adv. Funct. Mater. 2018, 28, 1802558. doi:10.1002/adfm.201802558
Return to citation in text: [1] [2] -
Cao, X.; Zhang, D.; Zhang, S.; Tao, Y.; Huang, W. J. Mater. Chem. C 2017, 5, 7699–7714. doi:10.1039/c7tc02481a
Return to citation in text: [1] [2] -
Im, Y.; Byun, S. Y.; Kim, J. H.; Lee, D. R.; Oh, C. S.; Yook, K. S.; Lee, J. Y. Adv. Funct. Mater. 2017, 27, 1603007. doi:10.1002/adfm.201603007
Return to citation in text: [1] [2] -
Zhang, W.; Song, H.; Kong, J.; Kuang, Z.; Li, M.; Guo, Q.; Chen, C.-f.; Xia, A. J. Phys. Chem. C 2019, 123, 19322–19332. doi:10.1021/acs.jpcc.9b03867
Return to citation in text: [1] -
Fukuzumi, S. Pure Appl. Chem. 2007, 79, 981–991. doi:10.1351/pac200779060981
Return to citation in text: [1] -
Uoyama, H.; Goushi, K.; Shizu, K.; Nomura, H.; Adachi, C. Nature 2012, 492, 234–238. doi:10.1038/nature11687
Return to citation in text: [1] -
Tanaka, H.; Shizu, K.; Miyazaki, H.; Adachi, C. Chem. Commun. 2012, 48, 11392–11394. doi:10.1039/c2cc36237f
Return to citation in text: [1] -
Drummond, B. H.; Aizawa, N.; Zhang, Y.; Myers, W. K.; Xiong, Y.; Cooper, M. W.; Barlow, S.; Gu, Q.; Weiss, L. R.; Gillett, A. J.; Credgington, D.; Pu, Y.-J.; Marder, S. R.; Evans, E. W. Nat. Commun. 2021, 12, 4532. doi:10.1038/s41467-021-24612-9
Return to citation in text: [1] [2] [3] -
Penfold, T. J. J. Phys. Chem. C 2015, 119, 13535–13544. doi:10.1021/acs.jpcc.5b03530
Return to citation in text: [1] -
Ogiwara, T.; Wakikawa, Y.; Ikoma, T. J. Phys. Chem. A 2015, 119, 3415–3418. doi:10.1021/acs.jpca.5b02253
Return to citation in text: [1] -
Li, M.; Liu, Y.; Duan, R.; Wei, X.; Yi, Y.; Wang, Y.; Chen, C.-F. Angew. Chem., Int. Ed. 2017, 56, 8818–8822. doi:10.1002/anie.201704435
Return to citation in text: [1] -
Samanta, P. K.; Kim, D.; Coropceanu, V.; Brédas, J.-L. J. Am. Chem. Soc. 2017, 139, 4042–4051. doi:10.1021/jacs.6b12124
Return to citation in text: [1] -
Kuila, S.; Ghorai, A.; Samanta, P. K.; Siram, R. B. K.; Pati, S. K.; Narayan, K. S.; George, S. J. Chem. – Eur. J. 2019, 25, 16007–16011. doi:10.1002/chem.201904651
Return to citation in text: [1] -
Hou, Y.; Liu, J.; Zhang, N.; Zhao, J. J. Phys. Chem. A 2020, 124, 9360–9374. doi:10.1021/acs.jpca.0c07907
Return to citation in text: [1] [2] -
Liu, D.; El‐Zohry, A. M.; Taddei, M.; Matt, C.; Bussotti, L.; Wang, Z.; Zhao, J.; Mohammed, O. F.; Di Donato, M.; Weber, S. Angew. Chem., Int. Ed. 2020, 59, 11591–11599. doi:10.1002/anie.202003560
Return to citation in text: [1] [2] -
Evans, E. W.; Olivier, Y.; Puttisong, Y.; Myers, W. K.; Hele, T. J. H.; Menke, S. M.; Thomas, T. H.; Credgington, D.; Beljonne, D.; Friend, R. H.; Greenham, N. C. J. Phys. Chem. Lett. 2018, 9, 4053–4058. doi:10.1021/acs.jpclett.8b01556
Return to citation in text: [1] [2] -
Gibson, J.; Monkman, A. P.; Penfold, T. J. ChemPhysChem 2016, 17, 2956–2961. doi:10.1002/cphc.201600662
Return to citation in text: [1] -
Etherington, M. K.; Gibson, J.; Higginbotham, H. F.; Penfold, T. J.; Monkman, A. P. Nat. Commun. 2016, 7, 13680. doi:10.1038/ncomms13680
Return to citation in text: [1] -
Chen, X.-K.; Zhang, S.-F.; Fan, J.-X.; Ren, A.-M. J. Phys. Chem. C 2015, 119, 9728–9733. doi:10.1021/acs.jpcc.5b00276
Return to citation in text: [1] -
Tang, G.; Sukhanov, A. A.; Zhao, J.; Yang, W.; Wang, Z.; Liu, Q.; Voronkova, V. K.; Di Donato, M.; Escudero, D.; Jacquemin, D. J. Phys. Chem. C 2019, 123, 30171–30186. doi:10.1021/acs.jpcc.9b09335
Return to citation in text: [1] [2] [3] [4] [5] [6] [7] [8] [9] [10] [11] [12] [13] [14] [15] -
Masimukku, N.; Gudeika, D.; Volyniuk, D.; Bezvikonnyi, O.; Simokaitiene, J.; Matulis, V.; Lyakhov, D.; Azovskyi, V.; Gražulevičius, J. V. Phys. Chem. Chem. Phys. 2022, 24, 5070–5082. doi:10.1039/d1cp05942d
Return to citation in text: [1] [2] [3] [4] [5] [6] -
Wang, B.; Zheng, Y.; Wang, T.; Ma, D.; Wang, Q. Org. Electron. 2021, 88, 106012. doi:10.1016/j.orgel.2020.106012
Return to citation in text: [1] -
van Willigen, H.; Jones, G.; Farahat, M. S. J. Phys. Chem. 1996, 100, 3312–3316. doi:10.1021/jp953176+
Return to citation in text: [1] -
Harriman, A.; Mallon, L. J.; Ulrich, G.; Ziessel, R. ChemPhysChem 2007, 8, 1207–1214. doi:10.1002/cphc.200700060
Return to citation in text: [1] -
Dance, Z. E. X.; Mickley, S. M.; Wilson, T. M.; Ricks, A. B.; Scott, A. M.; Ratner, M. A.; Wasielewski, M. R. J. Phys. Chem. A 2008, 112, 4194–4201. doi:10.1021/jp800561g
Return to citation in text: [1] -
Epelde-Elezcano, N.; Palao, E.; Manzano, H.; Prieto-Castañeda, A.; Agarrabeitia, A. R.; Tabero, A.; Villanueva, A.; de la Moya, S.; López-Arbeloa, Í.; Martínez-Martínez, V.; Ortiz, M. J. Chem. – Eur. J. 2017, 23, 4837–4848. doi:10.1002/chem.201605822
Return to citation in text: [1] -
Hou, Y.; Zhang, X.; Chen, K.; Liu, D.; Wang, Z.; Liu, Q.; Zhao, J.; Barbon, A. J. Mater. Chem. C 2019, 7, 12048–12074. doi:10.1039/c9tc04285g
Return to citation in text: [1] -
Filatov, M. A. Org. Biomol. Chem. 2020, 18, 10–27. doi:10.1039/c9ob02170a
Return to citation in text: [1] -
Gibbons, D. J.; Farawar, A.; Mazzella, P.; Leroy-Lhez, S.; Williams, R. M. Photochem. Photobiol. Sci. 2020, 19, 136–158. doi:10.1039/c9pp00399a
Return to citation in text: [1] -
Shao, S.; Gobeze, H. B.; Bandi, V.; Funk, C.; Heine, B.; Duffy, M. J.; Nesterov, V.; Karr, P. A.; D'Souza, F. ChemPhotoChem 2020, 4, 68–81. doi:10.1002/cptc.201900189
Return to citation in text: [1] -
Bassan, E.; Gualandi, A.; Cozzi, P. G.; Ceroni, P. Chem. Sci. 2021, 12, 6607–6628. doi:10.1039/d1sc00732g
Return to citation in text: [1] -
Zhang, X.; Wang, Z.; Hou, Y.; Yan, Y.; Zhao, J.; Dick, B. J. Mater. Chem. C 2021, 9, 11944–11973. doi:10.1039/d1tc02535j
Return to citation in text: [1] -
Chen, X.; Xiao, X.; Zhao, J. J. Mater. Chem. C 2022, 10, 4546–4557. doi:10.1039/d1tc04888k
Return to citation in text: [1] -
Ward, J. S.; Nobuyasu, R. S.; Batsanov, A. S.; Data, P.; Monkman, A. P.; Dias, F. B.; Bryce, M. R. Chem. Commun. 2016, 52, 2612–2615. doi:10.1039/c5cc09645f
Return to citation in text: [1] -
Peng, Q.; Fan, D.; Duan, R.; Yi, Y.; Niu, Y.; Wang, D.; Shuai, Z. J. Phys. Chem. C 2017, 121, 13448–13456. doi:10.1021/acs.jpcc.7b00692
Return to citation in text: [1] -
Hou, Y.; Kurganskii, I.; Elmali, A.; Zhang, H.; Gao, Y.; Lv, L.; Zhao, J.; Karatay, A.; Luo, L.; Fedin, M. J. Chem. Phys. 2020, 152, 114701. doi:10.1063/1.5145052
Return to citation in text: [1] -
Sasaki, S.; Hattori, K.; Igawa, K.; Konishi, G.-i. J. Phys. Chem. A 2015, 119, 4898–4906. doi:10.1021/acs.jpca.5b03238
Return to citation in text: [1] -
Wang, Z.; Zhao, J.; Di Donato, M.; Mazzone, G. Chem. Commun. 2019, 55, 1510–1513. doi:10.1039/c8cc08159j
Return to citation in text: [1] -
Chen, K.; Kurganskii, I. V.; Zhang, X.; Elmali, A.; Zhao, J.; Karatay, A.; Fedin, M. V. Chem. – Eur. J. 2021, 27, 7572–7587. doi:10.1002/chem.202100611
Return to citation in text: [1] -
Chen, K.; Taddei, M.; Bussotti, L.; Foggi, P.; Zhao, J.; Di Donato, M. ChemPhotoChem 2020, 4, 487–501. doi:10.1002/cptc.201900294
Return to citation in text: [1] -
Dong, Y.; Sukhanov, A. A.; Zhao, J.; Elmali, A.; Li, X.; Dick, B.; Karatay, A.; Voronkova, V. K. J. Phys. Chem. C 2019, 123, 22793–22811. doi:10.1021/acs.jpcc.9b06170
Return to citation in text: [1] -
Chen, K.; Zhao, J.; Li, X.; Gurzadyan, G. G. J. Phys. Chem. A 2019, 123, 2503–2516. doi:10.1021/acs.jpca.8b11828
Return to citation in text: [1] -
Imran, M.; Sukhanov, A. A.; Maity, P.; Elmali, A.; Zhao, J.; Karatay, A.; Mohammed, O. F.; Voronkova, V. K. J. Phys. Chem. B 2021, 125, 9244–9259. doi:10.1021/acs.jpcb.1c03537
Return to citation in text: [1] [2] -
Mi, Q.; Chernick, E. T.; McCamant, D. W.; Weiss, E. A.; Ratner, M. A.; Wasielewski, M. R. J. Phys. Chem. A 2006, 110, 7323–7333. doi:10.1021/jp061218w
Return to citation in text: [1] -
Collini, M. A.; Thomas, M. B.; Bandi, V.; Karr, P. A.; D'Souza, F. Chem. – Eur. J. 2017, 23, 4450–4461. doi:10.1002/chem.201700200
Return to citation in text: [1] -
Schuster, D. I.; Cheng, P.; Jarowski, P. D.; Guldi, D. M.; Luo, C.; Echegoyen, L.; Pyo, S.; Holzwarth, A. R.; Braslavsky, S. E.; Williams, R. M.; Klihm, G. J. Am. Chem. Soc. 2004, 126, 7257–7270. doi:10.1021/ja038676s
Return to citation in text: [1] -
Dance, Z. E. X.; Mi, Q.; McCamant, D. W.; Ahrens, M. J.; Ratner, M. A.; Wasielewski, M. R. J. Phys. Chem. B 2006, 110, 25163–25173. doi:10.1021/jp063690n
Return to citation in text: [1] -
Ventura, B.; Bertocco, A.; Braga, D.; Catalano, L.; d’Agostino, S.; Grepioni, F.; Taddei, P. J. Phys. Chem. C 2014, 118, 18646–18658. doi:10.1021/jp5049309
Return to citation in text: [1] [2] -
Suneesh, C. V.; Gopidas, K. R. J. Phys. Chem. C 2010, 114, 18725–18734. doi:10.1021/jp107606t
Return to citation in text: [1] -
Hviid, L.; Brouwer, A. M.; Paddon-Row, M. N.; Verhoeven, J. W. ChemPhysChem 2001, 2, 232–235. doi:10.1002/1439-7641(20010417)2:4<232::aid-cphc232>3.0.co;2-3
Return to citation in text: [1] -
Pearce, N.; Davies, E. S.; Horvath, R.; Pfeiffer, C. R.; Sun, X.-Z.; Lewis, W.; McMaster, J.; George, M. W.; Champness, N. R. Phys. Chem. Chem. Phys. 2018, 20, 752–764. doi:10.1039/c7cp06952a
Return to citation in text: [1] -
Ohkubo, K.; Kotani, H.; Shao, J.; Ou, Z.; Kadish, K. M.; Li, G.; Pandey, R. K.; Fujitsuka, M.; Ito, O.; Imahori, H.; Fukuzumi, S. Angew. Chem., Int. Ed. 2004, 43, 853–856. doi:10.1002/anie.200352870
Return to citation in text: [1] -
Geiß, B.; Lambert, C. Chem. Commun. 2009, 1670–1672. doi:10.1039/b820744e
Return to citation in text: [1] -
Hankache, J.; Wenger, O. S. Chem. Commun. 2011, 47, 10145–10147. doi:10.1039/c1cc13831f
Return to citation in text: [1] -
Blas-Ferrando, V. M.; Ortiz, J.; Ohkubo, K.; Fukuzumi, S.; Fernández-Lázaro, F.; Sastre-Santos, Á. Chem. Sci. 2014, 5, 4785–4793. doi:10.1039/c4sc01579g
Return to citation in text: [1] -
McGarrah, J. E.; Kim, Y.-J.; Hissler, M.; Eisenberg, R. Inorg. Chem. 2001, 40, 4510–4511. doi:10.1021/ic015559u
Return to citation in text: [1] -
Suzuki, S.; Sugimura, R.; Kozaki, M.; Keyaki, K.; Nozaki, K.; Ikeda, N.; Akiyama, K.; Okada, K. J. Am. Chem. Soc. 2009, 131, 10374–10375. doi:10.1021/ja904241r
Return to citation in text: [1] -
Saigo, M.; Miyata, K.; Tanaka, S.; Nakanotani, H.; Adachi, C.; Onda, K. J. Phys. Chem. Lett. 2019, 10, 2475–2480. doi:10.1021/acs.jpclett.9b00810
Return to citation in text: [1] -
Zhao, X.; Sukhanov, A. A.; Jiang, X.; Zhao, J.; Voronkova, V. K. J. Phys. Chem. Lett. 2022, 13, 2533–2539. doi:10.1021/acs.jpclett.2c00435
Return to citation in text: [1] [2] -
Yanai, T.; Tew, D. P.; Handy, N. C. Chem. Phys. Lett. 2004, 393, 51–57. doi:10.1016/j.cplett.2004.06.011
Return to citation in text: [1] -
Hirata, S.; Head-Gordon, M. Chem. Phys. Lett. 1999, 314, 291–299. doi:10.1016/s0009-2614(99)01149-5
Return to citation in text: [1] [2] [3] -
Miertuš, S.; Scrocco, E.; Tomasi, J. Chem. Phys. 1981, 55, 117–129. doi:10.1016/0301-0104(81)85090-2
Return to citation in text: [1] -
Miertus̃, S.; Tomasi, J. Chem. Phys. 1982, 65, 239–245. doi:10.1016/0301-0104(82)85072-6
Return to citation in text: [1] -
Pascual-ahuir, J. L.; Silla, E.; Tuñon, I. J. Comput. Chem. 1994, 15, 1127–1138. doi:10.1002/jcc.540151009
Return to citation in text: [1] -
Gaussian 16;; Gaussian, Inc.: Wallingford, CT, 2016.
Return to citation in text: [1] -
Wang, F.; Ziegler, T. J. Chem. Phys. 2005, 123, 154102. doi:10.1063/1.2061187
Return to citation in text: [1] [2] [3] -
Neese, F. Wiley Interdiscip. Rev.: Comput. Mol. Sci. 2012, 2, 73–78. doi:10.1002/wcms.81
Return to citation in text: [1] -
van Lenthe, E.; Baerends, E. J.; Snijders, J. G. J. Chem. Phys. 1993, 99, 4597–4610. doi:10.1063/1.466059
Return to citation in text: [1] -
Weigend, F.; Ahlrichs, R. Phys. Chem. Chem. Phys. 2005, 7, 3297–3305. doi:10.1039/b508541a
Return to citation in text: [1] -
Santoro, F.; Cerezo, J. FC classes3, a code for vibronic calculations; 2019.
Return to citation in text: [1] -
Avila Ferrer, F. J.; Santoro, F. Phys. Chem. Chem. Phys. 2012, 14, 13549–13563. doi:10.1039/c2cp41169e
Return to citation in text: [1]
| 48. | Ventura, B.; Bertocco, A.; Braga, D.; Catalano, L.; d’Agostino, S.; Grepioni, F.; Taddei, P. J. Phys. Chem. C 2014, 118, 18646–18658. doi:10.1021/jp5049309 |
| 20. | Tang, G.; Sukhanov, A. A.; Zhao, J.; Yang, W.; Wang, Z.; Liu, Q.; Voronkova, V. K.; Di Donato, M.; Escudero, D.; Jacquemin, D. J. Phys. Chem. C 2019, 123, 30171–30186. doi:10.1021/acs.jpcc.9b09335 |
| 20. | Tang, G.; Sukhanov, A. A.; Zhao, J.; Yang, W.; Wang, Z.; Liu, Q.; Voronkova, V. K.; Di Donato, M.; Escudero, D.; Jacquemin, D. J. Phys. Chem. C 2019, 123, 30171–30186. doi:10.1021/acs.jpcc.9b09335 |
| 20. | Tang, G.; Sukhanov, A. A.; Zhao, J.; Yang, W.; Wang, Z.; Liu, Q.; Voronkova, V. K.; Di Donato, M.; Escudero, D.; Jacquemin, D. J. Phys. Chem. C 2019, 123, 30171–30186. doi:10.1021/acs.jpcc.9b09335 |
| 58. | Saigo, M.; Miyata, K.; Tanaka, S.; Nakanotani, H.; Adachi, C.; Onda, K. J. Phys. Chem. Lett. 2019, 10, 2475–2480. doi:10.1021/acs.jpclett.9b00810 |
| 49. | Suneesh, C. V.; Gopidas, K. R. J. Phys. Chem. C 2010, 114, 18725–18734. doi:10.1021/jp107606t |
| 50. | Hviid, L.; Brouwer, A. M.; Paddon-Row, M. N.; Verhoeven, J. W. ChemPhysChem 2001, 2, 232–235. doi:10.1002/1439-7641(20010417)2:4<232::aid-cphc232>3.0.co;2-3 |
| 51. | Pearce, N.; Davies, E. S.; Horvath, R.; Pfeiffer, C. R.; Sun, X.-Z.; Lewis, W.; McMaster, J.; George, M. W.; Champness, N. R. Phys. Chem. Chem. Phys. 2018, 20, 752–764. doi:10.1039/c7cp06952a |
| 15. | Liu, D.; El‐Zohry, A. M.; Taddei, M.; Matt, C.; Bussotti, L.; Wang, Z.; Zhao, J.; Mohammed, O. F.; Di Donato, M.; Weber, S. Angew. Chem., Int. Ed. 2020, 59, 11591–11599. doi:10.1002/anie.202003560 |
| 52. | Ohkubo, K.; Kotani, H.; Shao, J.; Ou, Z.; Kadish, K. M.; Li, G.; Pandey, R. K.; Fujitsuka, M.; Ito, O.; Imahori, H.; Fukuzumi, S. Angew. Chem., Int. Ed. 2004, 43, 853–856. doi:10.1002/anie.200352870 |
| 53. | Geiß, B.; Lambert, C. Chem. Commun. 2009, 1670–1672. doi:10.1039/b820744e |
| 54. | Hankache, J.; Wenger, O. S. Chem. Commun. 2011, 47, 10145–10147. doi:10.1039/c1cc13831f |
| 55. | Blas-Ferrando, V. M.; Ortiz, J.; Ohkubo, K.; Fukuzumi, S.; Fernández-Lázaro, F.; Sastre-Santos, Á. Chem. Sci. 2014, 5, 4785–4793. doi:10.1039/c4sc01579g |
| 56. | McGarrah, J. E.; Kim, Y.-J.; Hissler, M.; Eisenberg, R. Inorg. Chem. 2001, 40, 4510–4511. doi:10.1021/ic015559u |
| 57. | Suzuki, S.; Sugimura, R.; Kozaki, M.; Keyaki, K.; Nozaki, K.; Ikeda, N.; Akiyama, K.; Okada, K. J. Am. Chem. Soc. 2009, 131, 10374–10375. doi:10.1021/ja904241r |
| 20. | Tang, G.; Sukhanov, A. A.; Zhao, J.; Yang, W.; Wang, Z.; Liu, Q.; Voronkova, V. K.; Di Donato, M.; Escudero, D.; Jacquemin, D. J. Phys. Chem. C 2019, 123, 30171–30186. doi:10.1021/acs.jpcc.9b09335 |
| 20. | Tang, G.; Sukhanov, A. A.; Zhao, J.; Yang, W.; Wang, Z.; Liu, Q.; Voronkova, V. K.; Di Donato, M.; Escudero, D.; Jacquemin, D. J. Phys. Chem. C 2019, 123, 30171–30186. doi:10.1021/acs.jpcc.9b09335 |
| 20. | Tang, G.; Sukhanov, A. A.; Zhao, J.; Yang, W.; Wang, Z.; Liu, Q.; Voronkova, V. K.; Di Donato, M.; Escudero, D.; Jacquemin, D. J. Phys. Chem. C 2019, 123, 30171–30186. doi:10.1021/acs.jpcc.9b09335 |
| 20. | Tang, G.; Sukhanov, A. A.; Zhao, J.; Yang, W.; Wang, Z.; Liu, Q.; Voronkova, V. K.; Di Donato, M.; Escudero, D.; Jacquemin, D. J. Phys. Chem. C 2019, 123, 30171–30186. doi:10.1021/acs.jpcc.9b09335 |
| 21. | Masimukku, N.; Gudeika, D.; Volyniuk, D.; Bezvikonnyi, O.; Simokaitiene, J.; Matulis, V.; Lyakhov, D.; Azovskyi, V.; Gražulevičius, J. V. Phys. Chem. Chem. Phys. 2022, 24, 5070–5082. doi:10.1039/d1cp05942d |
| 59. | Zhao, X.; Sukhanov, A. A.; Jiang, X.; Zhao, J.; Voronkova, V. K. J. Phys. Chem. Lett. 2022, 13, 2533–2539. doi:10.1021/acs.jpclett.2c00435 |
| 61. | Hirata, S.; Head-Gordon, M. Chem. Phys. Lett. 1999, 314, 291–299. doi:10.1016/s0009-2614(99)01149-5 |
| 66. | Wang, F.; Ziegler, T. J. Chem. Phys. 2005, 123, 154102. doi:10.1063/1.2061187 |
| 67. | Neese, F. Wiley Interdiscip. Rev.: Comput. Mol. Sci. 2012, 2, 73–78. doi:10.1002/wcms.81 |
| 61. | Hirata, S.; Head-Gordon, M. Chem. Phys. Lett. 1999, 314, 291–299. doi:10.1016/s0009-2614(99)01149-5 |
| 62. | Miertuš, S.; Scrocco, E.; Tomasi, J. Chem. Phys. 1981, 55, 117–129. doi:10.1016/0301-0104(81)85090-2 |
| 63. | Miertus̃, S.; Tomasi, J. Chem. Phys. 1982, 65, 239–245. doi:10.1016/0301-0104(82)85072-6 |
| 64. | Pascual-ahuir, J. L.; Silla, E.; Tuñon, I. J. Comput. Chem. 1994, 15, 1127–1138. doi:10.1002/jcc.540151009 |
| 21. | Masimukku, N.; Gudeika, D.; Volyniuk, D.; Bezvikonnyi, O.; Simokaitiene, J.; Matulis, V.; Lyakhov, D.; Azovskyi, V.; Gražulevičius, J. V. Phys. Chem. Chem. Phys. 2022, 24, 5070–5082. doi:10.1039/d1cp05942d |
| 60. | Yanai, T.; Tew, D. P.; Handy, N. C. Chem. Phys. Lett. 2004, 393, 51–57. doi:10.1016/j.cplett.2004.06.011 |
| 21. | Masimukku, N.; Gudeika, D.; Volyniuk, D.; Bezvikonnyi, O.; Simokaitiene, J.; Matulis, V.; Lyakhov, D.; Azovskyi, V.; Gražulevičius, J. V. Phys. Chem. Chem. Phys. 2022, 24, 5070–5082. doi:10.1039/d1cp05942d |
| 21. | Masimukku, N.; Gudeika, D.; Volyniuk, D.; Bezvikonnyi, O.; Simokaitiene, J.; Matulis, V.; Lyakhov, D.; Azovskyi, V.; Gražulevičius, J. V. Phys. Chem. Chem. Phys. 2022, 24, 5070–5082. doi:10.1039/d1cp05942d |
| 66. | Wang, F.; Ziegler, T. J. Chem. Phys. 2005, 123, 154102. doi:10.1063/1.2061187 |
| 68. | van Lenthe, E.; Baerends, E. J.; Snijders, J. G. J. Chem. Phys. 1993, 99, 4597–4610. doi:10.1063/1.466059 |
| 69. | Weigend, F.; Ahlrichs, R. Phys. Chem. Chem. Phys. 2005, 7, 3297–3305. doi:10.1039/b508541a |
| 66. | Wang, F.; Ziegler, T. J. Chem. Phys. 2005, 123, 154102. doi:10.1063/1.2061187 |
| 61. | Hirata, S.; Head-Gordon, M. Chem. Phys. Lett. 1999, 314, 291–299. doi:10.1016/s0009-2614(99)01149-5 |
| 1. | Cai, X.; Su, S.-J. Adv. Funct. Mater. 2018, 28, 1802558. doi:10.1002/adfm.201802558 |
| 2. | Cao, X.; Zhang, D.; Zhang, S.; Tao, Y.; Huang, W. J. Mater. Chem. C 2017, 5, 7699–7714. doi:10.1039/c7tc02481a |
| 3. | Im, Y.; Byun, S. Y.; Kim, J. H.; Lee, D. R.; Oh, C. S.; Yook, K. S.; Lee, J. Y. Adv. Funct. Mater. 2017, 27, 1603007. doi:10.1002/adfm.201603007 |
| 14. | Hou, Y.; Liu, J.; Zhang, N.; Zhao, J. J. Phys. Chem. A 2020, 124, 9360–9374. doi:10.1021/acs.jpca.0c07907 |
| 15. | Liu, D.; El‐Zohry, A. M.; Taddei, M.; Matt, C.; Bussotti, L.; Wang, Z.; Zhao, J.; Mohammed, O. F.; Di Donato, M.; Weber, S. Angew. Chem., Int. Ed. 2020, 59, 11591–11599. doi:10.1002/anie.202003560 |
| 20. | Tang, G.; Sukhanov, A. A.; Zhao, J.; Yang, W.; Wang, Z.; Liu, Q.; Voronkova, V. K.; Di Donato, M.; Escudero, D.; Jacquemin, D. J. Phys. Chem. C 2019, 123, 30171–30186. doi:10.1021/acs.jpcc.9b09335 |
| 1. | Cai, X.; Su, S.-J. Adv. Funct. Mater. 2018, 28, 1802558. doi:10.1002/adfm.201802558 |
| 2. | Cao, X.; Zhang, D.; Zhang, S.; Tao, Y.; Huang, W. J. Mater. Chem. C 2017, 5, 7699–7714. doi:10.1039/c7tc02481a |
| 3. | Im, Y.; Byun, S. Y.; Kim, J. H.; Lee, D. R.; Oh, C. S.; Yook, K. S.; Lee, J. Y. Adv. Funct. Mater. 2017, 27, 1603007. doi:10.1002/adfm.201603007 |
| 8. | Drummond, B. H.; Aizawa, N.; Zhang, Y.; Myers, W. K.; Xiong, Y.; Cooper, M. W.; Barlow, S.; Gu, Q.; Weiss, L. R.; Gillett, A. J.; Credgington, D.; Pu, Y.-J.; Marder, S. R.; Evans, E. W. Nat. Commun. 2021, 12, 4532. doi:10.1038/s41467-021-24612-9 |
| 9. | Penfold, T. J. J. Phys. Chem. C 2015, 119, 13535–13544. doi:10.1021/acs.jpcc.5b03530 |
| 10. | Ogiwara, T.; Wakikawa, Y.; Ikoma, T. J. Phys. Chem. A 2015, 119, 3415–3418. doi:10.1021/acs.jpca.5b02253 |
| 11. | Li, M.; Liu, Y.; Duan, R.; Wei, X.; Yi, Y.; Wang, Y.; Chen, C.-F. Angew. Chem., Int. Ed. 2017, 56, 8818–8822. doi:10.1002/anie.201704435 |
| 12. | Samanta, P. K.; Kim, D.; Coropceanu, V.; Brédas, J.-L. J. Am. Chem. Soc. 2017, 139, 4042–4051. doi:10.1021/jacs.6b12124 |
| 13. | Kuila, S.; Ghorai, A.; Samanta, P. K.; Siram, R. B. K.; Pati, S. K.; Narayan, K. S.; George, S. J. Chem. – Eur. J. 2019, 25, 16007–16011. doi:10.1002/chem.201904651 |
| 20. | Tang, G.; Sukhanov, A. A.; Zhao, J.; Yang, W.; Wang, Z.; Liu, Q.; Voronkova, V. K.; Di Donato, M.; Escudero, D.; Jacquemin, D. J. Phys. Chem. C 2019, 123, 30171–30186. doi:10.1021/acs.jpcc.9b09335 |
| 6. | Uoyama, H.; Goushi, K.; Shizu, K.; Nomura, H.; Adachi, C. Nature 2012, 492, 234–238. doi:10.1038/nature11687 |
| 7. | Tanaka, H.; Shizu, K.; Miyazaki, H.; Adachi, C. Chem. Commun. 2012, 48, 11392–11394. doi:10.1039/c2cc36237f |
| 8. | Drummond, B. H.; Aizawa, N.; Zhang, Y.; Myers, W. K.; Xiong, Y.; Cooper, M. W.; Barlow, S.; Gu, Q.; Weiss, L. R.; Gillett, A. J.; Credgington, D.; Pu, Y.-J.; Marder, S. R.; Evans, E. W. Nat. Commun. 2021, 12, 4532. doi:10.1038/s41467-021-24612-9 |
| 4. | Zhang, W.; Song, H.; Kong, J.; Kuang, Z.; Li, M.; Guo, Q.; Chen, C.-f.; Xia, A. J. Phys. Chem. C 2019, 123, 19322–19332. doi:10.1021/acs.jpcc.9b03867 |
| 5. | Fukuzumi, S. Pure Appl. Chem. 2007, 79, 981–991. doi:10.1351/pac200779060981 |
| 36. | Hou, Y.; Kurganskii, I.; Elmali, A.; Zhang, H.; Gao, Y.; Lv, L.; Zhao, J.; Karatay, A.; Luo, L.; Fedin, M. J. Chem. Phys. 2020, 152, 114701. doi:10.1063/1.5145052 |
| 32. | Zhang, X.; Wang, Z.; Hou, Y.; Yan, Y.; Zhao, J.; Dick, B. J. Mater. Chem. C 2021, 9, 11944–11973. doi:10.1039/d1tc02535j |
| 33. | Chen, X.; Xiao, X.; Zhao, J. J. Mater. Chem. C 2022, 10, 4546–4557. doi:10.1039/d1tc04888k |
| 16. | Evans, E. W.; Olivier, Y.; Puttisong, Y.; Myers, W. K.; Hele, T. J. H.; Menke, S. M.; Thomas, T. H.; Credgington, D.; Beljonne, D.; Friend, R. H.; Greenham, N. C. J. Phys. Chem. Lett. 2018, 9, 4053–4058. doi:10.1021/acs.jpclett.8b01556 |
| 23. | van Willigen, H.; Jones, G.; Farahat, M. S. J. Phys. Chem. 1996, 100, 3312–3316. doi:10.1021/jp953176+ |
| 24. | Harriman, A.; Mallon, L. J.; Ulrich, G.; Ziessel, R. ChemPhysChem 2007, 8, 1207–1214. doi:10.1002/cphc.200700060 |
| 25. | Dance, Z. E. X.; Mickley, S. M.; Wilson, T. M.; Ricks, A. B.; Scott, A. M.; Ratner, M. A.; Wasielewski, M. R. J. Phys. Chem. A 2008, 112, 4194–4201. doi:10.1021/jp800561g |
| 26. | Epelde-Elezcano, N.; Palao, E.; Manzano, H.; Prieto-Castañeda, A.; Agarrabeitia, A. R.; Tabero, A.; Villanueva, A.; de la Moya, S.; López-Arbeloa, Í.; Martínez-Martínez, V.; Ortiz, M. J. Chem. – Eur. J. 2017, 23, 4837–4848. doi:10.1002/chem.201605822 |
| 27. | Hou, Y.; Zhang, X.; Chen, K.; Liu, D.; Wang, Z.; Liu, Q.; Zhao, J.; Barbon, A. J. Mater. Chem. C 2019, 7, 12048–12074. doi:10.1039/c9tc04285g |
| 28. | Filatov, M. A. Org. Biomol. Chem. 2020, 18, 10–27. doi:10.1039/c9ob02170a |
| 29. | Gibbons, D. J.; Farawar, A.; Mazzella, P.; Leroy-Lhez, S.; Williams, R. M. Photochem. Photobiol. Sci. 2020, 19, 136–158. doi:10.1039/c9pp00399a |
| 30. | Shao, S.; Gobeze, H. B.; Bandi, V.; Funk, C.; Heine, B.; Duffy, M. J.; Nesterov, V.; Karr, P. A.; D'Souza, F. ChemPhotoChem 2020, 4, 68–81. doi:10.1002/cptc.201900189 |
| 31. | Bassan, E.; Gualandi, A.; Cozzi, P. G.; Ceroni, P. Chem. Sci. 2021, 12, 6607–6628. doi:10.1039/d1sc00732g |
| 20. | Tang, G.; Sukhanov, A. A.; Zhao, J.; Yang, W.; Wang, Z.; Liu, Q.; Voronkova, V. K.; Di Donato, M.; Escudero, D.; Jacquemin, D. J. Phys. Chem. C 2019, 123, 30171–30186. doi:10.1021/acs.jpcc.9b09335 |
| 20. | Tang, G.; Sukhanov, A. A.; Zhao, J.; Yang, W.; Wang, Z.; Liu, Q.; Voronkova, V. K.; Di Donato, M.; Escudero, D.; Jacquemin, D. J. Phys. Chem. C 2019, 123, 30171–30186. doi:10.1021/acs.jpcc.9b09335 |
| 21. | Masimukku, N.; Gudeika, D.; Volyniuk, D.; Bezvikonnyi, O.; Simokaitiene, J.; Matulis, V.; Lyakhov, D.; Azovskyi, V.; Gražulevičius, J. V. Phys. Chem. Chem. Phys. 2022, 24, 5070–5082. doi:10.1039/d1cp05942d |
| 22. | Wang, B.; Zheng, Y.; Wang, T.; Ma, D.; Wang, Q. Org. Electron. 2021, 88, 106012. doi:10.1016/j.orgel.2020.106012 |
| 70. | Santoro, F.; Cerezo, J. FC classes3, a code for vibronic calculations; 2019. |
| 71. | Avila Ferrer, F. J.; Santoro, F. Phys. Chem. Chem. Phys. 2012, 14, 13549–13563. doi:10.1039/c2cp41169e |
| 8. | Drummond, B. H.; Aizawa, N.; Zhang, Y.; Myers, W. K.; Xiong, Y.; Cooper, M. W.; Barlow, S.; Gu, Q.; Weiss, L. R.; Gillett, A. J.; Credgington, D.; Pu, Y.-J.; Marder, S. R.; Evans, E. W. Nat. Commun. 2021, 12, 4532. doi:10.1038/s41467-021-24612-9 |
| 16. | Evans, E. W.; Olivier, Y.; Puttisong, Y.; Myers, W. K.; Hele, T. J. H.; Menke, S. M.; Thomas, T. H.; Credgington, D.; Beljonne, D.; Friend, R. H.; Greenham, N. C. J. Phys. Chem. Lett. 2018, 9, 4053–4058. doi:10.1021/acs.jpclett.8b01556 |
| 17. | Gibson, J.; Monkman, A. P.; Penfold, T. J. ChemPhysChem 2016, 17, 2956–2961. doi:10.1002/cphc.201600662 |
| 18. | Etherington, M. K.; Gibson, J.; Higginbotham, H. F.; Penfold, T. J.; Monkman, A. P. Nat. Commun. 2016, 7, 13680. doi:10.1038/ncomms13680 |
| 19. | Chen, X.-K.; Zhang, S.-F.; Fan, J.-X.; Ren, A.-M. J. Phys. Chem. C 2015, 119, 9728–9733. doi:10.1021/acs.jpcc.5b00276 |
| 34. | Ward, J. S.; Nobuyasu, R. S.; Batsanov, A. S.; Data, P.; Monkman, A. P.; Dias, F. B.; Bryce, M. R. Chem. Commun. 2016, 52, 2612–2615. doi:10.1039/c5cc09645f |
| 35. | Peng, Q.; Fan, D.; Duan, R.; Yi, Y.; Niu, Y.; Wang, D.; Shuai, Z. J. Phys. Chem. C 2017, 121, 13448–13456. doi:10.1021/acs.jpcc.7b00692 |
| 42. | Chen, K.; Zhao, J.; Li, X.; Gurzadyan, G. G. J. Phys. Chem. A 2019, 123, 2503–2516. doi:10.1021/acs.jpca.8b11828 |
| 14. | Hou, Y.; Liu, J.; Zhang, N.; Zhao, J. J. Phys. Chem. A 2020, 124, 9360–9374. doi:10.1021/acs.jpca.0c07907 |
| 37. | Sasaki, S.; Hattori, K.; Igawa, K.; Konishi, G.-i. J. Phys. Chem. A 2015, 119, 4898–4906. doi:10.1021/acs.jpca.5b03238 |
| 38. | Wang, Z.; Zhao, J.; Di Donato, M.; Mazzone, G. Chem. Commun. 2019, 55, 1510–1513. doi:10.1039/c8cc08159j |
| 39. | Chen, K.; Kurganskii, I. V.; Zhang, X.; Elmali, A.; Zhao, J.; Karatay, A.; Fedin, M. V. Chem. – Eur. J. 2021, 27, 7572–7587. doi:10.1002/chem.202100611 |
| 40. | Chen, K.; Taddei, M.; Bussotti, L.; Foggi, P.; Zhao, J.; Di Donato, M. ChemPhotoChem 2020, 4, 487–501. doi:10.1002/cptc.201900294 |
| 41. | Dong, Y.; Sukhanov, A. A.; Zhao, J.; Elmali, A.; Li, X.; Dick, B.; Karatay, A.; Voronkova, V. K. J. Phys. Chem. C 2019, 123, 22793–22811. doi:10.1021/acs.jpcc.9b06170 |
| 20. | Tang, G.; Sukhanov, A. A.; Zhao, J.; Yang, W.; Wang, Z.; Liu, Q.; Voronkova, V. K.; Di Donato, M.; Escudero, D.; Jacquemin, D. J. Phys. Chem. C 2019, 123, 30171–30186. doi:10.1021/acs.jpcc.9b09335 |
| 20. | Tang, G.; Sukhanov, A. A.; Zhao, J.; Yang, W.; Wang, Z.; Liu, Q.; Voronkova, V. K.; Di Donato, M.; Escudero, D.; Jacquemin, D. J. Phys. Chem. C 2019, 123, 30171–30186. doi:10.1021/acs.jpcc.9b09335 |
| 48. | Ventura, B.; Bertocco, A.; Braga, D.; Catalano, L.; d’Agostino, S.; Grepioni, F.; Taddei, P. J. Phys. Chem. C 2014, 118, 18646–18658. doi:10.1021/jp5049309 |
| 20. | Tang, G.; Sukhanov, A. A.; Zhao, J.; Yang, W.; Wang, Z.; Liu, Q.; Voronkova, V. K.; Di Donato, M.; Escudero, D.; Jacquemin, D. J. Phys. Chem. C 2019, 123, 30171–30186. doi:10.1021/acs.jpcc.9b09335 |
| 47. | Dance, Z. E. X.; Mi, Q.; McCamant, D. W.; Ahrens, M. J.; Ratner, M. A.; Wasielewski, M. R. J. Phys. Chem. B 2006, 110, 25163–25173. doi:10.1021/jp063690n |
| 44. | Mi, Q.; Chernick, E. T.; McCamant, D. W.; Weiss, E. A.; Ratner, M. A.; Wasielewski, M. R. J. Phys. Chem. A 2006, 110, 7323–7333. doi:10.1021/jp061218w |
| 45. | Collini, M. A.; Thomas, M. B.; Bandi, V.; Karr, P. A.; D'Souza, F. Chem. – Eur. J. 2017, 23, 4450–4461. doi:10.1002/chem.201700200 |
| 46. | Schuster, D. I.; Cheng, P.; Jarowski, P. D.; Guldi, D. M.; Luo, C.; Echegoyen, L.; Pyo, S.; Holzwarth, A. R.; Braslavsky, S. E.; Williams, R. M.; Klihm, G. J. Am. Chem. Soc. 2004, 126, 7257–7270. doi:10.1021/ja038676s |
| 20. | Tang, G.; Sukhanov, A. A.; Zhao, J.; Yang, W.; Wang, Z.; Liu, Q.; Voronkova, V. K.; Di Donato, M.; Escudero, D.; Jacquemin, D. J. Phys. Chem. C 2019, 123, 30171–30186. doi:10.1021/acs.jpcc.9b09335 |
| 43. | Imran, M.; Sukhanov, A. A.; Maity, P.; Elmali, A.; Zhao, J.; Karatay, A.; Mohammed, O. F.; Voronkova, V. K. J. Phys. Chem. B 2021, 125, 9244–9259. doi:10.1021/acs.jpcb.1c03537 |
| 43. | Imran, M.; Sukhanov, A. A.; Maity, P.; Elmali, A.; Zhao, J.; Karatay, A.; Mohammed, O. F.; Voronkova, V. K. J. Phys. Chem. B 2021, 125, 9244–9259. doi:10.1021/acs.jpcb.1c03537 |
© 2022 Ye et al.; licensee Beilstein-Institut.
This is an open access article licensed under the terms of the Beilstein-Institut Open Access License Agreement (https://www.beilstein-journals.org/bjoc/terms), which is identical to the Creative Commons Attribution 4.0 International License (https://creativecommons.org/licenses/by/4.0). The reuse of material under this license requires that the author(s), source and license are credited. Third-party material in this article could be subject to other licenses (typically indicated in the credit line), and in this case, users are required to obtain permission from the license holder to reuse the material.