Search results
Search for "interaction force" in Full Text gives 68 result(s) in Beilstein Journal of Nanotechnology.
Imaging of viscoelastic soft matter with small indentation using higher eigenmodes in single-eigenmode amplitude-modulation atomic force microscopy
Beilstein J. Nanotechnol. 2018, 9, 1116–1122, doi:10.3762/bjnano.9.103

- model with the parameters of Table 1. The results show: (a) the peak tip–sample interaction force, and (b) the maximum indentation depth, with respect to amplitude setpoint ratio for AM-AFM using the first eigenmode (red line), AM-AFM using the second eigenmode (blue line), and bimodal AFM using the


Combined pulsed laser deposition and non-contact atomic force microscopy system for studies of insulator metal oxide thin films
Beilstein J. Nanotechnol. 2018, 9, 686–692, doi:10.3762/bjnano.9.63

- ][35][36][37][38][39][40][41][42][43][44][45][46][47] have played important roles. NC-AFM in particular can be used to elucidate the structures of surfaces at the atomic scale. An NC-AFM measures the shift in cantilever resonance due to the interaction force between the tip and the sample, hence it is


Tuning adhesion forces between functionalized gold colloidal nanoparticles and silicon AFM tips: role of ligands and capillary forces
Beilstein J. Nanotechnol. 2018, 9, 660–670, doi:10.3762/bjnano.9.61

- was chosen, to estimate the order of magnitude of vdW interaction force and its contribution to overall adhesion forces. VdW interaction forces for thiol molecules and silicon in contact was calculated according to Equation 3 [40]: where µ1 = 7.2 × 10⁻³¹ C·m and µ2 = 1.0 × 10⁻²⁹ C·m are the dipole


Material property analytical relations for the case of an AFM probe tapping a viscoelastic surface containing multiple characteristic times
Beilstein J. Nanotechnol. 2017, 8, 2230–2244, doi:10.3762/bjnano.8.223

- parameters) and Zeq. Fortunately, San Paulo and García [18] have shown that, besides energy dissipation, it is possible to obtain another meaningful energy quantity defined as the convolution of the tip–sample interaction force with the tip deflection [44], as described in Equation 9. This is the virial that
- method [39]. Here the total attractive van der Waals potential (EvdW) was calculated for the specific case of a flat-end cylindrical punch interacting with a flat semi-infinite half-space, and subsequently the interaction force was obtained through differentiation: For the adhesion portion during


High-speed dynamic-mode atomic force microscopy imaging of polymers: an adaptive multiloop-mode approach
Beilstein J. Nanotechnol. 2017, 8, 1563–1570, doi:10.3762/bjnano.8.158

- quality of the 25 Hz and 20 Hz AMLM imaging is at the same level of that of the 1 Hz TM imaging, while the tip–sample interaction force is substantially smaller than that of the 2 Hz TM imaging. Keywords: adaptive multiloop mode; atomic force microscopy (AFM); heterogeneous polymer sample; tapping-mode
- cost of a substantially (over five times) increased imaging force. By using the AMLM imaging mode, it is aimed to achieve high-speed dynamic-mode AFM imaging while maintaining the tip–sample interaction force similar as that in low-speed TM imaging. The speed increase of TM imaging is limited by the
- damage due to the lack of control of the tip–sample interaction force [7][8][16]. Therefore, current efforts to high-speed dynamic-mode AFM imaging only led to rather limited success. The presented AMLM imaging approach can achieve high-speed TM imaging for both large- and small-size imaging while


A review of demodulation techniques for amplitude-modulation atomic force microscopy
Beilstein J. Nanotechnol. 2017, 8, 1407–1426, doi:10.3762/bjnano.8.142

- the late 1980s had little to do with modulation to begin with, a fundamental prerequisite was given by the nonlinear tip–sample interaction force. With the advent of dynamic imaging modes [9], in which the microcantilever is excited at one of its resonance frequencies, the foundation for transmitting


Scaling law to determine peak forces in tapping-mode AFM experiments on finite elastic soft matter systems
Beilstein J. Nanotechnol. 2017, 8, 968–974, doi:10.3762/bjnano.8.98

- interaction forces of a measurement [9][18][19][20][21][22][23][24][25][26]. One of the latter methods is the estimation of the peak interaction forces [21][22][23][25][26][27][28][29]. The peak interaction force determines the deformation on the sample and hence the spatial resolution and the degree of
- ][12][14][30][31]. Moreover, we provide the explicit method to obtain an analytical equation based on the relevant dynamic AFM operational parameters. Here, a parametrical equation to determine the peak interaction force exerted by the AM-AFM on a finite soft material immersed in a liquid environment
- a parametrical equation of the peak interaction forces according to a bidimensional elastic contact mechanics model, namely Tatara’s one (see Equation 2). The main method's assumption is that the peak interaction force can be expressed as a sixth-order multivariate cascade function [40][41] of the


Measuring adhesion on rough surfaces using atomic force microscopy with a liquid probe
Beilstein J. Nanotechnol. 2017, 8, 813–825, doi:10.3762/bjnano.8.84

- interaction force between the macroscopic drop and the surface that corresponds to the interaction with a single peak or protrusion. This unit of force is of the order of a few piconewtons for the case of the solid sphere and peaks of nanometer radius. These values are of the same order of magnitude as the


Noise in NC-AFM measurements with significant tip–sample interaction
Beilstein J. Nanotechnol. 2016, 7, 1885–1904, doi:10.3762/bjnano.7.181
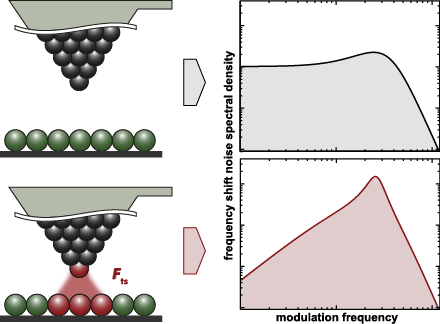
- centre position of the cantilever oscillation (see Figure 3). We explicitly include the amplitude dependency on the frequency shift Δf by including the oscillation amplitude component Az perpendicular to the sample surface. This dependency follows from the convolution of the interaction force with the
- second term becomes negligible for large oscillation amplitudes Az. We illustrate the latter point by using an analytic expression for a Morse interaction force for which the resulting frequency shift ΔfM can be calculated as [31] where In(z) is the modified Bessel function of the first kind. Using this


![[Graphic 32]](/bjnano/content/inline/2190-4286-7-181-i73.png?max-width=637&scale=1.18182) wit...
wit...

![[Graphic 34]](/bjnano/content/inline/2190-4286-7-181-i75.png?max-width=637&scale=1.18182) wit...
wit...


Nanoscale effects in the characterization of viscoelastic materials with atomic force microscopy: coupling of a quasi-three-dimensional standard linear solid model with in-plane surface interactions
Beilstein J. Nanotechnol. 2016, 7, 554–571, doi:10.3762/bjnano.7.49

- indentation profiles and tip–sample interaction force curves, as well as their implications with regards to experimental interpretation. A variety of phenomena are examined in detail, which highlight the need for further development of more physically accurate sample models that are specifically designed for
- the AFM tip is very small, so the tip–sample interaction force curve at the desired force setpoint can be considered to be a straight line for the range of tip positions explored. Similar approaches have been used in force modulation techniques (FMOD-AFM), where the sample is dynamically probed at
- context of AFM imaging simulation, especially as experimental results become available. General features of the tip–sample interaction force curve It is shown in [22] that the previously introduced Q3D model qualitatively reproduces the correct repulsive region curvature and other features of the tip


Large area scanning probe microscope in ultra-high vacuum demonstrated for electrostatic force measurements on high-voltage devices
Beilstein J. Nanotechnol. 2015, 6, 2485–2497, doi:10.3762/bjnano.6.258

- certain surface area. The tip height is controlled by a feedback loop correlating the tip–sample interaction with the deflection of the cantilever. However, the interaction force contains many different components which can only be partly suppressed (e.g., magnetic forces when inspecting non-magnetic


A simple and efficient quasi 3-dimensional viscoelastic model and software for simulation of tapping-mode atomic force microscopy
Beilstein J. Nanotechnol. 2015, 6, 2233–2241, doi:10.3762/bjnano.6.229

- speed, and then retracted at the same speed. Generally the desired information is the tip–sample interaction force curve, which for an elastic body is an analytical expression describing the force sensed by the AFM tip as a function of its vertical position above the sample. From this curve the user can
- that a useful avenue of research may be the study of tip–sample force ‘signatures’ for different viscoelastic models, as proposed through simulations in [17], where the tip–sample interaction force curve is acquired using spectral inversion methods [18][19] and the force is plotted not only in terms of
- for the simulation of AFM imaging of viscoelatic surfaces. An efficient and easily modifiable software tool for the construction of amplitude and phase spectroscopy curves has also been provided as Supporting Information. The model correctly reproduces the key features of tip–sample interaction force


Kelvin probe force microscopy for local characterisation of active nanoelectronic devices
Beilstein J. Nanotechnol. 2015, 6, 2193–2206, doi:10.3762/bjnano.6.225

- weighting factors C' and C'' for AM and FM, respectively. To this end, we applied an analytic model of the electrostatic tip–sample interaction force [18] to the approximate geometry of a typically used cantilever (Olympus AC160), and we calculated C' and C'' as a function of tip–sample separation for
- perturbed by the tip–sample interaction force , where z(t) is the cantilever deflection, ω0 the eigenfrequency, k the spring constant, and Q the quality factor of the cantilever. For an oscillation with amplitude A and drive frequency ωd ≈ ω0, the interaction force can be approximated to where z0 is the


![[Graphic 33]](/bjnano/content/inline/2190-4286-6-225-i48.png?max-width=637&scale=1.18182) for different modulation amplitu...
for different modulation amplitu...


A simple method for the determination of qPlus sensor spring constants
Beilstein J. Nanotechnol. 2015, 6, 1733–1742, doi:10.3762/bjnano.6.177

- possible for qPlus sensors [10], and other sensors with cantilevered geometries [11], to reach quality factors in excess of 106 without inertial cancelling. Several methods have been developed to reconstruct the tip–sample interaction force from the frequency shift of an oscillating tip in ncAFM [12][13
- , we develop a rigorous mathematical model for the qPlus sensor with a finite tip. The effect of the parasitic tip motion on the reconstructed interaction force is examined quantitatively from the perspective of two-dimensional grid spectroscopy. In addition, we use a traceable nanoindenter to
- be reconstructed for the two-dimensional grid Ω(x,z). Figure 5 shows two-dimensional grid spectroscopy images reconstructed from the Sader–Jarvis formula. For zero tip height, the image faithfully reconstructs the interaction force. However, for non-zero tip heights, the parasitic tip motion


![[Graphic 9]](/bjnano/content/inline/2190-4286-6-177-i28.png?max-width=637&scale=1.18182) vs b is plotted where kI is the spring constan...
vs b is plotted where kI is the spring constan...
Probing fibronectin–antibody interactions using AFM force spectroscopy and lateral force microscopy
Beilstein J. Nanotechnol. 2015, 6, 1164–1175, doi:10.3762/bjnano.6.118

- the unbinding force between fibronectin and monoclonal antibody were carried out. We assume that independent of the applied unbinding direction (i.e., normal or lateral), both methods (AFM-FS and LFM) provide similar values of the interaction force at similar loading rates. In the AFM-FS method, force


Capillary and van der Waals interactions on CaF2 crystals from amplitude modulation AFM force reconstruction profiles under ambient conditions
Beilstein J. Nanotechnol. 2015, 6, 809–819, doi:10.3762/bjnano.6.84

- large tip–sample distances [12][13] and can exhibit unexpected distance dependencies [14]. Contact AFM measurements, in which the force is determined from the static deflection of the cantilever during approach [15], can readily record the tip–sample interaction force and have been used extensively to


Influence of spurious resonances on the interaction force in dynamic AFM
Beilstein J. Nanotechnol. 2015, 6, 420–427, doi:10.3762/bjnano.6.42

- the whole system has a specific transfer function, and assuming only that all the forces involved are additive. However, one should note that if we talk of the interaction stiffness, ki, this contains the implicit assumption that the interaction force, Fi, in the vicinity of the tip oscillation can be
- Brownian motion shown in Figure 4a. The resulting r* and are listed in Table 1 together with r and values obtained from the analysis of the Brownian motion. This result shows that the change in amplitude and phase due to the interaction force were about the same, regardless of the presence of spurious
- the measurement of its transfer function, but it is based on the acquisition of the tip position/deflection, amplitude and phase during approach curves and consequently the assumption of the equality F = −∫kidz. The method has been employed to compare the interaction force at the mica/deionized water


Dynamic force microscopy simulator (dForce): A tool for planning and understanding tapping and bimodal AFM experiments
Beilstein J. Nanotechnol. 2015, 6, 369–379, doi:10.3762/bjnano.6.36

- mass of the cantilever tip, ω0 is the angular resonant frequency, Q the quality factor, k the spring constant of the fundamental resonance (first flexural mode) and Fts is the tip–sample interaction force. The above equation is applicable when the contributions from higher modes to the cantilever
- of the cantilever. For bimodal AM we have considered a system of equations involving the first three flexural modes [39][45]. Each mode was described by a point-mass model. In this system the modes are coupled by the tip–sample interaction force. The equations of motion were integrated numerically
- simulate the full cantilever dynamics in both amplitude modulation and bimodal AM force microscopies. The code is both robust and numerically accurate. It incorporates the most relevant interaction force models that apply for dynamic AFM experiments in air and liquid. The simulator has been tested over the


Accurate, explicit formulae for higher harmonic force spectroscopy by frequency modulation-AFM
Beilstein J. Nanotechnol. 2015, 6, 149–156, doi:10.3762/bjnano.6.14

- , existing approximations of the interaction force in terms of higher harmonic amplitudes generally require simultaneous measurements of multiple harmonics to achieve satisfactory accuracy. In the present letter we address the mathematical challenge and derive accurate, explicit formulae for both
- amplitude and z is the distance of closest approach to the surface in the oscillation cycle. Various techniques have been proposed to invert the convolution in Equation 2 and extract the interaction force from the measured shift in frequency. At first, these were either numerical solutions or analytic
- ], but these do not completely alleviate the problem. Here, we show that a full force curve can be extracted from the amplitude of any single higher harmonic. We provide simple, explicit expressions for the interaction force in terms of higher harmonic amplitudes, allowing the benefits of high-harmonics


Modeling viscoelasticity through spring–dashpot models in intermittent-contact atomic force microscopy
Beilstein J. Nanotechnol. 2014, 5, 2149–2163, doi:10.3762/bjnano.5.224

- dissipative force term (FtsDISS) to the conservative force term(s) (FtsCON), such that the total tip–sample force can be expressed as Fts = FtsCON + FtsDISS. Usually the repulsive conservative portion of the tip–sample interaction force is defined through the Derjaguin–Muller–Toporov (DMT) model or a similar


Dissipation signals due to lateral tip oscillations in FM-AFM
Beilstein J. Nanotechnol. 2014, 5, 2048–2057, doi:10.3762/bjnano.5.213

- number of tip configurations [14][41] are known to occur. Here, we want to study the possibility of an additional dissipation mechanism caused by the excitation of lateral oscillations. Therefore, we calculate the tip–substrate interaction force only for the approach of the tip, and assume the same force
- positions of the lowest atomic layer of the substrate and the uppermost atom of the tip cube. The other atomic positions are relaxed by using open boundary conditions and the conjugate gradient method. The interaction force between tip and substrate is evaluated for a fine grid of tip positions by repeating


Probing viscoelastic surfaces with bimodal tapping-mode atomic force microscopy: Underlying physics and observables for a standard linear solid model
Beilstein J. Nanotechnol. 2014, 5, 1649–1663, doi:10.3762/bjnano.5.176

- , constant-excitation FM-AFM and constant-amplitude FM-AFM [27]. Even more recently Herruzo et al. [9] succeeded for the first time in inverting the conservative tip–sample interaction force curve along with a depth-dependent, direction-independent tip–sample dissipation coefficient by using bimodal FM-AFM
- acquisition of such signatures of the tip–sample interaction force can in turn spur the development of inversion methodologies for different types of models. An example of this type of inversion for an SLS surface is offered in reference [40]. This study demonstrates mathematically that such an inversion is


Trade-offs in sensitivity and sampling depth in bimodal atomic force microscopy and comparison to the trimodal case
Beilstein J. Nanotechnol. 2014, 5, 1144–1151, doi:10.3762/bjnano.5.125

- , where zeq is the position of the cantilever above the sample), t = ωot is the dimensionless time, k is the cantilever force constant and Fts is the tip–sample interaction force. We have made the substitution A ≈ Ao = FoQ/k [14], where Fo is the amplitude of the excitation force, and we have combined the


Fibrillar adhesion with no clusterisation: Functional significance of material gradient along adhesive setae of insects
Beilstein J. Nanotechnol. 2014, 5, 837–845, doi:10.3762/bjnano.5.95

- , interact with corresponding regions of other fibers of the array. Since for the majority of studied biological fibrillar adhesive systems, there is no evidence that seta–substrate and seta–seta interactions are different, we assumed that interaction force has the same (van der Waals) origin as their


Uncertainties in forces extracted from non-contact atomic force microscopy measurements by fitting of long-range background forces
Beilstein J. Nanotechnol. 2014, 5, 386–393, doi:10.3762/bjnano.5.45

- custom-built atom tracking system developed at the University of Mainz [18] was used to apply feedforward correction to reduce the effect of thermal drift and piezo-electric creep. To obtain the site-specific interaction force, single point Δf(z) spectroscopy measurements were acquired on the adatoms


