

Search results
Search for "measurement" in Full Text gives 1240 result(s) in Beilstein Journal of Nanotechnology. Showing first 200.
Enhancing higher-order modal response in multifrequency atomic force microscopy with a coupled cantilever system
Beilstein J. Nanotechnol. 2024, 15, 694–703, doi:10.3762/bjnano.15.57

- frequencies compared to the simulation results, but the modal ratios are approximate. The reasons may be related to the following two aspects: (i) The actual parameters of the cantilever material are different from the simulation parameters. (ii) There is an error in the manual measurement regarding the
- values of the applied voltages during the measurement of the frequency modal response were all 3 V. The first two orders of the modal responses of the traditional cantilever beam and the coupled system are depicted by blue and red curves, respectively, in Figure 10. We obtained second-order modal


Gold nanomakura: nanoarchitectonics and their photothermal response in association with carrageenan hydrogels
Beilstein J. Nanotechnol. 2024, 15, 678–693, doi:10.3762/bjnano.15.56

- microscopy (AFM) micrographs of CTAB-AuNM, MTAB-AuNM, and DTAB-AuNM, respectively. A total number of 50 nanoparticles were considered for the aspect ratio measurement as shown in Table 2. The analysis was performed using the ImageJ software (NIH, USA). Figure 4d–f shows AFM images of the AuNMs along with
- of 1 mL of each sample after one wash was taken into consideration for the measurement. The absorbance range was set to 300–900 nm during all measurements. The zeta potential measurement was performed using a Zetasizer (Nano ZS, Malvern UK). The sample was transferred into a DTS1070 cuvette and the
- instrument was run for the zeta potential measurement. The actual size, morphology, and aspect ratio calculation of the synthesized nanoparticles were observed under a transmission electron microscope (120 kV, Tecnai, FEI, The Netherlands) at multiple regions. An atomic force microscope (Witec Alpha 300RA






AFM-IR investigation of thin PECVD SiOx films on a polypropylene substrate in the surface-sensitive mode
Beilstein J. Nanotechnol. 2024, 15, 603–611, doi:10.3762/bjnano.15.51
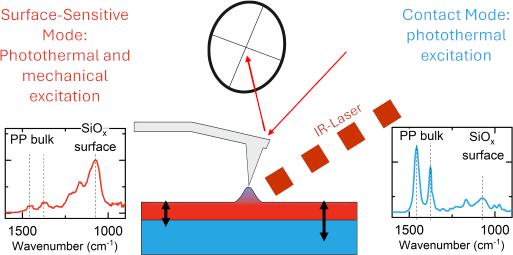
- the different measurement methods (i.e., contact mode and surface-sensitive mode) with respect to the chemical surface sensitivity. The use of the surface-sensitive mode in AFM-IR shows an enormous improvement for the analysis of thin films on the IR-active substrate. As a result, in this mode, the
- papers [1][3][9][10]. A general restriction of AFM-IR is its rather large depth of information, which depends on the sample structure and the chosen measurement mode such as contact mode or tapping mode. In general, the incident IR light excites a large volume of material beneath the AFM tip, and the tip
- compensation of the isolating polymer foils, the measurement was carried out in a 1.5 mbar N2 atmosphere. The survey spectra were recorded with a pass energy of 100 eV, while the core level spectra were taken with a 40 eV pass energy. The analysis was done using the software Unifit 2019 [17]. For all core


Stiffness calibration of qPlus sensors at low temperature through thermal noise measurements
Beilstein J. Nanotechnol. 2024, 15, 580–602, doi:10.3762/bjnano.15.50
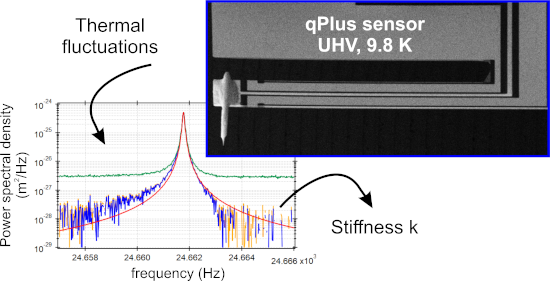
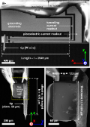
- calibration of the probe in a LT UHV system. The goal of the present work is to propose a framework based on thermal noise measurement to calibrate the stiffness of qPlus sensors operated in a LT UHV system. The concept was introduced by Hutter and Bechhoefer, and Butt et al. in 1993 [33][34], and was further
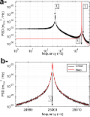
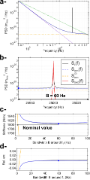
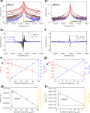
- improved by Butt and Jaschke in 1995 [35]. It is based on the measurement of the spectrum of the fluctuations of the free end of the probe excited by thermal noise. The peak of the thermal noise spectrum at the resonance frequency of the probe may be related to its stiffness if the mechanical behavior of
- strategy, which allows us to achieve an uncertainty of 10% maximum in the calibration. This work is inspired by, and based on, results from the literature, but extends the scope of AFM probes stiffness calibration through thermal noise measurement to very stiff (k > 1000 N/m) and large-Q (Q > 105) probes

On the additive artificial intelligence-based discovery of nanoparticle neurodegenerative disease drug delivery systems
Beilstein J. Nanotechnol. 2024, 15, 535–555, doi:10.3762/bjnano.15.47
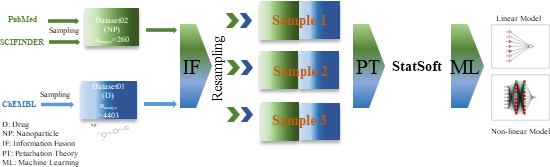
- , the cell line, cn2, the NP shape, cn3, the measurement conditions, and cn4, the coating agent. Each of these assays involved at last one out of n(cn0) = 5 possible biological activity parameters (CC50, EC50, IC50, LC50, and TC50). They also include n(cn1) = 53 cell lines (e.g., A549 (H), RAW 264.7
- , and Neuro-2A (M)) and n(cn2) = 10 NP shapes (spherical, irregular, slice-shaped, needles, rods, elliptical, pseudo-spherical, polyhedral, pyramidal, and strips). In addition, they contain n(cn3) = 8 NP measurement conditions (dry, H2O, DMEM, RPMI, 1% Trion X-100/H2O, H2O/TMAOH, egg/H2O, and H2O/HMT
- is determined by the i-th NDD compound and the n-th NP measurement conditions. The remaining cases, f(vij(cd0), vnj(cn0))obs = 0, indicate that at least one of the abovementioned conditions fail. Definition of objective and reference functions IF phase for combining the references After we obtained



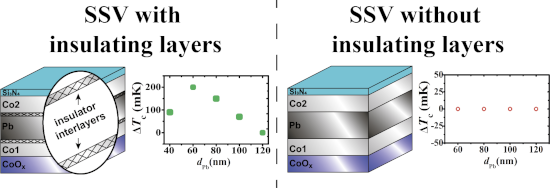
Superconducting spin valve effect in Co/Pb/Co heterostructures with insulating interlayers
Beilstein J. Nanotechnol. 2024, 15, 457–464, doi:10.3762/bjnano.15.41
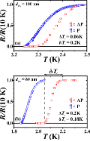
- was measured by a Hall probe with an accuracy of ±0.3 Oe. The sample temperature was monitored using an Allen-Bradley thermometer that is highly sensitive in the temperature range of interest. The temperature measurement error was ±(5–6) mK below 3 K. The superconducting critical temperature Tc was



![[Graphic 6]](/bjnano/content/inline/2190-4286-15-41-i6.svg?max-width=637&scale=1.18182)
Potential of a deep eutectic solvent in silver nanoparticle fabrication for antibiotic residue detection
Beilstein J. Nanotechnol. 2024, 15, 426–434, doi:10.3762/bjnano.15.38
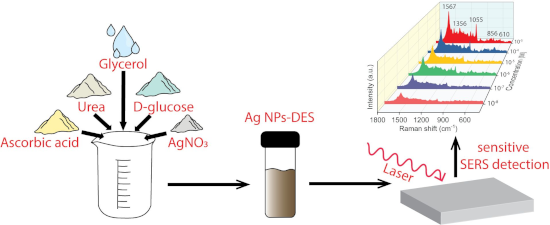
- each measurement). The analyte was then dried at room temperature, and the Raman spectra were recorded via laser excitation at 532 nm. Other investigations on the SERS performance of our sample were also carried out, including Raman mapping, signal consistency, uniformity, and selectivity. Instrument


Unveiling the nature of atomic defects in graphene on a metal surface
Beilstein J. Nanotechnol. 2024, 15, 416–425, doi:10.3762/bjnano.15.37
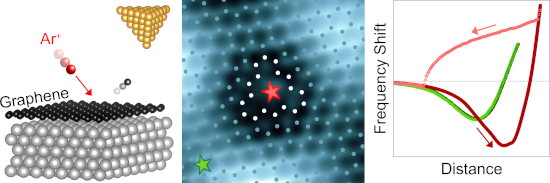
- intact graphene sheet. Spatially resolved spectroscopy of the differential conductance and the measurement of total-force variations as a function of the lateral and vertical probe–defect distance corroborate the different character of the defects. The tendency of the vacancy defect to form a chemical


Insect attachment on waxy plant surfaces: the effect of pad contamination by different waxes
Beilstein J. Nanotechnol. 2024, 15, 385–395, doi:10.3762/bjnano.15.35
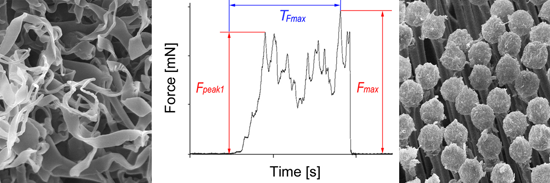
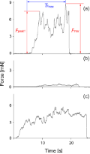
- substrate pulling the hair for ca. 30 s, while the friction (traction) force thus produced by the moving insect was registered. Since the insects walked parallel to the measurement axis of the sensor, the recorded force corresponded to the total traction force. Force–time curves obtained were used to




On the mechanism of piezoresistance in nanocrystalline graphite
Beilstein J. Nanotechnol. 2024, 15, 376–384, doi:10.3762/bjnano.15.34
- microstructure of the film [37]. After the plateau (strain > 1.6%), the resistance once again increases, and a new set of nanocracks start to form at different GBs. The second cycle of the resistance vs strain measurement (Figure 2a, red curve) starts from a resistance value that is equivalent to the resistance
- substrate at 4000 rpm to grow NCG on both sides of the glass. The substrate was then loaded into the vacuum furnace and treated similarly. Raman measurements Raman measurements were done using a 100× objective at 0.6 mW laser power for 60 s integration time for each measurement. The same area on the NCG
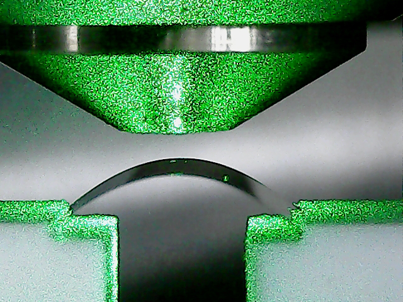
- film was focused as to monitor and compare any changes occurring during straining the film. (a) Two-point bending fixture showing two instances of a substrate during measurement. (b) Patterned NCG structure for piezoresistance measurements. The red square marks the active device area. White lines are


Modulated critical currents of spin-transfer torque-induced resistance changes in NiCu/Cu multilayered nanowires
Beilstein J. Nanotechnol. 2024, 15, 360–366, doi:10.3762/bjnano.15.32
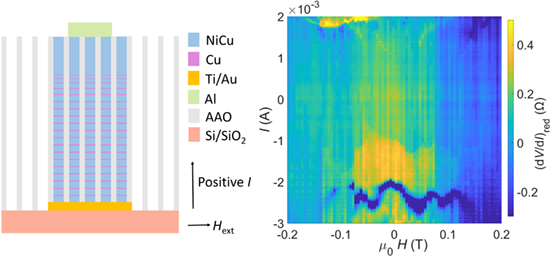
- mV) added to a DC bias voltage at a frequency of 4531 Hz. A four-point measurement was used to exclude the effects of the cabling. A positive current is defined such that the electrons flow from the top electrode to the bottom electrode. A magnetic field was applied perpendicular to the nanowires


Controllable physicochemical properties of WOx thin films grown under glancing angle
Beilstein J. Nanotechnol. 2024, 15, 350–359, doi:10.3762/bjnano.15.31
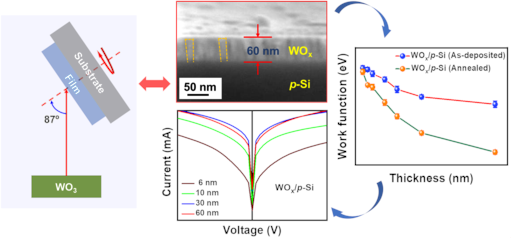
- after annealing as a function of the WOx thickness. A schematic of the measurement configuration is presented in the inset of Figure 6a. An increase in current is apparent as the thickness increases (up to 30 nm). For instance, the current at +1 V increases from 0.1 to 1 mA as the thickness increases
- 6 to 10 nm for both the as-deposited and annealed films (Figure 6a). It may arise from Fermi level de-pinning at the NS-WOx/p-Si heterojunction when the film thickness increases to 10 nm. To understand this behaviour, in the I–V-measurement configuration (Figure 6a, inset), the WOx film can be


Comparative electron microscopy particle sizing of TiO2 pigments: sample preparation and measurement
Beilstein J. Nanotechnol. 2024, 15, 317–332, doi:10.3762/bjnano.15.29
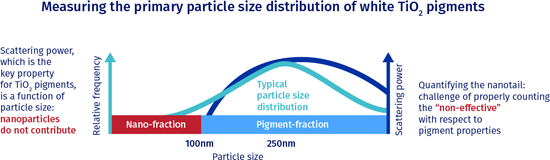
- 100 nm boundary of the EU nanomaterial definition, but the TiO2 pigment manufacturing processes results in a finite nanoscale content fraction. This optically inefficient nanoscale fraction needs to be quantified in line with EU regulations. In this paper, we describe the measurement procedures used
- pigments and other particulate materials and advance the development of widely acceptable, precise, and reproducible measurement protocols for measuring the number-based PSDs of particulate products in the size range of TiO2 pigments. Keywords: electron microscopy; nanomaterials definition; number-based
- ; particle sizing; primary particles; Introduction Following the EU definition of nanomaterials as being materials in which more than 50% by number of their primary particles have at least one dimension smaller than 100 nm [1][2], the accurate measurement of particle size distributions (PSDs) has become


Exploring the relationships between physiochemical properties of nanoparticles and cell damage to combat cancer growth using simple periodic table-based descriptors
Beilstein J. Nanotechnol. 2024, 15, 297–309, doi:10.3762/bjnano.15.27
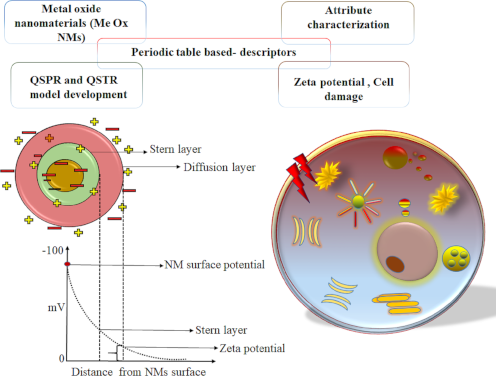
- was obtained from Cao et al. [26], where the zeta potential of MeOx NPs was measured in a cell culture of 20% fetal bovine complete medium. Dataset II was taken from Toropova et al. [27], where cell damage measurement was performed based on the uptake of propidium iodide (PI). The dataset is related


Determining by Raman spectroscopy the average thickness and N-layer-specific surface coverages of MoS2 thin films with domains much smaller than the laser spot size
Beilstein J. Nanotechnol. 2024, 15, 279–296, doi:10.3762/bjnano.15.26
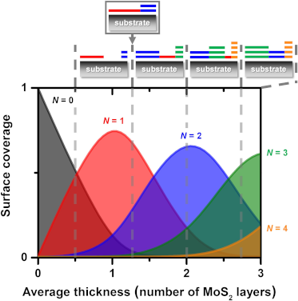
- SiO2 on Si substrates. Then, we discuss the applicability of the same criteria for significantly different DLI-PP-CVD MoS2 samples with average thicknesses ranging from sub-monolayer up to three layers. Finally, an original procedure based on the measurement of the intensity of the layer breathing
- , different information can be derived from the measurement of the Raman features (frequencies, linewidths, and intensities) of intralayer phonon modes as well as those of the interlayer modes, the so-called layer breathing (LB) modes and shear (S) modes. Recently, we have developed the reproducible direct
- underneath the MoS2 flake, A2D(Si) [28]; (iii) on the precise measurement of the A2D(Si)/A0(Si) intensity ratio [31]; and (iv) on the measurement of ultralow-frequency modes, the so-called breathing modes and shear modes. The frequencies and the number of LB and S modes allow one to identify the number of


Ultrasensitive and ultrastretchable metal crack strain sensor based on helical polydimethylsiloxane
Beilstein J. Nanotechnol. 2024, 15, 270–278, doi:10.3762/bjnano.15.25
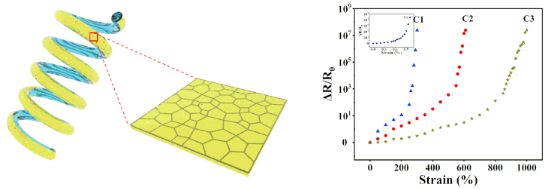
- reduction of current paths between the Au islands. This reduction in the number of effective Au bridges that can electrically connect the ruptured film portions under high strain results in a rapid increase in total resistance. Figure S3 (Supporting Information File 1) illustrates the measurement of


Design, fabrication, and characterization of kinetic-inductive force sensors for scanning probe applications
Beilstein J. Nanotechnol. 2024, 15, 242–255, doi:10.3762/bjnano.15.23
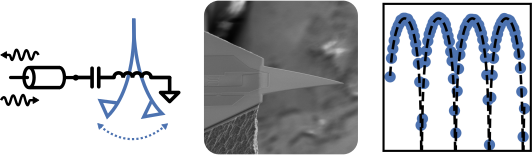
- power spectral density of fluctuations in force (force noise) SFF(ω), which sets a minimum detectable force (signal-to-noise ratio equals one) in a given measurement bandwidth, that is, signal integration time. The fluctuation–dissipation theorem applied to the harmonic oscillator gives where Tm is the
- proportionality factor, which depends on the excitation power, the resonator parameters, and the measurement line. If the motional sideband is larger than the noise floor of the detector, then force sensitivity is set by the properties of the mechanical resonator. First in the hierarchy of design constraints
- the resonant frequency ωc and the linewidth κ of the microwave resonator used to detect cantilever motion. A practical consideration is that our multifrequency measurement apparatus works in the frequency band of 4–8 GHz. This frequency range constrains the possible values of the circuit’s inductance

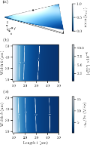


Quantitative wear evaluation of tips based on sharp structures
Beilstein J. Nanotechnol. 2024, 15, 230–241, doi:10.3762/bjnano.15.22
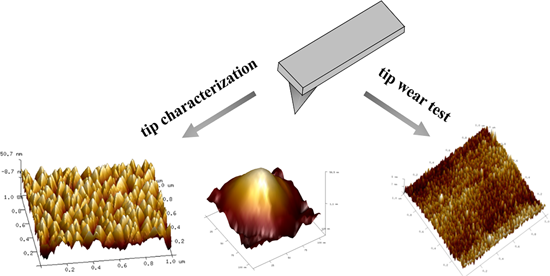
- nanotechnology [1][2][3][4][5]. Compared to optical and electron microscopy, AFM enables three-dimensional (3D) measurements of nanostructures in air and liquid environments [6]. The interaction between the tip and sample influences the measurement results of AFM by convoluting the tip topography with the sample
- the reconstructed nanoparticle. Zhang et al. [16] developed a 2 µm lattice sample with uniformity and consistency to reconstruct the AFM tip, thus mitigating the impact of tip effects on measurement results. Onishi et al. [17] proposed a technique to extract the probe shape function from AFM
- may harm the tip and impact the tip morphology measurement. In contrast, there were no substantial changes in the ETD in the morphology characterization results using the TipCheck sample. The outcomes from TipCheck sample imaging present considerable benefits. This approach significantly reduces the




Ion beam processing of DNA origami nanostructures
Beilstein J. Nanotechnol. 2024, 15, 207–214, doi:10.3762/bjnano.15.20
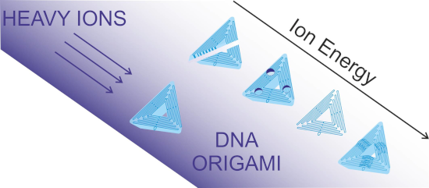
- was set to 2.5 × 10⁸ ions·cm−2·s−1. The ion flux was deduced from the measurement of the beam intensity using a detector based on secondary electron emission from a thin Fe foil placed inside the IRABAT vacuum chamber which allows for online monitoring during the irradiation of the samples. This


Modification of graphene oxide and its effect on properties of natural rubber/graphene oxide nanocomposites
Beilstein J. Nanotechnol. 2024, 15, 168–179, doi:10.3762/bjnano.15.16
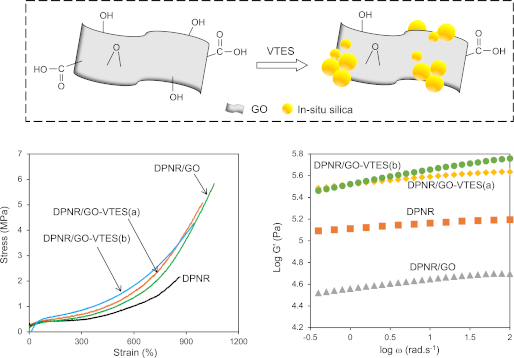
- with HITACHI S-4800. The measurement was performed at room temperature. The tensile properties of the composite samples were measured with a Tokyo Instron 5300 (Japan). The graft copolymer films (thickness of 1 mm) were cut in a dumbbell shape described in JIS K6251. Tensile measurements were done at
- the attachment of the sample to the measuring system. The frequency-dependent measurement was performed at an initial strain of 1% and at an angular frequency of 0.1–100 rad/s at 30 °C. The number of data points collected was 31. Results and Discussion Characterization of GO-VTES XRD Figure 3 shows
- -VTES samples. Acknowledgements We acknowledge the Center for Rubber Science and Technology (Hanoi University of Science and Technology, Vietnam) for kindly providing us with experimental equipments and measurement of tensile test. We also thank the Falculty of Engineering (Nagaoka University of






CdSe/ZnS quantum dots as a booster in the active layer of distributed ternary organic photovoltaics
Beilstein J. Nanotechnol. 2024, 15, 144–156, doi:10.3762/bjnano.15.14
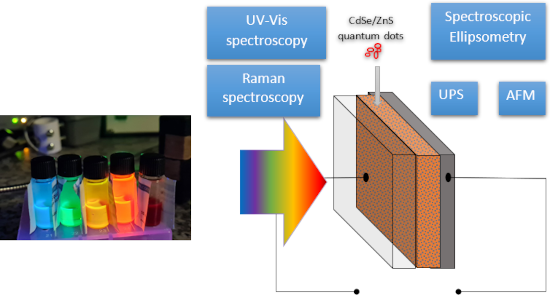
- spectra of a solid were studied as a thin film deposited on quartz, and measurements in solution were obtained in chloroform. The wavelength ranged from 250 to 1000 nm. A Woolam M-2000 ellipsometer was used for spectroscopic ellipsometry analysis. The measurement range was 350–1650 nm. The measurement was




In situ optical sub-wavelength thickness control of porous anodic aluminum oxide
Beilstein J. Nanotechnol. 2024, 15, 126–133, doi:10.3762/bjnano.15.12
- within 1–2 nm standard deviation on all samples. There was a linear relation between thickness measurement during anodization and post-production analysis using SE, with a slope coefficient of 1.1 and a constant offset of 5.4 nm (Figure 4f). The deviation from the ideal 1:1 relation can be explained by
- post-production analysis (Figure 4f). The potential extension of the interferometric thickness measurement method to thinner PAAO layers could involve the utilization of a shorter-wavelength light source and UV-compatible optical components. In such a scenario, considerations should be made for the
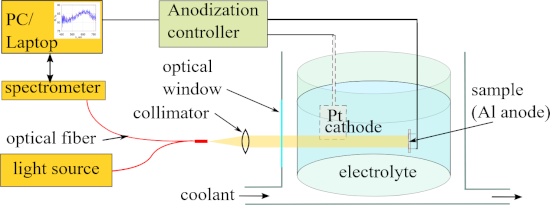
- other anodization voltages. The current flow through the Pt cathode could be established or interrupted automatically through a relay switch triggered by the thickness measurement software upon reaching the predefined threshold value. The anode current was monitored using a current-to-voltage (I/U


Development and characterization of potential larvicidal nanoemulsions against Aedes aegypti
Beilstein J. Nanotechnol. 2024, 15, 104–114, doi:10.3762/bjnano.15.10
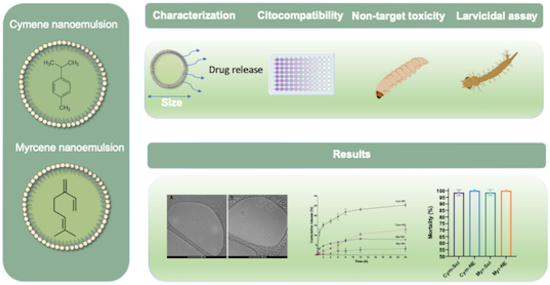
- the release of cymene and myrcene from the nanoemulsions was performed at specific time intervals: 30 min and 1, 2, 4, 6, 8, 12, and 24 h. Each measurement was repeated six times to ensure reliability. The released compounds were quantified by high-performance liquid chromatography, following a


New application of bimetallic Ag/Pt nanoplates in a colorimetric biosensor for specific detection of E. coli in water
Beilstein J. Nanotechnol. 2024, 15, 95–103, doi:10.3762/bjnano.15.9
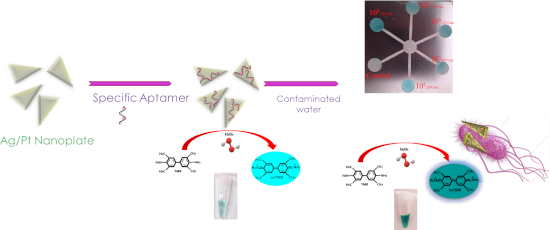
- lambda 25 UV–vis spectrometer was employed for UV–vis absorption measurement in the range of 200–800 nm. The morphology and shape of NPLs were studied using a field-emission scanning electron microscope (Supra 400VP, Zeiss, Oberkochen, Germany). Dynamic light scattering experiments were carried out at


Study of the reusability and stability of nylon nanofibres as an antibody immobilisation surface
Beilstein J. Nanotechnol. 2024, 15, 83–94, doi:10.3762/bjnano.15.8
- clinical applications. Immunoassay devices have been used not only for the detection of bacteria and viruses [7], but also for the measurement of drugs [8] and hormones [9], or for the determination of glucose in urine [10]. The specificity of antigen–antibody binding and how the antibody is attached to
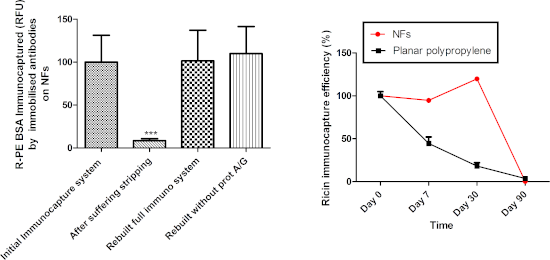
- contrast, a polypropylene microplate specifically designed to optimise an enzyme-linked immunosorbent assay showed a decreasing immunocapture capability such that seven days after the immunocapture system was assembled, only 44.6% of ricin was immunocaptured compared to the initial measurement result (day
- determination of exogenously produced biotoxins and virulence factors, as well as for the detection of viruses and biomarkers in clinical samples (e.g., hormones and biomolecules). (4) The data could be generalised not only for the measurement of warfare agents, but also for the diagnosis of water and food