Search results
Search for "cross section" in Full Text gives 522 result(s) in Beilstein Journal of Nanotechnology. Showing first 200.
Choosing a substrate for the ion irradiation of two-dimensional materials
Beilstein J. Nanotechnol. 2019, 10, 531–539, doi:10.3762/bjnano.10.54

- contribution of this mechanism to the total stopping cross section. At large incident ion energies, more than 99% of the ion energy loss can be attributed to the electronic stopping. As its role increases with the ion energy, massive atom ionization occurs, leading to the generation of hot electrons in the


Mechanical and thermodynamic properties of Aβ42, Aβ40, and α-synuclein fibrils: a coarse-grained method to complement experimental studies
Beilstein J. Nanotechnol. 2019, 10, 500–513, doi:10.3762/bjnano.10.51

- temperature. Results and Discussion Tensile deformation Our results for tensile deformation for all studied cases are illustrated in Figure 4. The initial length (L0) is measured after an equilibration of 100 τ. The cross-section area (A) for each system is monitored during the simulation and is shown as a
- function of the strain in the insets of Figure 4. The deviations are small compared to the mean value, especially in the case of β-amyloid fibrils. Hence, we calculated the stress using the average value of A. The values of the cross-section areas and the initial length for each fibril are listed in Table
- contrast, the interchain contacts, which keep together Aβ chains in the cross-section area, reduce their length. Moreover, in the case of α-syn there are no interchain contacts given that there is only one chain at the cross-section. In this case, only the intrachain contacts stretch during tensile


Biological and biomimetic surfaces: adhesion, friction and wetting phenomena
Beilstein J. Nanotechnol. 2019, 10, 481–482, doi:10.3762/bjnano.10.48

- cross section of recent developments in this highly diverse and interdisciplinary field of research. The articles highlight recent achievements in the understanding of animal and plant surfaces in the broadest context of adhesion, friction, and wetting phenomena on one hand. On the other hand, they
Wearable, stable, highly sensitive hydrogel–graphene strain sensors
Beilstein J. Nanotechnol. 2019, 10, 475–480, doi:10.3762/bjnano.10.47

- when the layer is stretched, which will enhance the resistance change of the hydrogel under strain. The SEM image of the cross section of the graphene/hydrogel composite is shown in Supporting Information File 1, Figure S2. A great contact between the graphene layer and the hydrogel layer can be seen
- showing the real life application of the strain sensor to sense the movement of the proximal interphalangeal joint (c) and the metacarpophalangeal joint (d). Supporting Information Yield strain stress curve of the hydrogels; Cross-section SEM image of the graphene/hydrogel composite; Hysteresis curve for
- the graphene/WG-hydrogel strain sensor; Optical cross-section images of the graphene/WG-hydrogel composite before and after stretching. Supporting Information File 54: Additional figures. Acknowledgements This work was supported by the National Natural Science Foundation of China (NSFC No.51501140


Improving control of carbide-derived carbon microstructure by immobilization of a transition-metal catalyst within the shell of carbide/carbon core–shell structures
Beilstein J. Nanotechnol. 2019, 10, 419–427, doi:10.3762/bjnano.10.41

- 5 s per step. The XRD diffractograms were deconvoluted to evaluate the properties of graphitic reflexes (see exemplary deconvolution in Figure 7). The graphite dimension (La of the in-plane and Lc of the cross section size) was evaluated by the Scherrer equation shown in Equation 2 [34]. where λ is
- crystallite dimension for the in-plane (La) and cross section of multi-layer carbons (Lc) of final CDCs. (a) Temperature-programmed oxidation profile of final CDC; (b) the calculated fraction of Area II representing content of more graphitic carbon. TEM images of CDC-Ni0 (a) and CDC-Ni60 (b,c). (a) N2


Integration of LaMnO3+δ films on platinized silicon substrates for resistive switching applications by PI-MOCVD
Beilstein J. Nanotechnol. 2019, 10, 389–398, doi:10.3762/bjnano.10.38

- ). Structural and electrical characterization Scanning electron microscopy (SEM) was performed in a Quanta250 environmental SEM FEG from FEI, and SEM FEG ZEISS GeminiSEM 500 to study the surface morphology and determine the LMO thickness using the cross section of the films. The cationic film composition was
- nanostructure growth was further analyzed in cross section by transmission electron microscopy (TEM), a JEOL 2011 equipment operating at 200 kV with a 0.19 nm point-to-point resolution. X-ray absorption near-edge spectroscopy (XANES) spectra at the Mn K-edge of LMO thin films were collected at the ESRF ID12
- substrate surface. The main issues were Pt dewetting, the formation of pinholes at the LMO film, and/or LMO film cracking due to Pt grain evolution. The surface and the cross section of the heterostructures showing cracking of the sample, holes and Pt percolating to the surface are presented in Figure S1


Geometrical optimisation of core–shell nanowire arrays for enhanced absorption in thin crystalline silicon heterojunction solar cells
Beilstein J. Nanotechnol. 2019, 10, 322–331, doi:10.3762/bjnano.10.31

- dependence of absorption on the nanowire cross section, a weaker effect of the nanowire height and good resilience for angles of incidence of light up to 60°. Conclusion: The presence of a nanowire array increases the optical performance of ultra-thin crystalline silicon solar cells in a wide range of
- = 800 nm, the height is h = 2 μm and the cross section is d = 200 nm. A depiction of one unit cell of the device model is presented in Figure 3. Appropriately defined periodic boundary conditions ensure the creation of a complete solar cell endowed with an hexagonal nanowire array. The crystalline
- absorber of the NW device () is significantly higher then the value computed for the FLAT reference (), but can be further increased by careful optimisation of the nanowire geometry. To this purpose, the height (h) and cross section (d) of the nanowires were varied in the ranges of 0–5 μm and 0–700 nm


Electromagnetic analysis of the lasing thresholds of hybrid plasmon modes of a silver tube nanolaser with active core and active shell
Beilstein J. Nanotechnol. 2019, 10, 294–304, doi:10.3762/bjnano.10.28

- they are apparently not interesting for applications. We believe that the new results presented will help in the design of nanotube lasers, which are essentially single-mode sources. Cross section of a nanolaser built on a silver nanotube with an active core and an active shell. Relief of the function


![[Graphic 29]](/bjnano/content/inline/2190-4286-10-28-i46.svg?max-width=637&scale=1.18182) λ = 565.03...
λ = 565.03...

![[Graphic 36]](/bjnano/content/inline/2190-4286-10-28-i53.svg?max-width=637&scale=1.18182) ...
...


A Ni(OH)2 nanopetals network for high-performance supercapacitors synthesized by immersing Ni nanofoam in water
Beilstein J. Nanotechnol. 2019, 10, 281–293, doi:10.3762/bjnano.10.27

- synthesis of Ni(OH)2 nanopetals. It is worth noting that the sandwich-like Ni(OH)2/Ni-NF/MG composite electrode exhibits excellent flexibility. This can be explained by the fact that the Ni-NF/MG substrate was obtained by dealloying ductile Ni40Zr20Ti40 MG. The cross section (Figure 3a) shows that the Ni-NF


Relation between thickness, crystallite size and magnetoresistance of nanostructured La1−xSrxMnyO3±δ films for magnetic field sensors
Beilstein J. Nanotechnol. 2019, 10, 256–261, doi:10.3762/bjnano.10.24

- SU70). The structural analysis was performed in cross section geometry by TEM (FEI Tecnai G2 F20 X-TWIN). The elemental composition analysis was performed by inductively coupled plasma high-resolution mass spectrometry (ICP-MS) - Thermo Scientific Element2, where the films were totally dissolved in 2


Nanoporous water oxidation electrodes with a low loading of laser-deposited Ru/C exhibit enhanced corrosion stability
Beilstein J. Nanotechnol. 2019, 10, 157–167, doi:10.3762/bjnano.10.15

- Ru3(CO)12 solutions. SEM images of planar samples coated with laser-induced Ru/C films in cross-section (a) and top-view (b). Laser-irradiation of Ru3(CO)12 solutions results in continuous and rough thin films deposited on ITO. Preparation of nanostructured Ru/C electrodes. (a) Anodization of Al in 1
- deposition areas of 2 mm diameter on an anodic alumina substrate of 16 mm diameter. (d) Sputter-coating of the ITO backside contact. Scanning electron micrographs of a nanostructured Ru/C sample after all preparation steps in top view (a) and cross-section (b). EDX spectrum recorded over the whole sample
- length L = 24 μm (c). EDX profile taken along the cross-section (d). Laser-irradiation of Ru3(CO)12 solutions results in thin ruthenium containing coatings along the whole length of Al2O3 pores. Raman spectra of a nanostructured template coated with Ru/C films, without ITO contact (a) and of the solid


Graphene–graphite hybrid epoxy composites with controllable workability for thermal management
Beilstein J. Nanotechnol. 2019, 10, 95–104, doi:10.3762/bjnano.10.9

- difference in applicative TC performances caused by the different rheological behaviors of the two samples. A SEM micrograph of a cross-section of sample Y (the higher viscosity TIM, solid mixing) showed interfacial defects in the form of voids between the Cu plates and the composite (Figure 6b). These voids


Pull-off and friction forces of micropatterned elastomers on soft substrates: the effects of pattern length scale and stiffness
Beilstein J. Nanotechnol. 2019, 10, 79–94, doi:10.3762/bjnano.10.8

- successfully expanded to fabricate adhesives with two geometries, namely dimples with and without a terminal layer. Dimples without a terminal layer were fabricated on two length scales, namely with sub-microscale and microscale dimple diameters. The cross section of samples with a terminal layer showed voids
- = 100) (Figure 3, left). The depth of dimples from microscale particles could not be accurately determined from microscopic cross-section images, as it is unknown whether a dimple was sectioned through its center, where the diameter is largest. From the cross section shown at Figure 3 (left, inset), the
- dimple depth was equal to half of the dimple diameter. The cross section of samples with a terminal layer showed voids with a spherical shape, separated by hourglass-shaped walls (Figure 3, right, inset). These voids penetrate the terminal layer, resulting in an array of holes at the surface (Figure 3


Contact splitting in dry adhesion and friction: reducing the influence of roughness
Beilstein J. Nanotechnol. 2019, 10, 1–8, doi:10.3762/bjnano.10.1

- the power of three in determination of the area moment of inertia for the flap cross-section). Assuming that flaps of 5 µm in thickness are not able to adapt to surface irregularities having a wavelength of less than 10 µm, we used this latter value as a cut-off length to filter out the waviness


A new bioinspired method for pressure and flow sensing based on the underwater air-retaining surface of the backswimmer Notonecta
Beilstein J. Nanotechnol. 2018, 9, 3039–3047, doi:10.3762/bjnano.9.282

- socket septum (ss) is attached to the tip of the dendrite where the tubular body is located. a) Three-dimensional reconstruction of a hemelytron µCT scan. The tomography data allowed an analysis of the outer and inner structures of the hemelytron. b) Digital cross section through a SR-µCT scan of a
- hemelytron. c) Part of the cross section, where the dendritic canal below the setal base is visible, indicating an innervation of the seta. d–h) A stack of µCT-images used for tracking single seta and identifying the corresponding setal base and setal tip. Toluidine blue/borax stained semi-thin sections
- ) Projection through a stack of images using confocal laser scanning microscopy. The picture shows the structure of the setae and the reflecting air layer in between the club-setae. d) Cross section through the image stack at the position of the blue line in (c) at ambient pressure. The shape of the air–water


Femtosecond laser-assisted fabrication of chalcopyrite micro-concentrator photovoltaics
Beilstein J. Nanotechnol. 2018, 9, 3025–3038, doi:10.3762/bjnano.9.281
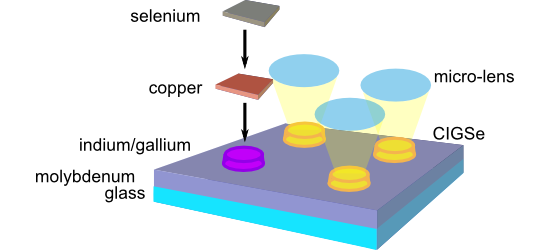
- . Cross section of a CISe micro absorber island after processing to a micro cell imaged by tilted-view SEM. Note that the different materials were artificially post-colorized to enhance their visibility. The height of the CISe absorber is ca.1 µm. Electrical characterization with different light


Size limits of magnetic-domain engineering in continuous in-plane exchange-bias prototype films
Beilstein J. Nanotechnol. 2018, 9, 2968–2979, doi:10.3762/bjnano.9.276

- nm. The white line indicates a cross section of the phase contrast signal along a stripe at a y-position of 6 μm averaged over 4 μm width. The black boxes above the measurement data highlight the position of the different areas containing set stripe patterns with widths of 5 μm, 2 μm, 1 μm, 500 nm


![[Graphic 63]](/bjnano/content/inline/2190-4286-9-276-i63.svg?max-width=637&scale=1.18182) .
. ![[Graphic 64]](/bjnano/content/inline/2190-4286-9-276-i64.svg?max-width=637&scale=1.18182) is the angle between the domain wall (DW) normal vector
is the angle between the domain wall (DW) normal vector ![[Graphic 65]](/bjnano/content/inline/2190-4286-9-276-i65.svg?max-width=637&scale=1.18182) and the local unidirectio...
and the local unidirectio...
Time-resolved universal temperature measurements using NaYF4:Er3+,Yb3+ upconverting nanoparticles in an electrospray jet
Beilstein J. Nanotechnol. 2018, 9, 2916–2924, doi:10.3762/bjnano.9.270

- absorption cross section of water at 980 nm (3 × 10⁻²⁸ m2/molecule) [38], Nw is the number density of water (3.33 × 1028 molecules/m3). The rate of heat loss is given by Equation 3 where h and S are the heat-transfer coefficient and surface concentration of water perpendicular to the direction of heat
- total photoluminescence intensity of UCNPs versus distance from the tip of a Taylor cone (xtip = 0). Both sampling time and intensity follow an r2-dependence along the jet where r is the radius of the cross section perpendicular to x. Distance x and radius r are related by r = x tanθ where θ is the


The effect of flexible joint-like elements on the adhesive performance of nature-inspired bent mushroom-like fibers
Beilstein J. Nanotechnol. 2018, 9, 2893–2905, doi:10.3762/bjnano.9.268

- constant cross-section for the entire composite fiber. Prior to peel, the boundary condition for the fiber is fixed–fixed. Assuming that the problem is linear, and for simplicity that the fiber is tilted but straight, the compatibility equation such that the null slope at the tip due to the fixed boundary


Site-controlled formation of single Si nanocrystals in a buried SiO2 matrix using ion beam mixing
Beilstein J. Nanotechnol. 2018, 9, 2883–2892, doi:10.3762/bjnano.9.267

- recoil atom generated at x, and dσ/dl the differential cross section for the generation of such a recoil. To calculate the 1D mixing efficiency by means of static BCA computer simulation, the number of displacements Nd in a depth interval Δx at x with a displacement between l and l + Δl is counted for a
- predefined number Ni of incident ions, being related to the cross section according to where n(x) denotes the local atomic density. Thus, the mixing efficiency results as where xi and xf denote the initial and final depths, respectively, of each recoil generated within Δx. In Figure 4a the so obtained depth
- mixing efficiency can be defined as where d2σ/(dzdl) now denotes the differential cross section of recoil generation at (x,z) with a displacement l along x. Correspondingly, from the BCA simulation, can be used. The result for this case is given in Figure 4b as the 2D projection of the mixing efficiency


Disorder in H+-irradiated HOPG: effect of impinging energy and dose on Raman D-band splitting and surface topography
Beilstein J. Nanotechnol. 2018, 9, 2708–2717, doi:10.3762/bjnano.9.253

- -stacking also contribute to the Raman spectrum [17][18]. On the other hand, it is worth noting that even when most of the carbon bonds in hydrogenated graphene are sp3-hybridized, their contribution to the Raman spectrum is not expected due to the negligible cross section of C–C sp3 bonds at visible
- structural disorder from hydrogenation is not possible, because the cross section of C–C sp3 bonds in visible Raman characterization is negligible [9][18][21]. Besides, the observed shapes of the ID/IG ratio and the G band are consistent with those corresponding to graphite-like hydrogenated amorphous carbon
- identification of not only structural and topological disorder, but also of C–H and C–C sp3 bonds [15], a task which is not feasible with visible Raman spectroscopy, because the cross section of sp3-hybridized bonds for visible light excitation is negligible. Hydrogenated graphene Raman spectra have also been


Polarization-dependent strong coupling between silver nanorods and photochromic molecules
Beilstein J. Nanotechnol. 2018, 9, 2657–2664, doi:10.3762/bjnano.9.247

- black curve represents the spectral position of the maximum of the extinction cross-section of the ellipsoids in the SPY medium (the corresponding maps are not shown here) and the horizontal dashed white line corresponds to the MC absorption band. On both maps, a clear anti-crossing is then observed
- ) recorded experimentally and the corresponding Lorentzian fitted peaks (red curves). The peaks are located at 551 and 602 nm and their spectral width are equal to 129 and 50 nm, leading to linewidths of 527 and 171 meV. Figure 4b shows the scattering cross-section spectrum obtained with our analytical model
- transverse (90°) plasmonic peak as a function of the rod width for a fixed length of 110 nm. (b) Calculated extinction cross-section map for the corresponding ellipsoids as a function of the wavelength and the ellipsoid width. (c) Experimental spectral evolution of the longitudinal (0°) plasmonic peak as a


Impact of the anodization time on the photocatalytic activity of TiO2 nanotubes
Beilstein J. Nanotechnol. 2018, 9, 2628–2643, doi:10.3762/bjnano.9.244

- ) equipped with a CCD detector and holographic grating of 1200 grooves/mm. SEM images, a) top and b) cross section, of TNTs for each of the anodization times (ta): c) 0.5 h, d) 1 h, e) 2 h, and f) 4 h. g) EDS spectra of a TNT array after 0.5 h of anodization. High-resolution XPS spectra for Ti 2p, O 1s, F 1s


Characterization of the microscopic tribological properties of sandfish (Scincus scincus) scales by atomic force microscopy
Beilstein J. Nanotechnol. 2018, 9, 2618–2627, doi:10.3762/bjnano.9.243

- gives the averaged frictional force
. The corresponding frictional coefficient μ was obtained by subsequently fitting the data with Ffric = Fad + µ·Fload. Cantilevers and the cross section of a sandfish dorsal scale were imaged by scanning electron microscopy (SEM, SUPRA 60 VP, Zeiss, Germany
- . Nonetheless, larger images frequently reveal very fine groves, which might originate from scratches. A cross section of a dorsal scale imaged by electron microscopy is displayed in Figure 3c and shows an inner structure that suggest that the scale consists of several thin layers. Wetting properties Some
- -tooth like shape magnified in the inset. (b) The topography of a ventral scale does not reveal steps. However, tiny scratches are sometimes visible. (c) A cross section of a dorsal scale recorded by scanning electron microscopy suggests that sandfish scales have a layered internal structure. (a) Typical


Enhancement of X-ray emission from nanocolloidal gold suspensions under double-pulse excitation
Beilstein J. Nanotechnol. 2018, 9, 2609–2617, doi:10.3762/bjnano.9.242

- great interest, due to the efficient conversion of the absorbed energy into energetic ions, electrons and X-rays [12][13][14]. Plasmonic nanoparticles are expected to be highly useful for femtosecond laser-based X-ray emission due to high functionality, large absorption cross section and spectral


