Search results
Search for "frequency shift" in Full Text gives 131 result(s) in Beilstein Journal of Nanotechnology.
A robust AFM-based method for locally measuring the elasticity of samples
Beilstein J. Nanotechnol. 2018, 9, 1–10, doi:10.3762/bjnano.9.1

- of samples (Nat. Commun. 2014, 5, 3126). This method gives evidence for the linearity of the relation between the frequency shift of the cantilever first flexural mode Δf1 and the square of the frequency shift of the second flexural mode Δf22. In the present work, we showed that a similar linear
- excitation of two cantilever eigenmodes [17][18][19][20][21], are performed in non-dry air, the instability of the tip–sample distance feedback loop, due to the use of the frequency shift as control parameter, makes the application of the method difficult if not impossible. However, despite these
- and Δfi(dm) are, respectively, the force constant, the oscillation amplitude, the resonance frequency and the frequency shift of the i-th flexural mode in free space as a function of dm, the closest distance between tip and sample in an oscillation cycle. The validity of the relation and the stability


Material discrimination and mixture ratio estimation in nanocomposites via harmonic atomic force microscopy
Beilstein J. Nanotechnol. 2017, 8, 2771–2780, doi:10.3762/bjnano.8.276

- frequencies [33][34]. A higher elastic modulus, and therefore higher stiffness, will lead to a larger frequency shift, as schematically illustrated by the solid line, see Figure 4b. Similarly, a smaller elastic modulus causes a smaller frequency shift, as depicted by the dotted line. When the drive frequency
- amplitude contrast reversal occurs. The contrast reversal with an increase of the drive frequency can thus be qualitatively interpreted. From the cantilever spectra we find that the resonance frequency shift and the quality factor induce the contrast inversion. Actually, the contrast reversal in the


Magnetic properties of optimized cobalt nanospheres grown by focused electron beam induced deposition (FEBID) on cantilever tips
Beilstein J. Nanotechnol. 2017, 8, 2106–2115, doi:10.3762/bjnano.8.210

- field gradient on the nanosphere. In the experimental conditions, the cantilever frequency shift is directly proportional to the magnetization of the cobalt nanosphere (see Equation 1 in the Experimental section), which allows simple extraction of its hysteresis curve. This is shown in Figure 6a,b for a
- standard laser deflection technique is used to monitor the displacement of the cantilever. Its resonance frequency is tracked using a piezoelectric bimorph and a feedback electronic circuit based on a phase lock loop. The relative frequency shift due to the force acting on the magnetic moment m of the


A comparative study of the nanoscale and macroscale tribological attributes of alumina and stainless steel surfaces immersed in aqueous suspensions of positively or negatively charged nanodiamonds
Beilstein J. Nanotechnol. 2017, 8, 2045–2059, doi:10.3762/bjnano.8.205

- Equation 1 and Equation 3 can be added linearly to obtain the combined effect so long as the mass is not slipping on the surface electrode [36]. Therefore the frequency shift associated with mass uptake from a liquid is the same as mass uptake from a vacuum. If the adsorbed particles slip on the QCM
- surface in a response to the oscillatory motion, and/or the no-slip boundary conditions are altered at the upper boundary of the film with the surrounding liquid, the magnitude of the frequency shift δffilm will be lower than that of a rigidly attached film [27][37][40]. These effects may cause the


Fully scalable one-pot method for the production of phosphonic graphene derivatives
Beilstein J. Nanotechnol. 2017, 8, 1094–1103, doi:10.3762/bjnano.8.111

- cm−1. A small shift of the 2D peak, together with a decrease of its intensity can also be observed. According to the literature the frequency shift of G and 2D is connected with changes in the number of stacking layers in GO and rGO. It was proved that if the number of layers decreases, the G band


Optimizing qPlus sensor assemblies for simultaneous scanning tunneling and noncontact atomic force microscopy operation based on finite element method analysis
Beilstein J. Nanotechnol. 2017, 8, 657–666, doi:10.3762/bjnano.8.70

- date mostly conducted in frequency modulation (FM) mode, where the reduction of the eigenfrequency f0 upon approach to the surface is the measured quantity (the so-called “frequency shift” Δf) [32]. Since Δf f0/k [33][34][35][36], we have to weight variations in f0 and k combined rather than


Multimodal cantilevers with novel piezoelectric layer topology for sensitivity enhancement
Beilstein J. Nanotechnol. 2017, 8, 358–371, doi:10.3762/bjnano.8.38

- frequency shift of the cantilever’s motion correlate to properties of the sample [15]. When closing a feedback loop around these observables with the z-axis nanopositioner, the controller output is routinely used to map the surface topography of the sample. Recently, the additional excitation and detection


Surface-enhanced Raman scattering of self-assembled thiol monolayers and supported lipid membranes on thin anodic porous alumina
Beilstein J. Nanotechnol. 2017, 8, 74–81, doi:10.3762/bjnano.8.8

- quantification of the adsorbed mass onto the surface of a vibrating Au-coated quartz electrode through the measurement of the mass-induced frequency shift. Additionally, the measurement of the dissipation gives indication about the viscoelastic properties of the adsorbed layer. The quartz–Au substrate was thus
- frequency shift is low (Δf ≈ −157 Hz for the reported 7th harmonic) and the value of dissipation is close to zero, indicating the adsorption of a smaller mass with more rigid structure on the surface. The reason may be that the POPC/POPS vesicles rupture in contact with the AT-functionalized Au and an SLB


Noise in NC-AFM measurements with significant tip–sample interaction
Beilstein J. Nanotechnol. 2016, 7, 1885–1904, doi:10.3762/bjnano.7.181
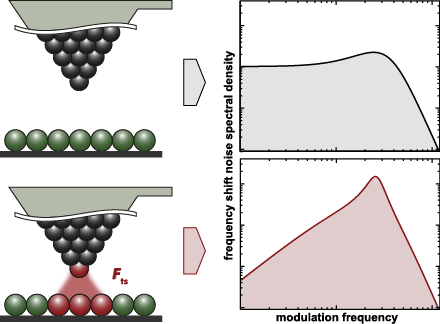
- & Astronomy, The University of Nottingham, University Park, Nottingham NG7 2RD, UK 10.3762/bjnano.7.181 Abstract The frequency shift noise in non-contact atomic force microscopy (NC-AFM) imaging and spectroscopy consists of thermal noise and detection system noise with an additional contribution from
- : amplitude noise; cantilever stiffness; closed loop; detection system noise; frequency shift noise; non-contact atomic force microscopy (NC-AFM); Q-factor; spectral analysis; thermal noise; tip–sample interaction; Introduction Non-contact atomic force microscopy (NC-AFM) [1][2] is an unmatched surface
- science tool, especially when it comes to studying non-conducting surfaces [3][4], to map sub-molecular structures [5] or to measure forces [6] and force fields [7] with highest resolution. The primary imaging signal in NC-AFM is the frequency shift Δf of a probe resonator carrying a tip interacting with


![[Graphic 32]](/bjnano/content/inline/2190-4286-7-181-i73.png?max-width=637&scale=1.18182) wit...
wit...

![[Graphic 34]](/bjnano/content/inline/2190-4286-7-181-i75.png?max-width=637&scale=1.18182) wit...
wit...


Tunable longitudinal modes in extended silver nanoparticle assemblies
Beilstein J. Nanotechnol. 2016, 7, 1219–1228, doi:10.3762/bjnano.7.113

- valence electrons. For example, localized plasmon resonance arises from the restoring force exerted on electrons driven by an external field, which results in field amplification in the near-field zone at the particle surface. Alterations in particle size and shape cause a frequency shift in the localized


Customized MFM probes with high lateral resolution
Beilstein J. Nanotechnol. 2016, 7, 1068–1074, doi:10.3762/bjnano.7.100

- tip with a 20 nm thick coating. Figure 3a shows grains of the order of 10 nm in size, a remarkable resolution even for non-magnetic AFM probes. The corresponding MFM image shows series of bright and dark stains associated to domains with alternate OOP magnetization (Figure 3b). The frequency shift
- ) Corresponding MFM image showing single domains with alternating OOP orientations. (c) Frequency shift profile along the line shown in (b) that gives an inter-domain distance of about 25 nm. Supporting Information Supporting Information File 162: Additional experimental data. Acknowledgements This work was


Signal enhancement in cantilever magnetometry based on a co-resonantly coupled sensor
Beilstein J. Nanotechnol. 2016, 7, 1033–1043, doi:10.3762/bjnano.7.96

- as nanocantilever and magnetic sample. Measurements revealed an enhancement of the commonly used frequency shift signal by five orders of magnitude compared to conventional cantilever magnetometry experiments with similar nanomagnets. With this experiment we do not only demonstrate the functionality
- external magnetic field is applied to the setup, the magnetic interaction of the sample with the field alters the resonance frequency of the cantilever by creating a torque [3]. The resulting frequency shift can be used as measurement signal to derive information on the properties of the sample. In most
- cases the motion of the cantilever is detected optically, for example via laser deflection or laser interferometry [4]. With decreasing sample size, the cantilever has to be adapted to compensate the weaker magnetic interaction and, therefore, the loss in signal strength of the frequency shift. This is


![[Graphic 11]](/bjnano/content/inline/2190-4286-7-96-i21.png?max-width=637&scale=1.18182) on the interaction spring constant k3. Th...
on the interaction spring constant k3. Th...
Generalized Hertz model for bimodal nanomechanical mapping
Beilstein J. Nanotechnol. 2016, 7, 970–982, doi:10.3762/bjnano.7.89

- , where the resonance frequency fc is tracked with a phase-locked-loop (PLL), the measured frequency shift Δf can be used to estimate the interaction stiffness by the approximation In this mode, the oscillation amplitude is held constant with an AGC. The use of an AGC will be assumed for “FM mode


![[Graphic 4]](/bjnano/content/inline/2190-4286-7-89-i40.png?max-width=637&scale=1.18182) approximation applied to Equation 6 i...
approximation applied to Equation 6 i...


Modelling of ‘sub-atomic’ contrast resulting from back-bonding on Si(111)-7×7
Beilstein J. Nanotechnol. 2016, 7, 937–945, doi:10.3762/bjnano.7.85

- , and presence of the rest atoms. Comparison of Δf and force, and effect of oscillation amplitude In the limit of small oscillation amplitudes, the frequency shift tends towards the force gradient between tip and sample [19], however, it is less trivial to determine how the frequency shift relates to
- column (top to bottom): 0.875 nm, 0.755 nm, 0.735 nm, 0.710 nm. Tip stiffness kxy = 0.5 N/m for all simulations. Comparison of the evolution in force (top row) and frequency shift (lower two rows). The evolution in Δf is shown for oscillation amplitudes of 0.1 nm (middle row), and 0.5 nm (lower row). The


High-resolution noncontact AFM and Kelvin probe force microscopy investigations of self-assembled photovoltaic donor–acceptor dyads
Beilstein J. Nanotechnol. 2016, 7, 799–808, doi:10.3762/bjnano.7.71

- Omicron VT-AFM setup under UHV at room temperature. For each image, the frequency shift, Δf, and vibration amplitude, AVib, are indicated in the corresponding figure caption. Silicon cantilevers (SuperSharpSilicon, Nanosensors, n+-doped, stiffness 40 N/m, resonance frequency in the 280–300 kHz range) were


Coupled molecular and cantilever dynamics model for frequency-modulated atomic force microscopy
Beilstein J. Nanotechnol. 2016, 7, 708–720, doi:10.3762/bjnano.7.63

- cantilever. It gives new insight into the correlation between the experimentally monitored frequency shift and cantilever damping due to the interaction between tip atoms and scanned surface. Applying the model to ionic crystals with rock salt structure two damping mechanisms are investigated, which occur
- disentangle concurrent complex processes that determine the imaging data, i.e., cantilever damping and frequency shift. Roughly, two types of simulations can be distinguished. First, there are simulations of the dynamics of the whole measurement setup [8][9]. They are crucial for understanding experimental
- presence or absence of adhesion hysteresis, if the dissipated energy is not replenished fast enough [14], or the effects of lateral tip displacements on the frequency shift [15] and on the cantilever damping [7]. In all these models, adhesion hysteresis can only be incorporated a priori, e.g., by using


Finite-size effect on the dynamic and sensing performances of graphene resonators: the role of edge stress
Beilstein J. Nanotechnol. 2016, 7, 685–696, doi:10.3762/bjnano.7.61

- area of a graphene sheet, the inertia term can be written as Here, Δρ is the mass per unit length for adsorbed atoms. It is straightforward to compute the frequency shift (Δω) of a graphene resonator due to atomic adsorption such as Δω = ω(m + Δm) − ω(m), where ω(m + Δm) is the resonant frequency of a
- graphene resonator onto which atoms are adsorbed, and ω(m) is the resonant frequency of a bare graphene resonator. Here, we note that since the elastic modulus of adsorbed atoms is much smaller than that of the graphene resonator, the frequency shift of the graphene resonator is mostly attributed to the
- play in the harmonic oscillation behavior of a graphene resonator. Here, we define the frequency shift caused by edge stress as Δωedge = ωedge − ω0, where ωedge is the resonant frequency of graphene measured from the modified plate theory (i.e., including edge stress effects). It is shown in Figure 1b


Length-extension resonator as a force sensor for high-resolution frequency-modulation atomic force microscopy in air
Beilstein J. Nanotechnol. 2016, 7, 432–438, doi:10.3762/bjnano.7.38

- stiffness allows for operation at very small amplitudes down to tens of picometres and atomic resolution has already been achieved in UHV [10][11][12][13]. The sensor is also suited for simultaneous measurements of the frequency shift and tunnelling current [12][13][14]. Only a few applications of the LER
- resonance frequency and Q-factor, a problem also well-known for regular cantilevers. The problem is aggravated for the LER since the measured signal, i.e., the frequency shift Δf, is small due to the high stiffness of the LER (Δf f0/keff). Hence a controlled environment is essential for stable imaging
- connected to a charge amplifier (HQA-15M-10T, FEMTO) (output). Input and output are connected to an oscillator and phased-locked loop (HF2, Zurich Instruments), respectively (see Figure 1a). We use the frequency shift Δf as feedback signal for topography while maintaining a constant amplitude with a


3D solid supported inter-polyelectrolyte complexes obtained by the alternate deposition of poly(diallyldimethylammonium chloride) and poly(sodium 4-styrenesulfonate)
Beilstein J. Nanotechnol. 2016, 7, 197–208, doi:10.3762/bjnano.7.18

- processed using the software WSxM from Nanotec Electronica [28]. Results and Discussion Wet films vs dry films The growth of polyelectrolyte multilayers of (PDADMAC + PSS)N was followed by monitoring the frequency shift (Δf) of the QCM-D normalized by the overtone number (ν), −Δf/ν, as a function of the
- number of bilayers (N) [19][29]. It is well known that the adsorbed mass calculated using Sauerbrey’s equation underestimates the real mass of viscoelastic films [30][31][32]. Figure 1 shows the frequency shift as a function of N for wet and dry multilayers (PDADMAC + PSS)N. The differences between wet
- , among them the most evident is the adsorbed mass (see Figure 1). Because the QCM-D detects both the polymer adsorbed and the hydration water, drying of the films reduces the adsorbed mass (lower resonance frequency shift). The drying process makes the polymer matrix shrink, which is critically related


Fabrication and characterization of novel multilayered structures by stereocomplexion of poly(D-lactic acid)/poly(L-lactic acid) and self-assembly of polyelectrolytes
Beilstein J. Nanotechnol. 2016, 7, 81–90, doi:10.3762/bjnano.7.10

- after synthesis and purification. QCM measurements As a first step, the LBL assembly of PEM and PLA polymers was carried out on QCM electrodes in order to monitor the effective multilayer growth. The QCM frequency shift, due to the deposition of material onto the electrode surface, was measured and the
- the quartz crystal surface is mostly negatively charged, PAH was deposited as the first layer. The PEM structure shows a mean mass of 85.38 ng, with a mean frequency shift of 155.4 Hz. The total mass of adsorbed PLA layers with PEM precursor was found to be 1468 ng with a mean mass of 245 ng/layer


Dependence of lattice strain relaxation, absorbance, and sheet resistance on thickness in textured ZnO@B transparent conductive oxide for thin-film solar cell applications
Beilstein J. Nanotechnol. 2016, 7, 75–80, doi:10.3762/bjnano.7.9

- , εxx, and in the y-direction, εyy, of ZnO films can be determined by the frequency shift, Δω = ω−ω0 [21], as: where a = −774 cm−1 and b = −375 cm−1 are the deformation potential constants of the A1(TO) mode [22]. The elastic stiffness constants, C33 and C13, are 216 and 104 GPa, respectively [1]. The
- six-fold symmetry of the hexagonal polar c-ZnO dictates an isotropic in-plane strain in the basal plane, i.e., εxx = εyy = ε. The frequency shift,s Δω, for the A1(TO) mode are shown in Table 1. The in-plane strain ε can be deduced from Equation 1. The in-plane tensile strain, ε, of the c-20, c-40, c


Controlled graphene oxide assembly on silver nanocube monolayers for SERS detection: dependence on nanocube packing procedure
Beilstein J. Nanotechnol. 2016, 7, 9–21, doi:10.3762/bjnano.7.2

- substrates were simultaneously coated by the same AgNC layer. Quartz crystal microbalance measurements. QCM experiments with impedance monitoring were performed on a QCM-Z500 (KSV Instruments Ltd) equipped with a thermoelectric (TE) module (Oven Instruments). The resonant frequency shift and the change in


A simple and efficient quasi 3-dimensional viscoelastic model and software for simulation of tapping-mode atomic force microscopy
Beilstein J. Nanotechnol. 2015, 6, 2233–2241, doi:10.3762/bjnano.6.229

- parameters constant. The most common example of a spectroscopic measurement in AFM is the recording of an observable (e.g., phase shift, frequency shift, deflection, specific harmonic amplitudes, etc.), while the base of the microcantilever is brought closer to the sample with a relatively small constant


Kelvin probe force microscopy for local characterisation of active nanoelectronic devices
Beilstein J. Nanotechnol. 2015, 6, 2193–2206, doi:10.3762/bjnano.6.225

- finding the noise power spectral density of the frequency shift signal in FM-AFM [24]. When the narrow-band conditions are not met (β >> 1), the iterative scheme for the sideband amplitudes in Equation 4 and Equation 5 still approaches the Bessel functions describing the sideband amplitudes in a general
- . Nevertheless, the averaging effect of the cantilever beam remains (see below in Figure 1). An alternative approach typically applied in vacuum is based on frequency modulation [15]. To this end, the frequency of the cantilever is usually tracked by a phase-locked loop (PLL). Its output signal, the frequency
- shift Δf, exhibits a frequency component at the electrostatic modulation frequency, which is nullified by the Kelvin feedback loop. Frequency modulated KFM (FM-KFM) [16][17] thus provides a map of potentials required to minimise the electrostatic force gradient, proportional to Δf for small mechanical


![[Graphic 33]](/bjnano/content/inline/2190-4286-6-225-i48.png?max-width=637&scale=1.18182) for different modulation amplitu...
for different modulation amplitu...


Virtual reality visual feedback for hand-controlled scanning probe microscopy manipulation of single molecules
Beilstein J. Nanotechnol. 2015, 6, 2148–2153, doi:10.3762/bjnano.6.220

- position of the SPM tip during manipulation in real time, while simultaneously plotting the experimentally measured frequency shift (Δf) of the non-contact atomic force microscope (NC-AFM) tuning fork sensor as well as the magnitude of the electric current (I) flowing between the tip and the surface. The
- for additional information). Supporting Information File 132: Interactive 3D models of the data shown in Figure 4. In order to view it unpack and open either ’df.html’ (frequency shift) or ’I.html’ (logarithm of the current) file.


