Search results
Search for "measurement" in Full Text gives 1111 result(s) in Beilstein Journal of Nanotechnology. Showing first 200.
Carbon nanotube-cellulose ink for rapid solvent identification
Beilstein J. Nanotechnol. 2023, 14, 535–543, doi:10.3762/bjnano.14.44

- -per-million concentrations with the sensor temperature set to 95 °C. Since glycerin does not evaporate at 95 °C, it leaves residues in the sensor matrix, preventing the same sensor device to be used in successive measurements. Thus, in this case a single (drop) measurement was performed for each
- liquid sensing; AFM images of (d) microfibrillated cellulose (MFC), (e) MWCNTs, and (f) MFC entangled with MWCNTs. (a) Gain curves obtained from different glycerin/water mixtures; each point at the PCA diagram (Figure 2b) was calculated from a single measurement. (b) PCA analysis of DI water, 10 ppm and


Nanoarchitectonics to entrap living cells in silica-based systems: encapsulations with yolk–shell and sepiolite nanomaterials
Beilstein J. Nanotechnol. 2023, 14, 522–534, doi:10.3762/bjnano.14.43

- biological viability (“gas release” as a measurement of active metabolism and “cell leakage” measuring the encapsulation strength). Physical-structural robustness focuses on the evolution of physical appearance and mechanical resistance of the bulk material with time. Macroscopic appearance corresponds to a
- cells to the surrounding medium can be studied by the presence of an increasing number of cells freely growing in it. The measurement of the absorbance of the culture medium is used to track the number of free cells that are reproducing outside the encapsulation system. For the physical-structural


On the use of Raman spectroscopy to characterize mass-produced graphene nanoplatelets
Beilstein J. Nanotechnol. 2023, 14, 509–521, doi:10.3762/bjnano.14.42

- produced and purchased. The publication of international standards is a key step in this process, such as recent publications on nomenclature [6] and structural characterization [7]. The measurement methods described in these standards, however, can be time-consuming and expensive. As the range of
- application areas as an in-line process analysis and control method [9][10][11][12]. Raman spectroscopy is particularly suited to the analysis of graphitic materials because of the large scattering cross section of graphitic materials and the large amount of information obtainable from a single measurement
- materials, either from large mechanically exfoliated flakes or CVD-grown materials. When measuring the Raman spectrum from aggregated few-layer graphene (FLG) powder, where many particles are probed in a single measurement, the Raman 2D peak still typically appears as a symmetric shape, although with lower


Evaluation of electrosynthesized reduced graphene oxide–Ni/Fe/Co-based (oxy)hydroxide catalysts towards the oxygen evolution reaction
Beilstein J. Nanotechnol. 2023, 14, 420–433, doi:10.3762/bjnano.14.34
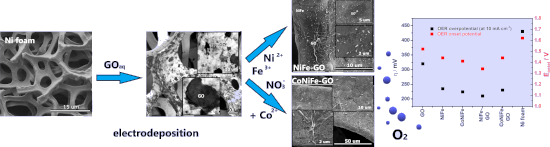
- of 1.46–1.48 V for NiFe, 1.46–1.47 V for CoNiFe, 1.44–1.46 V for NiFe-GO, and 1.44–1.45 V for CoNiFe-GO for the measurement period from t0h to t22h. In each case, the presence of GO in the structure resulted in a lower working potential for the entire duration of the measurement compared to the
- catalysts without GO. Moreover, it can be also observed that the addition of cobalt in the structure of the catalysts resulted in a slightly lower potential deviation during the measurement from t0h to t22h. The morphology of the catalysts after the test changed slightly in each case (Figure 8b–e). The
- , the substrates were cleaned ultrasonically in distilled water (5 min) and acetone (5 min). The reference and counter electrodes were Ag/AgCl (4 M KCl) and platinum mesh, respectively. Distilled water was used for the solutions. The measurement temperature was controlled by a thermostat (Julabo F12


Quercetin- and caffeic acid-functionalized chitosan-capped colloidal silver nanoparticles: one-pot synthesis, characterization, and anticancer and antibacterial activities
Beilstein J. Nanotechnol. 2023, 14, 362–376, doi:10.3762/bjnano.14.31

- was calculated from the obtained results. Results and Discussion The characterization of the synthesized silver nanoparticles (Ag NPs) was carried out by using UV–vis absorption spectroscopy at ambient temperature. Figure 2 shows the UV–vis absorption measurement results of different Ag NPs, which are


The steep road to nonviral nanomedicines: Frequent challenges and culprits in designing nanoparticles for gene therapy
Beilstein J. Nanotechnol. 2023, 14, 351–361, doi:10.3762/bjnano.14.30

- measurement. For NTA, ASTM 2834 provides workflows for planning NP experiments. Through the study of nanoscale extracellular vesicles, Bachurski et al. [68] provide some additional insights comparing the performance of different NTA systems to cryo-TEM and single-particle interferometric reflectance imaging
- escape. NAT are difficult to quantify if encapsulated into NP delivery carriers. The most common forms of nucleic acid measurement (i.e., UV–vis and fluorescence) provide limited insights for the characterization of NP-encapsulated NATs. Labeling and destructive methods both have drawbacks, ranging from


Biocatalytic synthesis and ordered self-assembly of silica nanoparticles via a silica-binding peptide
Beilstein J. Nanotechnol. 2023, 14, 280–290, doi:10.3762/bjnano.14.25

- tetraethyl orthosilicate (TEOS). OD profiles of the particle formation are shown in Figure 1a, and representative GC spectra of the control group are shown in Figure 1b. No particle formation or TEOS hydrolysis was observed in the negative control (no catalyst) group within the measurement timeframe. As seen
- other groups after approximately 20 min (Figure 1a). This was at first thought to be the result of an error in experimental methods or measurement. The reactions were repeated with freshly prepared solutions and different brands of 96-well plates, but the distinct profile was observed in each repetition


Concentration-dependent photothermal conversion efficiency of gold nanoparticles under near-infrared laser and broadband irradiation
Beilstein J. Nanotechnol. 2023, 14, 205–217, doi:10.3762/bjnano.14.20

- optical absorption characteristics of the nanoparticles. Thus, a broadband irradiation source may be useful in which the full width half maximum of the optical output can be tuned to suit the optical absorption characteristics of the nanoparticles. To the best of our knowledge, the measurement of the
- embedded in a medium, for instance, in tissue during plasmonic photothermal therapeutics, can be accomodated through the use of a NIR broadband source. Experimental setup for the measurement of the temperature rise of GNPs suspensions under irradiation. A NIR broadband light source (754–816 nm) and a NIR


A novel approach to pulsed laser deposition of platinum catalyst on carbon particles for use in polymer electrolyte membrane fuel cells
Beilstein J. Nanotechnol. 2023, 14, 190–204, doi:10.3762/bjnano.14.19

- graphitization were used as carbon supports. The best electrochemical measurement results were obtained for Pt deposited on Vulcan XC-72R. The peak power density measured for this material in a membrane electrode assembly (MEA) of a PEMFC (fed with H2/Air) was 0.41 W/cm2, which is a good result compared to 0.57
- pulses, which suggests that this sample should be comparable to the reference materials in terms of Pt content. However, given the differences in PtNPs area distribution compared to the reference catalyst, an assumption based only on the XPS measurement may be incorrect. Using 60000 laser pulses in the
- values of the Pt-to-C ratio, which are proportional to the number of laser pulses used, were calculated based on the EDS measurement (Table 1). In the EDS technique, the signal is recorded from a larger volume of material (a pear-shaped area with a typical diameter of 2–5 µm). Due to the dimensions and


High–low Kelvin probe force spectroscopy for measuring the interface state density
Beilstein J. Nanotechnol. 2023, 14, 175–189, doi:10.3762/bjnano.14.18

- by the CPD, is applied to the semiconductor sample. Therefore, the surface potential of the semiconductor is fixed at a certain energy, and only the surface state near the Fermi level of the surface is reflected in CPD measurements, making measurement of the energy distribution of the interface
- induced by the interface states. When the KPFM measurement is performed using a low-frequency AC bias voltage, the DC bias voltage that makes the modulation component of the frequency shift ΔfL(fm) zero is Here, Vs(LF) can be thought of as reflecting information about the sum of the surface potential
- (band bending) due to the interface states and the CPD between the metal tip and the bulk state of the sample. This is because when a low-frequency AC bias voltage is used, the charge Qit can respond to changes in the surface potential. In contrast, when the KPFM measurement is performed using a high


Structural, optical, and bioimaging characterization of carbon quantum dots solvothermally synthesized from o-phenylenediamine
Beilstein J. Nanotechnol. 2023, 14, 165–174, doi:10.3762/bjnano.14.17

- it is obvious that CQDs do not generate singlet oxygen. Further, we examined the ROS production of neat PU (control) and CQDs/PU composite samples by three methods, namely EPR, luminescence at 1270 nm, and UV–vis probe measurement. Figure 3a presents the intensity of EPR signals of control and CQDs
- excitation wavelength was 330 nm. Antibacterial testing International standard ISO 22196 (Plastics – Measurement of antibacterial activity on plastic surfaces) was used to examine the antibacterial activity of CQDs/PU composites [54]. The following strains were used for testing: Staphylococcus aureus ATCC


Batch preparation of nanofibers containing nanoparticles by an electrospinning device with multiple air inlets
Beilstein J. Nanotechnol. 2023, 14, 141–150, doi:10.3762/bjnano.14.15

- experiments were performed at 25 °C and 60% relative humidity. The following MEAI parameters were used. The receiving distance was 18 cm, the speed of the receiving drum was 300 r/min, the air flow rates were 0, 50, 100, and 150 m3/h, and the spinning voltages were 40, 50, and 60 kV. Measurement and


Intermodal coupling spectroscopy of mechanical modes in microcantilevers
Beilstein J. Nanotechnol. 2023, 14, 123–132, doi:10.3762/bjnano.14.13

- multitonal responses, from which the force is reconstructed. In this paper, we are building towards a hybrid multifrequency approach different from the ones described above. The on-resonance measurement would follow frequency-modulated AFM or bimodal AFM while being assisted by a new off-resonance excitation
- coherent bimodal drive to amplify the signal of the fundamental mode. Both increase the signal-to-noise ratio of the measurement, creating opportunity for either improved sensitivity or increased speed. Furthermore, sideband cooling has a secondary use in ultrahigh-vacuum AFM as a tool for controlling the
- measurement. These two kinds of behaviour have a regime associated to each, both directly related to the overall coupling strength . The i-th mode, as the sense mode, is in the weak regime if is smaller than Γj/2, the linewidth of the cavity mode. In this case its susceptibility (spectral response) can be


Characterisation of a micrometer-scale active plasmonic element by means of complementary computational and experimental methods
Beilstein J. Nanotechnol. 2023, 14, 110–122, doi:10.3762/bjnano.14.12

- distribution is investigated by means of scanning Joule expansion microscopy (SJEM) [32]. The technique provides a method to obtain the relative temperature distribution at the nanoscale starting from the measurement of induced thermal expansion, which can be directly mapped in a standard AFM-based image using
- diamond with a tip radius of 10 ± 5 nm. The deflection sensitivity of the probe was measured to be 81.09 nm/V. To perform an SJEM measurement, a sinusoidal voltage is applied to the metallic element. The surface of the element is then scanned with an AFM in contact mode. Contact mode was selected in this
- temperature affects a change in the optical constants of the system, thereby altering the SPR curve including its resonance position. The difference is measured directly with the driving signal as reference using a lock-in amplifier. This in-phase signal of the LIA is a direct measurement of the changes in


Antimicrobial and mechanical properties of functionalized textile by nanoarchitectured photoinduced Ag@polymer coating
Beilstein J. Nanotechnol. 2023, 14, 95–109, doi:10.3762/bjnano.14.11

- non-bonding doublets of oxygen atoms create steric hindrance and avoid their aggregation. The coating, colorless before irradiation, becomes progressively pale yellow, orange, then finally brown. Due to the strong increase of AgNPs, the measurement system reaches the detection limit (OD > 3) after 15


Two-step single-reactor synthesis of oleic acid- or undecylenic acid-stabilized magnetic nanoparticles by thermal decomposition
Beilstein J. Nanotechnol. 2023, 14, 11–22, doi:10.3762/bjnano.14.2

- isomeric shift resulting from the monopolar electric interaction is very sensitive to the valence states of Fe. Taking into account the characteristic measurement time of 57Fe Mössbauer spectroscopy, estimated at 10−8 s at the Larmor frequency, the ultrafine structure of magnetite at 300 K (and above the
- acceleration. The velocity of the source was calibrated using α-Fe as the standard at RT. The measurement was performed on solid pellets made of dried nanoparticles containing approx. 5 mg Fe/cm2. The Mössbauer spectra were fitted using the MOSFIT program (the Modular Open Source Fitter for Transients, a


Electrical and optical enhancement of ITO/Mo bilayer thin films via laser annealing
Beilstein J. Nanotechnol. 2022, 13, 1589–1595, doi:10.3762/bjnano.13.133

- transmittance spectra of the as-deposited and annealed ITO/Mo bilayer structure thin films. The measurement was taken in the wavelength range of 300–800 nm. The as-deposited sample shows the lowest optical transmittance with an average close to 80% at a wavelength of 550 nm. The annealed samples exhibit an


From a free electron gas to confined states: A mixed island of PTCDA and copper phthalocyanine on Ag(111)
Beilstein J. Nanotechnol. 2022, 13, 1572–1577, doi:10.3762/bjnano.13.131

- spectroscopy experiments [6][7][8], and has been studied with density functional theory (DFT) [9][10]. Previous work [11] has used dI/dV spectroscopy as a measurement of the density of electronic states [12] and identified this interface state starting at 0.6 eV. One characteristic of a two-dimensional


Utilizing the surface potential of a solid electrolyte region as the potential reference in Kelvin probe force microscopy
Beilstein J. Nanotechnol. 2022, 13, 1558–1563, doi:10.3762/bjnano.13.129

- solid electrolyte with respect to the Li reference electrode. The sample for the CV measurement was prepared separately from the sample used for the KPFM measurement. The potential range was 0 to 5 V (vs Li/Li+). Initially, the potential was set to open-circuit voltage (3.2 V vs Li/Li+) and swept in the
- toward the negatively biased electrode, resulting in an ionic current flow. The ion current decays with time and, in principle, becomes zero when the electric field in the solid electrolyte is shielded by the accumulation and depletion of Li ions. Before starting each KPFM measurement, we waited 2–4 min
- measurement The KPFM measurements were performed at room temperature using a commercial atomic force microscope (Park Systems, NX10) placed in an Ar flow glove box (O2: <1 ppm, H2O: <1 ppm). We used Cr/Pt-coated Si cantilevers (Budget Sensors, Multi75E-G) with a nominal resonance frequency of 75 kHz and a


Photoelectrochemical water oxidation over TiO2 nanotubes modified with MoS2 and g-C3N4
Beilstein J. Nanotechnol. 2022, 13, 1541–1550, doi:10.3762/bjnano.13.127

- each activity measurement. The Tafel slope is considered as an important parameter to evaluate the PEC activity in water splitting. A smaller Tafel slope value indicates a more rapid increase in the reaction rate of the electrode. Figure 6b shows the high Tafel slope values of the individual materials


Non-stoichiometric magnetite as catalyst for the photocatalytic degradation of phenol and 2,6-dibromo-4-methylphenol – a new approach in water treatment
Beilstein J. Nanotechnol. 2022, 13, 1531–1540, doi:10.3762/bjnano.13.126

- becomes negative at pH values above the PZC. As expected, the curves of the final pH as a function of the initial pH of the catalysts in 0.1 mol·L−1 NaCl show an intersection with the line y = x, which corresponds to the PZC of the sample (Figure 4). The measurement of the PZC exhibits a higher pHPZC


A TiO2@MWCNTs nanocomposite photoanode for solar-driven water splitting
Beilstein J. Nanotechnol. 2022, 13, 1520–1530, doi:10.3762/bjnano.13.125

- performed in 0.1 M KCl solution at a scan rate of 50 mV·s−1 with a three-electrode cell using Ag/AgCl and Pt wire as the reference and counter electrodes, respectively. The prepared TiO2@MWCNTs electrode is used as the working electrode. The measurement is carried out in a lab under 350 ± 10 lux of
- -electrode cell, including the photoanode and a Cu-based cathode. Hydrogen evolution at the cathode and the solar irradiance is recorded at 60 min intervals. The prepared photoelectrochemical electrode is wholly immersed in KOH electrolyte before each photoelectrochemical measurement. Only one electrode


Hydroxyapatite–bioglass nanocomposites: Structural, mechanical, and biological aspects
Beilstein J. Nanotechnol. 2022, 13, 1490–1504, doi:10.3762/bjnano.13.123

- and porosity measurements The measurement method is the buoyancy technique, which utilizes Archimedes' principle: a body immersed in fluid indicates an apparent loss in weight equal to the weight of the fluid it displaces. In order to determine the porosity of the samples a preparation consisting of
- the samples in g, m2 is the mass of the samples in air after boiling in g, and m1 is the mass of the samples in water after boiling in g. The following formula was used for the calculation of the apparent porosity (open porosity), Pa: using the above annotations. The errors of measurement for density
- , voltage (mV), and temperature (°C). The precision of the pH measurement was 10−2. MTT assay The MTT assay was performed on mesenchymal stem cells (MSCs) previously isolated from six-months-old Wistar rat bone marrow, cultured in HiMesoXL™ mesenchymal stem cell expansion medium (HiMedia, India) and stored
Frequency-dependent nanomechanical profiling for medical diagnosis
Beilstein J. Nanotechnol. 2022, 13, 1483–1489, doi:10.3762/bjnano.13.122

- chemical characterization of surfaces ranging from semiconductors and metals to polymers and biological materials [1][2][3][4][5]. In particular, a variety of mechanical property measurement methods have been developed, although most of them are restricted to relatively simple physical descriptions, such
- nanomechanical measurements would require their integration into streamlined strategies for addressing meaningful and far-reaching applications, such that the measurement provides information that is directly applicable, beyond long-term scientific relevance. As has often been proposed, we believe that this may
- ) providing immediate results that can be used to unambiguously evaluate disease progress. It is also necessary that the measurement device only require minimal training on the part of the user, which may be the physician or even the patient (at home). For non-topical tissue measurements, it would be


Structural studies and selected physical investigations of LiCoO2 obtained by combustion synthesis
Beilstein J. Nanotechnol. 2022, 13, 1473–1482, doi:10.3762/bjnano.13.121

- measuring geometry with filtered Cu Kα radiation (λ = 1.5418 Å, U = 40 kV and I = 30 mA). The samples were measured in the range of 10–60°. Measurement steps of 0.02° at a scan rate of 2°/min were used. A 1D strip detector (Dtex250) was used during the analysis. Specific surface area The SSA of LiCoO2 was
- impurities from the surface of the tested material. Adsorption measurements were performed with nitrogen at 77 K. For each sample, an analysis was performed at 15 measurement points in the range of 0.05–0.3 P/P0 (relative pressure). This is the range of the SSA study. Above this range, the trend line bends
- . Hence, the averaging of the measurement results is inaccurate, and the results become unreliable [60]. SEM analysis The morphology of the LiCoO2 crystallites was determined using a scanning electron microscope Auriga CrossBeam Workstation (Carl Zeiss). Cross sections of the fabricated laminates were


