Abstract
A new thermally activated delayed fluorescence (TADF) compound based on a donor–acceptor (D–A) architecture (D = phenoxazine; A = dibenzo[a,j]phenazine) has been developed, and its photophysical properties were characterized. The D–A compound is applicable as an emitting material for efficient organic light-emitting diodes (OLEDs), and its external quantum efficiency (EQE) exceeds the theoretical maximum of those with prompt fluorescent emitters. Most importantly, comparative study of the D–A molecule and its D–A–D counterpart from the viewpoints of the experiments and theoretical calculations revealed the effect of the number of the electron donor on the thermally activated delayed fluorescent behavior.
Graphical Abstract
Introduction
Thermally activated delayed fluorescence (TADF), which was firstly reported in 1961 by Parker and Hatchard [1], is a fundamental photophysical phenomenon that refers to delayed fluorescence radiated from the singlet excited state (S1) as a consequence of a brief detour to a triplet excited state (Tn) [i.e., intersystem crossing (ISC) and reverse intersystem crossing (rISC)]. Since the revisit of TADF in organic light-emitting diodes (OLEDs) by Adachi in 2012 [2], TADF-active compounds have emerged as emitters in high-performance organic light-emitting diodes (OLEDs) [3-8], biological probes [9], photocatalysis [10], and some others [11]. Specifically, TADF-active purely organic compounds allow for achieving a very high external quantum efficiency (EQE) of OLEDs without using precious metals such as Ir and Pt in the emitter. Thus, the development of TADF-active organic compounds, the establishment of materials design through systematic structure–property relationship (SPR), and the understanding of the TADF mechanism are highly important tasks in this research field.
The singlet–triplet energy splitting between the S1 and T1 states (ΔEST) and spin–orbit coupling (SOC) play key roles in manifesting the TADF character of an organic compound. To boost the rISC process, ideally, the ΔEST is zero or even negative [12,13], while the SOC is as large as possible. One of the promising molecular design strategies to meet the above-mentioned criteria involves a highly twisted (D)n–(A)m (D: electron donor; A: electron acceptor) system, in which efficient intramolecular charge transfer (ICT) occurs in the singlet excited state (1CT). An efficient rISC can be mediated by mixing the 1CT state with a locally excited triplet state on the donor (3LED) or the acceptor (3LEA) through spin–vibronic coupling [14] or non-Condon effects [15,16].
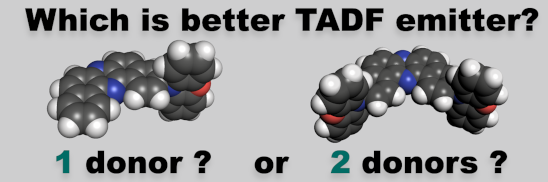
In 2016, we developed a twisted D–A–D compound POZ-DBPHZ (Figure 1) that exhibits efficient orange-to-red TADF [17], and the OLEDs fabricated with POZ-DBPHZ achieved a high EQE up to 16%. However, the role of the number of donors and molecular symmetry in the TADF character of POZ-DBPHZ remained unexplored, due to the lack of a synthetic method to the asymmetric D–A structure. Herein, we report the synthesis of a new asymmetric D–A compound 1 (Figure 1) as a TADF emitter and its detailed physical properties. Moreover, the developed emitter’s performance was evaluated in an OLED device. To clarify the influence of the donor number and structural symmetry on the physicochemical properties of the DBPHZ-cored D–A system, the properties of D–A compound 1 were compared with those of POZ-DBPHZ. Theoretical calculations further support the impact of the donor numbers in the DBPHZ-cored D–A system.
![[1860-5397-18-48-1]](/bjoc/content/figures/1860-5397-18-48-1.svg?scale=2.0&max-width=1024&background=FFFFFF)
Figure 1: Chemical structures of 1 and POZ-DBPHZ.
Figure 1: Chemical structures of 1 and POZ-DBPHZ.
Results and Discussion
Synthesis of materials
To synthesize the designed D–A molecule 1, an asymmetric dibenzophenazine electrophile was required. Recently, we have established a synthetic method for such a compound, i.e., 3-trifluoromethanesulfonyldibenzo[a,j]phenazine (DBPHZ-OTf in Scheme 1) to prepare linear-type A–D–A–D compounds [18]. Starting from the mono-functionalized compound DBPHZ-OTf, the target compound 1 was successfully synthesized through a Pd-catalyzed Buchwald–Hartwig amination with phenoxazine (POZ) in a good yield as red-brown solid (Scheme 1). The D–A–D counterpart POZ-DBPHZ was synthesized according to the previously reported process [17]. It is noted that the solubility of the D–A compound 1 in organic solvents is lower than that of the D–A–D compound, indicating a more aggregated state of the D–A molecules in the solid state, due to less steric hindrance on the acceptor plane arising from breaking the symmetry. The synthesized compound 1 was fully characterized by 1H and 13C NMR and IR spectroscopy, MS spectrometry as well as elemental analysis (for the detailed data, see Supporting Information File 1).
![[1860-5397-18-48-i1]](/bjoc/content/inline/1860-5397-18-48-i1.svg?scale=2.0&max-width=1024&background=FFFFFF)
Steady-state PL spectra
To reveal the photophysical properties of diluted solutions of compound 1, UV–vis absorption and steady-state photoluminescence (PL) spectra were acquired (Figure 2, and the summary of the properties presented in Table 1). The solutions were prepared with a variety of organic solvents at concentrations of ca. 10−5 M. It is noted that the solubility of 1 in cyclohexane is quite low, and thereby the concentration of the cyclohexane solution and the molar absorption coefficient ε were not determined. As is clearly seen from Figure 2, the absorption spectra were not affected by the dielectric constant of the solvents. In contrast, the emission peaks of the PL spectra drastically red-shifted from cyclohexane (λPL = 502 nm) to toluene (λPL = 608 nm), and no PL was observed in a more polar solvent such as THF and CHCl3 (Figure 2). In addition, the shape of the PL spectrum changed from a vibrationally resolved shape typical of the emission from a locally excited state (1LE) to a Gaussian-type broad one typical to the emission from a charge–transfer excited state (CT). The CT emission was totally quenched in a solvent that is more polar than toluene (Figure 2). These photophysical observations are consistent with those of the D–A–D-type compound POZ-DBPHZ [17], indicating that one D–A pair is sufficient for generating the CT excited state. In comparison with the photophysical properties of the D–A–D compound, the absorption of 1 (λabs = 461 nm) is almost the same as that of POZ-DBPHZ (λabs = 463 nm) [17], while the PL emission peak appeared in a slightly blue-shifted region (λPL = 502 nm) from D–A–D-type compound (λPL = 521 nm for POZ-DBPHZ) in cyclohexane. These data indicate that the effective length of π-conjugation is not affected by the number of donors, probably due to the right D–A dihedral angle for both compounds in the ground state. In contrary, the slight blue-shift of the PL spectra of the D–A compound 1 compared to POZ-DBPHZ reflects the contribution of an additional donor to relaxation of the molecular geometry in the excited state. The photoluminescence quantum yield (ΦPL) of the D–A compound 1 is lower (0.13 in cyclohexane) than that of the D–A–D compound POZ-DBPHZ (0.33) [17], indicating a dominant non-radiative decay of the excited state for the D–A type compound, which was supported by the theoretical calculations (vide infra).
![[1860-5397-18-48-2]](/bjoc/content/figures/1860-5397-18-48-2.png?scale=2.0&max-width=1024&background=FFFFFF)
Figure 2: Steady-state UV–vis absorption (Abs) and photoluminescence (PL) spectra of dilute solutions (c ≈ 10−5 M) of compound 1. The PL spectra were acquired with λex = 340 nm for the cyclohexane solution and λex = 360 nm for solutions in the other solvents.
Figure 2: Steady-state UV–vis absorption (Abs) and photoluminescence (PL) spectra of dilute solutions (c ≈ 10...
Table 1: Summary of steady-state photophysical data of diluted solutions of 1.a
| solvent | λabs (nm) | λPL (nm) | ΦPLb |
| cyclohexanec | 294, 389, 412 | 502 | 0.13 |
| toluene | 296, 393, 415 | 608 | 0.16 |
| THF | 295, 392, 415 | – | <0.01 |
| CHCl3 | 295, 394, 416 | – | <0.01 |
aSolution concentration: 10−5 M; bdetermined with an integrated sphere; csaturated solution was used, due to the low solubility in cyclohexane.
In the solid state, the D–A compound 1 showed an emission at around λem = 560 nm with a very low ΦPL (<0.1) (Figure S1 in Supporting Information File 1). The PL spectrum is similar to that in a CBP host matrix (vide infra). The compound 1 showed an aggregation-induced emission (AIE) behavior in a THF/water system, showing a more red-shifted emission peak at around λem = 600 nm when compared with the as-prepared solid state (Figure S2 in Supporting Information File 1). This indicates that in the as-prepared state and aggregation state the molecular stacking modes should be quite different from each other.
Time-resolved spectroscopic analysis
To investigate the delayed fluorescence behavior of the D–A compound 1, more detailed photophysical studies were performed using a time-resolved spectroscopic technique (Figure 3). Time-resolved photoluminescence (PL) from a blended film (1 wt % of 1 in Zeonex®) at 300 K showed two-components emission consisting of a prompt fluorescence (PF) that decays within the order of nanoseconds and a delayed fluorescence (DF) that decays in the range of micro to milliseconds (Figure 3a). These PF and DF spectra are exactly overlapped with each other (Figure 3b), which indicated that both emissions are radiated from the singlet excited state (S1). Both emission spectra are not well resolved and in a Gaussian-type shape (Figure 2b), suggesting that these emissions have a mixed character of localized (1LE) and charge-transfer state (1CT, Figure 3b). The emission from the T1 state (phosphorescence, PH) at a low temperature (10 K) with the energy of ET1 = 2.26 eV showed a similar spectral shape to the phosphorescence spectra of the acceptor core (DBPHZ) [17]. This would indicate that the T1 state of the D–A compound is localized on the acceptor unit (3LEA). The ΔEST of 1 was found to be 0.11 eV, which is twice larger than that of POZ-DBPHZ in the same matrix (0.06 eV) [17]. These differences are ascribed to the change in electron density on the acceptor and the electron-donating power of POZ. Therefore, gradual increase of electron-donating strength brings T1 energy closer to the acceptor T1 energy and leads to a smaller EST gap. But, the activation energy Ea for the DF process, which was calculated from the Arrhenius plot obtained from the increase of the DF intensity against temperature, was lower for 1 (Ea = 27 meV) when compared to POZ-DBPHZ (Ea = 47 meV, Table 2) in Zeonex®. The directly determined activation energy of the D–A-type compound is half than that of the D–A–D compound, which is in contradiction to the ΔEST value (Table 2). If we support the observation with the DF/PF results that present a stronger TADF property for the mono-substituted derivative 1, the conclusion of misleading ΔEST comparison can be reached. To avoid confusion, a more effective way is to compare only the activation energy of the DF process.
![[1860-5397-18-48-3]](/bjoc/content/figures/1860-5397-18-48-3.png?scale=2.0&max-width=1024&background=FFFFFF)
Figure 3: Time-resolved PL decay profiles (intensity vs delay time) and spectra of 1 in a), b) Zeonex® and c, d) CBP matrix. The energies correspond to the maximum emission peaks.
Figure 3: Time-resolved PL decay profiles (intensity vs delay time) and spectra of 1 in a), b) Zeonex® and c,...
Table 2: Summary of the general photophysical properties of compound 1.
| Compd. | host | λem [nm]a | ΦPLb | τPF [ns]c | τDF [μs]d | DF/PFe | Ea [eV]f | S1 [eV]g | T1 [eV]g | ΔEST [eV]h |
| 1 | Zeonex® | 524 | 32.5 | 15.37 ± 1.35 | 6.9 ± 0.43 | 5.01 | 0.028 | 2.37 | 2.26 | 0.11 |
| POZ-DBPHZ | Zeonex® | 530 | 29.5 | 10.23 ± 0.16 | 26.4 ± 1.50 | 4.72 | 0.047 | 2.48 | 2.40 | 0.08 |
| 1 | CBP | 565 | 68.5 | 16.11 ± 0.38 | 2.96 ± 0.18 | 0.98 | 0.015 | 2.19 | 2.08 | 0.11 |
| POZ-DBPHZ | CBP | 595 | 79.0 | 2.7 ± 0.21 | 0.47 ± 0.04 | 1.94 | 0.019 | 2.28 | 2.26 | 0.02 |
aThe maximum wavelength of photoluminescence spectra; bphotoluminescence quantum yield in degassed; cprompt fluorescence lifetime; ddelayed fluorescence lifetime; ethe ratio of delayed fluorescence (DF) to prompt fluorescence (PF); factivation energy of the triplet to singlet transfer (error ± 0.01 eV); gsinglet and triplet energy (error ± 0.03 eV); henergy splitting (error ± 0.05 eV). All parameters estimated at 300 K.
The time-resolved spectroscopic analysis of the emitter (10 wt % 1) in an OLED matrix, 4,4’-bis(N-carbazolyl)-1,1’-biphenyl (CBP), revealed that the emission at 300 K yields a weaker DF when compared to the Zeonex® matrix (Figure 3c). In addition, the emission in CBP was more complicated, due to the emission spectra that move around with delay time (Figure S3, Supporting Information File 1). At 5.1 ns, the emission peak from PF was observed in a red-shifted region (by approximately 41 nm) than that observed in Zeonex® (λem = 524 nm) (Figure S3a in Supporting Information File 1). Thereafter, there was a monotonic red shift in the emission peak and the gradual increment during the delay time from 0 ns to 150 ns, and the largest red-shifted spectrum was found at 613 nm (at 150 ns) (Figure S3a, Supporting Information File 1). From 168 ns to 5 μs delay time, the emission peak plateaued at around λem = 607 nm (Figure S3b, Supporting Information File 1), then from 5 μs to 32 μs, a significant hypsochromic shift of the emission peak was observed down to 560 nm, and the emission peak stayed at this value (Figure S3c, Supporting Information File 1). This behavior brings the proposition that the PF in the nanosecond range based on a CT character with a little contribution from the 1LE state have inhomogeneous energies. Firstly, the 1LE state decays, and then decays of the lower-energy excited states follow. The triplet energy level of 1 is 2.08 eV, which is lower than that in Zeonex® (2.26 eV). A closer inspection of the transient curves and inset spectra at microsecond delays let us notice that the spectra shift slightly to lower energies (Figure S3 in Supporting Information File 1). This behavior is not unusual in CT-based emitters and can be explained by local interactions between the dipole moment of the host and the excited state dipole moment of the TADF molecule [19].
The activation energy for the TADF process of the D–A compound 1 is as low as 15 meV. Nevertheless, the TADF efficiency of the D–A compound in CBP is much lower when compared to that in Zeonex® and its D–A–D counterpart (Table 2). First, the DF/PF ratio is much smaller in CBP than in Zeonex®, suggesting a smaller triplet contribution to the overall emission. If we compare compound 1 with the previously studied D–A–D compound, the ΦPL is slightly lower, but the highest impact is related with DF/PF, where POZ-DBPHZ has the twice higher value which in total should give a much lower performance in the device for 1.
Thermal stability
To fabricate the OLED devices by thermal evaporation techniques, a high thermal stability is required. To evaluate the effect of the donor number on the thermal stability of the DBPHZ-cored D–A type emitter, the degradation temperature Td (5 wt % loss) was investigated by thermogravimetric analysis (TGA), which showed a high Td (5 wt % loss under N2 atmosphere) of compound 1 (342 °C) (Figure S4a in Supporting Information File 1), which is high enough for a thermal deposition process. However, when compared with the D–A–D counterpart, the Td of 1 is much lower (by 111 °C) than that of POZ-DBPHZ (453 °C) [17]. These data would support that the increase in the sterically hindered donors in emitting molecule suppress intermolecular contact to enhance the thermal stability.
OLED fabrication and characterization
The OLED device was fabricated and characterized in the CBP host (Figure 4). The HOMO–LUMO values obtained from the electrochemical measurement (Figure S5 in Supporting Information File 1) were used to evaluate whether the emitter works in a previously analyzed device structure [17]. The OLED device structure applied the following configuration: –ITO/NPB [N,N’-di(1-naphthyl)-N,N’-diphenyl-(1,1’-biphenyl)-4,4’-diamine] (40 nm)/10% of 1 in CBP (20 nm)/TPBi [2,2’,2’’-(1,3,5- benzinetriyl)-tris(1-phenyl-1H-benzimidazole)] (20 nm)/BCP (bathocuproine)] (20 nm)/LiF (1 nm)/Al (100 nm)– (Figure 4). The external quantum efficiency (EQE) was measured at around 11.4%, where the device fabricated with the previously studied D–A–D compound POZ-DBPHZ showed 16%. As for luminance, a high luminance of 27,060 cd/m2 was obtained, which is slightly lower than that we previously reported (>35,000 cd/m2) [17]. A positive aspect about the device fabricated with compound 1 is the lower efficiency roll-off when compared with the previously studied D–A–D emitter. As the result, the efficiency is higher for the D–A compound 1 above 10,000 cd/m2, and at the luminance, the EQE was kept around 10%, whereas in the case of doubly donor-substituted compound POZ-DBPHZ, the EQE dropped below 10% [17].
![[1860-5397-18-48-4]](/bjoc/content/figures/1860-5397-18-48-4.png?scale=2.0&max-width=1024&background=FFFFFF)
Figure 4: The characteristics of the OLED devices: a) electroluminescence spectra; b) current density-bias characteristics; c) EQE–current density characteristics; d) luminance–current density characteristics.
Figure 4: The characteristics of the OLED devices: a) electroluminescence spectra; b) current density-bias ch...
Theoretical calculations
We performed electronic structure calculations on both the D–A (1) and D–A–D (POZ-DBPHZ) compounds to understand better their respective TADF mechanisms and the efficacy of introducing two electronic donors on the acceptor unit. The calculations employed density functional theory (DFT) with the long-range corrected ωPBE functional and the 6-31G(d,p) basis set. Tuning of the range separation parameter was performed for both molecules [20] with the results collected in Table S1 (Supporting Information File 1). The Tamm–Dancoff (TDA) approximation was used in all excited state calculations and solvent effects were included by means of the polarizable continuum model (PCM) associated with a perturbative state specific solvation method using toluene as solvent. The photophysics of both molecules was analyzed using a unified approach for photophysical rate calculations that employs the nuclear ensemble method as implemented in the NEMO software [21,22] interfaced with the QChem 5.0 program suite [23]. A total of 500 geometries were sampled for each molecule and for each relevant electronic state. From these calculations, emission spectra were computed along with fluorescence, phosphorescence, and ISC rates, providing us insight into the mechanism behind the photophysical behavior of the molecules under analysis in this work.
Taking fluorescence properties as starting point, the simulations point out considerable similarity between the spectra of the D–A and D–A–D compounds. As shown in Figure S6 (Supporting Information File 1), the calculated fluorescence peaks lie at 510 nm and 505 nm for the D–A and D–A–D compounds, respectively. These results agree very well with those obtained from the measurement in Zeonex® (Table 2), which has a similar dielectric constant as toluene (≈2.3), the solvent used in the calculations. A comparison with results from steady-state PL spectra (Table 1), however, show that the predicted peak matches measurements made with cyclohexane, but appear to be blue shifted with respect to measurements in toluene. Considering that cyclohexane has only a slightly lower dielectric constant (≈2.0) than toluene, it is reasonable that calculations would produce similar predictions, which makes the red-shifted experimental emission in toluene more surprising. In addition to similarities in fluorescence energy, the D–A (1) and D–A–D (POZ-DBPHZ) compounds share very close calculated fluorescence rates (2.2 × 10⁷ s−1 and 1.8 × 10⁷ s−1, respectively) which translate into prompt fluorescence lifetimes of 45 ns and 54 ns, respectively. These values are in the same order of magnitude as the experimental lifetimes shown in Table 2, further indicating the appropriateness of the theoretical approach.
From the first singlet excited state, we have estimated ISC rates for both molecules. Table S5 in Supporting Information File 1 shows the calculated ISC rates from S1 to the first five triplet states. For both molecules, the estimated rate values are comparable or larger than those for fluorescence, which makes the ISC process competitive. Comparing all available processes from the S1 state, we are able to estimate probabilities for each transition (detailed in Supporting Information File 1, Table S8 and Table S9). In the case of the D–A compound 1, the singlet population is expected to split mostly into T1 (33%) and T2 states (42%), with about 2% probability expected for prompt fluorescence. On the other hand, for the D–A–D compound POZ-DBPHZ, transitions to T1 display 48% probability whereas fluorescence has around 4%. The remaining probabilities are mostly distributed between transfers to T2 and T3 with about 20% each.
Transfers to higher lying triplet states may end up relaxing to the lowest triplet state by means of internal conversion. In this sense, it is important to look into the energy gaps between triplet states of both molecules. Considering the average gaps taken from all the conformations sampled in the nuclear ensemble from the T1 state geometry, we obtain T1 to T2 gaps of approximately 0.4 eV for both compounds. This significant value suggests the possibility of the T2 population not necessarily decaying to T1 instantly. In contrast, the average energy difference between two adjacent triplet levels above T2 is approximately 0.1 eV for both molecules, which indicates that internal conversion should be very efficient.
Following the above observations, we estimated rISC rates from the first two triplet states of both molecules and the results are collected in Table S6 and Table S7 (Supporting Information File 1). It is worth noting, that the D–A–D compound POZ-DBPHZ presents rISC rates that are larger than those of its D–A counterpart 1 by roughly one order of magnitude, which suggests that the addition of an extra donor unit is able to improve the TADF efficiency. For both triplet states, rISC transfers to S1 are overwhelmingly larger than those to higher singlet states. Similarly, these transfer rates to S1 are orders of magnitude larger than estimated phosphorescence rates (Table S3 in Supporting Information File 1). The analysis of the probabilities associated with each transfer mechanism from T1 and T2 (shown in Table S8 and Table S9 of Supporting Information File 1) indicates that the expected depopulation mechanism for the first two triplet states is dominated by an rISC back to the first excited singlet state, which is responsible for the TADF behavior observed in both molecules.
The rate estimates finally allow us to paint a picture of the TADF mechanism of the two compounds. This is schematically shown in Figure 5, along with the calculated rates for each of the represented processes. In addition, we present natural transition orbitals (NTOs) for the three excited states most relevant for the TADF mechanism. These NTOs demonstrate the similar CT character of the S1 state of both compounds, which helps explain their coinciding fluorescence spectra. Finally, the NTOs for the triplet states indicate a possible source for the difference in their TADF efficiencies. Whereas the first two triplet states of the D–A compound 1 correspond mostly to excitations localized in the acceptor fragment, the T1 and T2 states on the D–A–D molecule POZ-DBPHZ display a mixed CT/LE character. It is known that having two states with different electronic characters allows for larger spin–orbit couplings, so we would expect these couplings to be larger in the case of the D–A molecule when comparing with the D–A–D compound. This is indeed the case, as the average spin–orbit coupling for the T1 to S1 transition in the D–A compound 1 is 0.462 meV, whereas for the D–A–D compound POZ-DBPHZ it is 0.177 meV. However, the average energy gap taken from all geometries in the nuclear ensemble for this transition is 0.37 eV for the D–A–D compound and 0.71 eV for the D–A molecule. As such, the higher similarity in electronic character between the singlet and triplet states of the D–A–D molecule was enough to decrease the average energy gap without compromising significantly the spin–orbit coupling, resulting in an overall better TADF performance.
![[1860-5397-18-48-5]](/bjoc/content/figures/1860-5397-18-48-5.svg?scale=2.0&max-width=1024&background=FFFFFF)
Figure 5: Schematics of the TADF mechanisms along with NTOs for the relevant electronic states for a) D–A compound 1 and b) D–A–D compound POZ-DBPHZ.
Figure 5: Schematics of the TADF mechanisms along with NTOs for the relevant electronic states for a) D–A com...
Conclusion
In conclusion, we have developed a new D–A-type TADF compound and investigated its physicochemical properties for comparison with the corresponding D–A–D analogue. The number of donor units has no effect on the absorption, due to the highly twisted D–A(–D) structures, while an additional donor unit led to a slight red shift in photoluminescence by the stabilization of the charge-transfer singlet excited states (1CT). Most importantly, the additional donor unit not only lowers the 1CT energy but also is bringing the T1 energy to the approximation of the 3LEA energy, leading to a narrower singlet–triplet energy gap and a more efficient TADF process, when compared with the mono-donor-substituted compound. On one hand, the comparison of the activation energy for the TADF process for the two compounds gave an inversed order of energy. In addition, the one-less number of donor units in the molecular scaffold led to lower solubility in organic solvents and thermal stability, presumably due to the less steric hindrance around the π-extended conjugated acceptor unit with the unsymmetric molecule structure. The OLEDs fabricated with the D–A emitter achieved a good EQE up to 11%, which exceeds the theoretical maximum (ca. 5%) of prompt fluorescent emitter-based OLEDs. The additional donor gave a better EQE of the OLED device than that fabricated with the D–A compound, due to a less efficient TADF process. Taken together the experimental and theoretical calculations, the role of the additional donor unit in the TADF mechanism is boosting the rISC process by balancing the singlet–triplet energy gap and spin–orbit coupling. The results showcased herein would allow for designing efficient TADF emitters more flexibly in the future.
Supporting Information
| Supporting Information File 1: General information, synthetic procedures, spectral data, photophysical data, and theoretical calculation data. | ||
| Format: PDF | Size: 965.8 KB | Download |
Funding
Y.T. acknowledges a Grant-in-Aid for Scientific Research on Innovative Area “Aquatic Functional Materials: Creation of New Materials Science for Environment-Friendly and Active Functions” (JSPS KAKENHI Grant Number JP19H05716) from the MEXT (Ministry of Education, Culture, Science and Technology, Japan), a Grant-in-Aid for Scientific Research (B) (JSPS KAKENHI Grant Number JP20H02813), and the Continuation Grants for Young Researchers from the Asahi Glass Foundation. Y.T. and S.M. acknowledge NIPPOH CHEMICALS for supplying N,N-diiodo-5,5-dimethylhydantoin (DIH). P. de S. and L. E. de S. acknowledge support by a research grant (00028053) from VILLUM FONDEN. Y.T., P.G. A.D. P.Z.C., P. de S. and P.D. acknowledge the EU’s Horizon 2020 for funding the OCTA project under grant agreement No 778158. Research work supported from the funds for science in 2018–2022 allocated to the implementation of an international co-financed project by the Polish Ministry of Education and Science. P.D. acknowledges the Polish National Science Centre funding, grant no. 2018/31/B/ST5/03085. P.G. acknowledges the supporting awards from the Silesian University of Technology (BKM-532/RCH4/2021). P.D., P.G., A.D. and P.Z.C. acknowledge the supporting actions from EU's Horizon 2020 ERA-Chair project ExCEED, grant agreement No 952008.
References
-
Parker, C. A.; Hatchard, C. G. Trans. Faraday Soc. 1961, 57, 1894–1904. doi:10.1039/tf9615701894
Return to citation in text: [1] -
Uoyama, H.; Goushi, K.; Shizu, K.; Nomura, H.; Adachi, C. Nature 2012, 492, 234–238. doi:10.1038/nature11687
Return to citation in text: [1] -
Tao, Y.; Yuan, K.; Chen, T.; Xu, P.; Li, H.; Chen, R.; Zheng, C.; Zhang, L.; Huang, W. Adv. Mater. (Weinheim, Ger.) 2014, 26, 7931–7958. doi:10.1002/adma.201402532
Return to citation in text: [1] -
Yang, Z.; Mao, Z.; Xie, Z.; Zhang, Y.; Liu, S.; Zhao, J.; Xu, J.; Chi, Z.; Aldred, M. P. Chem. Soc. Rev. 2017, 46, 915–1016. doi:10.1039/c6cs00368k
Return to citation in text: [1] -
Liu, Y.; Li, C.; Ren, Z.; Yan, S.; Bryce, M. R. Nat. Rev. Mater. 2018, 3, 18020. doi:10.1038/natrevmats.2018.20
Return to citation in text: [1] -
Huang, T.; Jiang, W.; Duan, L. J. Mater. Chem. C 2018, 6, 5577–5596. doi:10.1039/c8tc01139g
Return to citation in text: [1] -
Chen, X.-K.; Kim, D.; Brédas, J.-L. Acc. Chem. Res. 2018, 51, 2215–2224. doi:10.1021/acs.accounts.8b00174
Return to citation in text: [1] -
Nakanotani, H.; Tsuchiya, Y.; Adachi, C. Chem. Lett. 2021, 50, 938–948. doi:10.1246/cl.200915
Return to citation in text: [1] -
Nguyen, V.-N.; Kumar, A.; Lee, M. H.; Yoon, J. Coord. Chem. Rev. 2020, 425, 213545. doi:10.1016/j.ccr.2020.213545
Return to citation in text: [1] -
Candish, L.; Collins, K. D.; Cook, G. C.; Douglas, J. J.; Gómez-Suárez, A.; Jolit, A.; Keess, S. Chem. Rev. 2022, 122, 2907–2980. doi:10.1021/acs.chemrev.1c00416
Return to citation in text: [1] -
Data, P.; Takeda, Y. Chem. – Asian J. 2019, 14, 1613–1636. doi:10.1002/asia.201801791
Return to citation in text: [1] -
de Silva, P. J. Phys. Chem. Lett. 2019, 10, 5674–5679. doi:10.1021/acs.jpclett.9b02333
Return to citation in text: [1] -
Wagner, J.; Zimmermann Crocomo, P.; Kochman, M. A.; Kubas, A.; Data, P.; Lindner, M. Angew. Chem., Int. Ed. 2022, in press. doi:10.1002/anie.202202232
Return to citation in text: [1] -
Im, Y.; Kim, M.; Cho, Y. J.; Seo, J.-A.; Yook, K. S.; Lee, J. Y. Chem. Mater. 2017, 29, 1946–1963. doi:10.1021/acs.chemmater.6b05324
Return to citation in text: [1] -
de Silva, P.; Kim, C. A.; Zhu, T.; Van Voorhis, T. Chem. Mater. 2019, 31, 6995–7006. doi:10.1021/acs.chemmater.9b01601
Return to citation in text: [1] -
de Sousa, L. E.; de Silva, P. ChemRxiv 2022. doi:10.26434/chemrxiv-2022-pq978
Return to citation in text: [1] -
Data, P.; Pander, P.; Okazaki, M.; Takeda, Y.; Minakata, S.; Monkman, A. P. Angew. Chem., Int. Ed. 2016, 55, 5739–5744. doi:10.1002/anie.201600113
Return to citation in text: [1] [2] [3] [4] [5] [6] [7] [8] [9] [10] [11] -
Izumi, S.; Higginbotham, H. F.; Nyga, A.; Stachelek, P.; Tohnai, N.; de Silva, P.; Data, P.; Takeda, Y.; Minakata, S. J. Am. Chem. Soc. 2020, 142, 1482–1491. doi:10.1021/jacs.9b11578
Return to citation in text: [1] -
Dias, F. B.; Penfold, T. J.; Monkman, A. P. Methods Appl. Fluoresc. 2017, 5, 012001. doi:10.1088/2050-6120/aa537e
Return to citation in text: [1] -
Stein, T.; Kronik, L.; Baer, R. J. Am. Chem. Soc. 2009, 131, 2818–2820. doi:10.1021/ja8087482
Return to citation in text: [1] -
de Sousa, L. E.; de Silva, P. J. Chem. Theory Comput. 2021, 17, 5816–5824. doi:10.1021/acs.jctc.1c00476
Return to citation in text: [1] -
NEMO, Version 0.2.0; de Sousa, L. E., https://github.com/LeonardoESousa/NEMO.
Return to citation in text: [1] -
Shao, Y.; Gan, Z.; Epifanovsky, E.; Gilbert, A. T. B.; Wormit, M.; Kussmann, J.; Lange, A. W.; Behn, A.; Deng, J.; Feng, X.; Ghosh, D.; Goldey, M.; Horn, P. R.; Jacobson, L. D.; Kaliman, I.; Khaliullin, R. Z.; Kuś, T.; Landau, A.; Liu, J.; Proynov, E. I.; Rhee, Y. M.; Richard, R. M.; Rohrdanz, M. A.; Steele, R. P.; Sundstrom, E. J.; Woodcock, H. L., III; Zimmerman, P. M.; Zuev, D.; Albrecht, B.; Alguire, E.; Austin, B.; Beran, G. J. O.; Bernard, Y. A.; Berquist, E.; Brandhorst, K.; Bravaya, K. B.; Brown, S. T.; Casanova, D.; Chang, C.-M.; Chen, Y.; Chien, S. H.; Closser, K. D.; Crittenden, D. L.; Diedenhofen, M.; DiStasio, R. A., Jr.; Do, H.; Dutoi, A. D.; Edgar, R. G.; Fatehi, S.; Fusti-Molnar, L.; Ghysels, A.; Golubeva-Zadorozhnaya, A.; Gomes, J.; Hanson-Heine, M. W. D.; Harbach, P. H. P.; Hauser, A. W.; Hohenstein, E. G.; Holden, Z. C.; Jagau, T.-C.; Ji, H.; Kaduk, B.; Khistyaev, K.; Kim, J.; Kim, J.; King, R. A.; Klunzinger, P.; Kosenkov, D.; Kowalczyk, T.; Krauter, C. M.; Lao, K. U.; Laurent, A. D.; Lawler, K. V.; Levchenko, S. V.; Lin, C. Y.; Liu, F.; Livshits, E.; Lochan, R. C.; Luenser, A.; Manohar, P.; Manzer, S. F.; Mao, S.-P.; Mardirossian, N.; Marenich, A. V.; Maurer, S. A.; Mayhall, N. J.; Neuscamman, E.; Oana, C. M.; Olivares-Amaya, R.; O’Neill, D. P.; Parkhill, J. A.; Perrine, T. M.; Peverati, R.; Prociuk, A.; Rehn, D. R.; Rosta, E.; Russ, N. J.; Sharada, S. M.; Sharma, S.; Small, D. W.; Sodt, A.; Stein, T.; Stück, D.; Su, Y.-C.; Thom, A. J. W.; Tsuchimochi, T.; Vanovschi, V.; Vogt, L.; Vydrov, O.; Wang, T.; Watson, M. A.; Wenzel, J.; White, A.; Williams, C. F.; Yang, J.; Yeganeh, S.; Yost, S. R.; You, Z.-Q.; Zhang, I. Y.; Zhang, X.; Zhao, Y.; Brooks, B. R.; Chan, G. K. L.; Chipman, D. M.; Cramer, C. J.; Goddard, W. A., III; Gordon, M. S.; Hehre, W. J.; Klamt, A.; Schaefer, H. F., III; Schmidt, M. W.; Sherrill, C. D.; Truhlar, D. G.; Warshel, A.; Xu, X.; Aspuru-Guzik, A.; Baer, R.; Bell, A. T.; Besley, N. A.; Chai, J.-D.; Dreuw, A.; Dunietz, B. D.; Furlani, T. R.; Gwaltney, S. R.; Hsu, C.-P.; Jung, Y.; Kong, J.; Lambrecht, D. S.; Liang, W.; Ochsenfeld, C.; Rassolov, V. A.; Slipchenko, L. V.; Subotnik, J. E.; Van Voorhis, T.; Herbert, J. M.; Krylov, A. I.; Gill, P. M. W.; Head-Gordon, M. Mol. Phys. 2015, 113, 184–215. doi:10.1080/00268976.2014.952696
Return to citation in text: [1]
| 1. | Parker, C. A.; Hatchard, C. G. Trans. Faraday Soc. 1961, 57, 1894–1904. doi:10.1039/tf9615701894 |
| 10. | Candish, L.; Collins, K. D.; Cook, G. C.; Douglas, J. J.; Gómez-Suárez, A.; Jolit, A.; Keess, S. Chem. Rev. 2022, 122, 2907–2980. doi:10.1021/acs.chemrev.1c00416 |
| 17. | Data, P.; Pander, P.; Okazaki, M.; Takeda, Y.; Minakata, S.; Monkman, A. P. Angew. Chem., Int. Ed. 2016, 55, 5739–5744. doi:10.1002/anie.201600113 |
| 9. | Nguyen, V.-N.; Kumar, A.; Lee, M. H.; Yoon, J. Coord. Chem. Rev. 2020, 425, 213545. doi:10.1016/j.ccr.2020.213545 |
| 17. | Data, P.; Pander, P.; Okazaki, M.; Takeda, Y.; Minakata, S.; Monkman, A. P. Angew. Chem., Int. Ed. 2016, 55, 5739–5744. doi:10.1002/anie.201600113 |
| 3. | Tao, Y.; Yuan, K.; Chen, T.; Xu, P.; Li, H.; Chen, R.; Zheng, C.; Zhang, L.; Huang, W. Adv. Mater. (Weinheim, Ger.) 2014, 26, 7931–7958. doi:10.1002/adma.201402532 |
| 4. | Yang, Z.; Mao, Z.; Xie, Z.; Zhang, Y.; Liu, S.; Zhao, J.; Xu, J.; Chi, Z.; Aldred, M. P. Chem. Soc. Rev. 2017, 46, 915–1016. doi:10.1039/c6cs00368k |
| 5. | Liu, Y.; Li, C.; Ren, Z.; Yan, S.; Bryce, M. R. Nat. Rev. Mater. 2018, 3, 18020. doi:10.1038/natrevmats.2018.20 |
| 6. | Huang, T.; Jiang, W.; Duan, L. J. Mater. Chem. C 2018, 6, 5577–5596. doi:10.1039/c8tc01139g |
| 7. | Chen, X.-K.; Kim, D.; Brédas, J.-L. Acc. Chem. Res. 2018, 51, 2215–2224. doi:10.1021/acs.accounts.8b00174 |
| 8. | Nakanotani, H.; Tsuchiya, Y.; Adachi, C. Chem. Lett. 2021, 50, 938–948. doi:10.1246/cl.200915 |
| 17. | Data, P.; Pander, P.; Okazaki, M.; Takeda, Y.; Minakata, S.; Monkman, A. P. Angew. Chem., Int. Ed. 2016, 55, 5739–5744. doi:10.1002/anie.201600113 |
| 2. | Uoyama, H.; Goushi, K.; Shizu, K.; Nomura, H.; Adachi, C. Nature 2012, 492, 234–238. doi:10.1038/nature11687 |
| 17. | Data, P.; Pander, P.; Okazaki, M.; Takeda, Y.; Minakata, S.; Monkman, A. P. Angew. Chem., Int. Ed. 2016, 55, 5739–5744. doi:10.1002/anie.201600113 |
| 15. | de Silva, P.; Kim, C. A.; Zhu, T.; Van Voorhis, T. Chem. Mater. 2019, 31, 6995–7006. doi:10.1021/acs.chemmater.9b01601 |
| 16. | de Sousa, L. E.; de Silva, P. ChemRxiv 2022. doi:10.26434/chemrxiv-2022-pq978 |
| 18. | Izumi, S.; Higginbotham, H. F.; Nyga, A.; Stachelek, P.; Tohnai, N.; de Silva, P.; Data, P.; Takeda, Y.; Minakata, S. J. Am. Chem. Soc. 2020, 142, 1482–1491. doi:10.1021/jacs.9b11578 |
| 14. | Im, Y.; Kim, M.; Cho, Y. J.; Seo, J.-A.; Yook, K. S.; Lee, J. Y. Chem. Mater. 2017, 29, 1946–1963. doi:10.1021/acs.chemmater.6b05324 |
| 17. | Data, P.; Pander, P.; Okazaki, M.; Takeda, Y.; Minakata, S.; Monkman, A. P. Angew. Chem., Int. Ed. 2016, 55, 5739–5744. doi:10.1002/anie.201600113 |
| 12. | de Silva, P. J. Phys. Chem. Lett. 2019, 10, 5674–5679. doi:10.1021/acs.jpclett.9b02333 |
| 13. | Wagner, J.; Zimmermann Crocomo, P.; Kochman, M. A.; Kubas, A.; Data, P.; Lindner, M. Angew. Chem., Int. Ed. 2022, in press. doi:10.1002/anie.202202232 |
| 11. | Data, P.; Takeda, Y. Chem. – Asian J. 2019, 14, 1613–1636. doi:10.1002/asia.201801791 |
| 17. | Data, P.; Pander, P.; Okazaki, M.; Takeda, Y.; Minakata, S.; Monkman, A. P. Angew. Chem., Int. Ed. 2016, 55, 5739–5744. doi:10.1002/anie.201600113 |
| 17. | Data, P.; Pander, P.; Okazaki, M.; Takeda, Y.; Minakata, S.; Monkman, A. P. Angew. Chem., Int. Ed. 2016, 55, 5739–5744. doi:10.1002/anie.201600113 |
| 17. | Data, P.; Pander, P.; Okazaki, M.; Takeda, Y.; Minakata, S.; Monkman, A. P. Angew. Chem., Int. Ed. 2016, 55, 5739–5744. doi:10.1002/anie.201600113 |
| 19. | Dias, F. B.; Penfold, T. J.; Monkman, A. P. Methods Appl. Fluoresc. 2017, 5, 012001. doi:10.1088/2050-6120/aa537e |
| 21. | de Sousa, L. E.; de Silva, P. J. Chem. Theory Comput. 2021, 17, 5816–5824. doi:10.1021/acs.jctc.1c00476 |
| 22. | NEMO, Version 0.2.0; de Sousa, L. E., https://github.com/LeonardoESousa/NEMO. |
| 23. | Shao, Y.; Gan, Z.; Epifanovsky, E.; Gilbert, A. T. B.; Wormit, M.; Kussmann, J.; Lange, A. W.; Behn, A.; Deng, J.; Feng, X.; Ghosh, D.; Goldey, M.; Horn, P. R.; Jacobson, L. D.; Kaliman, I.; Khaliullin, R. Z.; Kuś, T.; Landau, A.; Liu, J.; Proynov, E. I.; Rhee, Y. M.; Richard, R. M.; Rohrdanz, M. A.; Steele, R. P.; Sundstrom, E. J.; Woodcock, H. L., III; Zimmerman, P. M.; Zuev, D.; Albrecht, B.; Alguire, E.; Austin, B.; Beran, G. J. O.; Bernard, Y. A.; Berquist, E.; Brandhorst, K.; Bravaya, K. B.; Brown, S. T.; Casanova, D.; Chang, C.-M.; Chen, Y.; Chien, S. H.; Closser, K. D.; Crittenden, D. L.; Diedenhofen, M.; DiStasio, R. A., Jr.; Do, H.; Dutoi, A. D.; Edgar, R. G.; Fatehi, S.; Fusti-Molnar, L.; Ghysels, A.; Golubeva-Zadorozhnaya, A.; Gomes, J.; Hanson-Heine, M. W. D.; Harbach, P. H. P.; Hauser, A. W.; Hohenstein, E. G.; Holden, Z. C.; Jagau, T.-C.; Ji, H.; Kaduk, B.; Khistyaev, K.; Kim, J.; Kim, J.; King, R. A.; Klunzinger, P.; Kosenkov, D.; Kowalczyk, T.; Krauter, C. M.; Lao, K. U.; Laurent, A. D.; Lawler, K. V.; Levchenko, S. V.; Lin, C. Y.; Liu, F.; Livshits, E.; Lochan, R. C.; Luenser, A.; Manohar, P.; Manzer, S. F.; Mao, S.-P.; Mardirossian, N.; Marenich, A. V.; Maurer, S. A.; Mayhall, N. J.; Neuscamman, E.; Oana, C. M.; Olivares-Amaya, R.; O’Neill, D. P.; Parkhill, J. A.; Perrine, T. M.; Peverati, R.; Prociuk, A.; Rehn, D. R.; Rosta, E.; Russ, N. J.; Sharada, S. M.; Sharma, S.; Small, D. W.; Sodt, A.; Stein, T.; Stück, D.; Su, Y.-C.; Thom, A. J. W.; Tsuchimochi, T.; Vanovschi, V.; Vogt, L.; Vydrov, O.; Wang, T.; Watson, M. A.; Wenzel, J.; White, A.; Williams, C. F.; Yang, J.; Yeganeh, S.; Yost, S. R.; You, Z.-Q.; Zhang, I. Y.; Zhang, X.; Zhao, Y.; Brooks, B. R.; Chan, G. K. L.; Chipman, D. M.; Cramer, C. J.; Goddard, W. A., III; Gordon, M. S.; Hehre, W. J.; Klamt, A.; Schaefer, H. F., III; Schmidt, M. W.; Sherrill, C. D.; Truhlar, D. G.; Warshel, A.; Xu, X.; Aspuru-Guzik, A.; Baer, R.; Bell, A. T.; Besley, N. A.; Chai, J.-D.; Dreuw, A.; Dunietz, B. D.; Furlani, T. R.; Gwaltney, S. R.; Hsu, C.-P.; Jung, Y.; Kong, J.; Lambrecht, D. S.; Liang, W.; Ochsenfeld, C.; Rassolov, V. A.; Slipchenko, L. V.; Subotnik, J. E.; Van Voorhis, T.; Herbert, J. M.; Krylov, A. I.; Gill, P. M. W.; Head-Gordon, M. Mol. Phys. 2015, 113, 184–215. doi:10.1080/00268976.2014.952696 |
| 17. | Data, P.; Pander, P.; Okazaki, M.; Takeda, Y.; Minakata, S.; Monkman, A. P. Angew. Chem., Int. Ed. 2016, 55, 5739–5744. doi:10.1002/anie.201600113 |
| 20. | Stein, T.; Kronik, L.; Baer, R. J. Am. Chem. Soc. 2009, 131, 2818–2820. doi:10.1021/ja8087482 |
| 17. | Data, P.; Pander, P.; Okazaki, M.; Takeda, Y.; Minakata, S.; Monkman, A. P. Angew. Chem., Int. Ed. 2016, 55, 5739–5744. doi:10.1002/anie.201600113 |
| 17. | Data, P.; Pander, P.; Okazaki, M.; Takeda, Y.; Minakata, S.; Monkman, A. P. Angew. Chem., Int. Ed. 2016, 55, 5739–5744. doi:10.1002/anie.201600113 |
© 2022 Izumi et al.; licensee Beilstein-Institut.
This is an open access article licensed under the terms of the Beilstein-Institut Open Access License Agreement (https://www.beilstein-journals.org/bjoc/terms), which is identical to the Creative Commons Attribution 4.0 International License (https://creativecommons.org/licenses/by/4.0). The reuse of material under this license requires that the author(s), source and license are credited. Third-party material in this article could be subject to other licenses (typically indicated in the credit line), and in this case, users are required to obtain permission from the license holder to reuse the material.