Abstract
To achieve precise measurements of small displacements in non-contact atomic force microscopy, it is crucial to control the position of moving parts with high accuracy. This is commonly accomplished by piezo actuators, for instance, in the form of tube piezos for positioning the tip or optics. For their calibration, we propose an approach based on the dynamic response signal from a fiber interferometer used for cantilever displacement detection. The fine-positioning z-piezo of the fiber is calibrated by the analysis of measurements of the dynamic interferometer response signal recorded for various cantilever oscillation amplitudes and varied distances between the cantilever and the fiber end. Furthermore, we demonstrate the cantilever oscillation amplitude calibration under conditions of various amounts of tube piezo contraction and extension. The merits and limits of accuracy for such type of calibration are discussed.
Introduction
Interferometric displacement detection stands as a cornerstone in high-precision techniques employed in cantilever-based atomic force microscopy (AFM), since its early days [1-6]. This method of cantilever displacement detection is specifically well suited for non-contact atomic force microscopy (NC-AFM) operation in an ultrahigh-vacuum (UHV) environment at low temperature and has been developed tremendously over the last three decades [7-12].
In frequency-modulated NC-AFM, the cantilever is kept at oscillation with constant amplitude, yielding an interferometric signal that is a periodic function of time. However, it is generally not a harmonic oscillation due to the convolution of the (quasi)-harmonic oscillation of the cantilever with the spatially modulated light field in the interferometer cavity [13]. Dynamic interferometric signals have been studied in the context of NC-AFM using the interferometric concepts of Michelson and Fabry–Perot interferometers [14,15]. Both interferometers rely on the precise alignment of a single-mode optical fiber delivering the light and receiving the optical signal generated in the optical cavity formed by the cantilever and the fiber end. Controlling and stabilizing the fiber–cantilever distance is of principal importance for the accurate operation of the interferometric detection system [16]. Here, we address the aspect of calibrating the z-motion of the fiber tube piezo [17,18] with high accuracy to ensure full control over the interferometer cavity. Measurements involve the expansion and contraction of the piezo tube by an amount of the order of 100 nm, raising the issues of piezo nonlinearity [19], hysteresis [20], and creep [21]. Therefore, we address systematic errors in tube piezo calibration and explore to what extent the cantilever amplitude calibration [13] is affected by the actual extension or extension history of the tube piezo.
Experimental
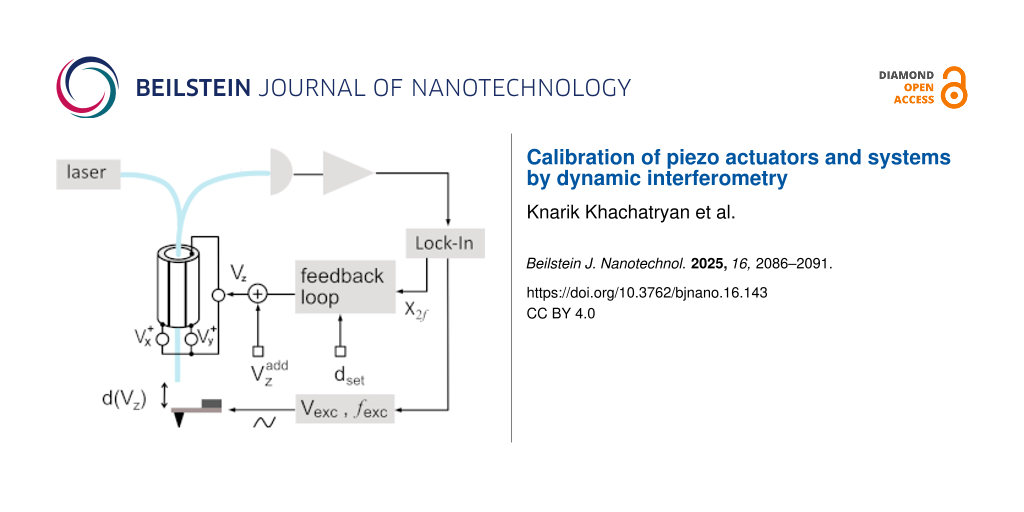
Experiments are performed with a NC-AFM interferometric setup, and the methods of interferometer signal analysis are as described in [13]. The schematic setup of the system electronics and relevant voltages is detailed in Figure 3 of [16]. We investigate the dynamics of the free cantilever excited to oscillation at constant amplitude A and frequency fexc, which is always kept at the fundamental cantilever eigenfrequency f0.
Initially, the interferometer is stabilized so that the working point is the inflection point and center of symmetry of the time-dependent interferometer signal [16], implying that the mean cavity length is d0 = ![[Graphic 1]](/bjnano/content/inline/2190-4286-16-143-i3.svg?max-width=637&scale=1.18182) , where m is an odd integer and λ is the vacuum wavelength of the light used for interferometer operation in a UHV environment. As long as the respective stabilization loop of interferometer alignment is active [16], this adjustment is maintained even in the presence of drift or piezo creep by the automatic adjustment of the voltage applied between the fiber tube piezo inner electrode and the common potential of the tube piezo voltage sources
, where m is an odd integer and λ is the vacuum wavelength of the light used for interferometer operation in a UHV environment. As long as the respective stabilization loop of interferometer alignment is active [16], this adjustment is maintained even in the presence of drift or piezo creep by the automatic adjustment of the voltage applied between the fiber tube piezo inner electrode and the common potential of the tube piezo voltage sources ![[Graphic 2]](/bjnano/content/inline/2190-4286-16-143-i4.svg?max-width=637&scale=1.18182) . To contract or expand the tube piezo, the automatic control loop action is frozen and an appropriate voltage
. To contract or expand the tube piezo, the automatic control loop action is frozen and an appropriate voltage ![[Graphic 3]](/bjnano/content/inline/2190-4286-16-143-i5.svg?max-width=637&scale=1.18182) is added to
is added to ![[Graphic 4]](/bjnano/content/inline/2190-4286-16-143-i6.svg?max-width=637&scale=1.18182) , yielding an incremental change derr of the mean cavity length to
, yielding an incremental change derr of the mean cavity length to ![[Graphic 5]](/bjnano/content/inline/2190-4286-16-143-i7.svg?max-width=637&scale=1.18182) = d0 + derr. This quantity can be extracted from the time-domain interferometric signal by a two-step fit method based on Equation 1 as detailed in [13].
= d0 + derr. This quantity can be extracted from the time-domain interferometric signal by a two-step fit method based on Equation 1 as detailed in [13].
![[2190-4286-16-143-i1]](/bjnano/content/inline/2190-4286-16-143-i1.svg?max-width=590&scale=1.18182)
Here, VDC represents the DC part of the interferometer signal voltage, V0 is the voltage amplitude of the modulated signal, and φ is the phase shift introduced by the electronics in the signal path, which may be determined from the fit. Experiments are performed with laser light of wavelength λ = λvac = 780.41 nm and the excitation frequency is kept at the cantilever eigenfrequency fexc = 169.667 kHz determined at the beginning of the measurements.
The piezoelectric tube (PZT-8, EBL Products Inc., East Hartford, CT, USA) used for fiber positioning is specified with a piezoelectric constant d31 = −0.95 Å/V [22] at 293 K, according to the manufacturer’s data sheet [23]. The extension or contraction of the fiber tube piezo ΔL depends on Vz,f and the dimensions of the tube [24].
![[2190-4286-16-143-i2]](/bjnano/content/inline/2190-4286-16-143-i2.svg?max-width=590&scale=1.18182)
where L and h are the length of the piezo tube and the wall thickness, respectively. According to the widely used convention, the piezo tube is poled so that a negative potential applied to the inner electrode Vz,f < 0 results in an extension ΔL > 0 that translates into a reduction of the cavity length Δd = derr = −ΔL < 0. From d31 and the geometry parameters of the tube piezo (L = 31.8 mm and h = 1.40 mm), we deduce a nominal fiber tube piezo calibration factor of ![[Graphic 6]](/bjnano/content/inline/2190-4286-16-143-i8.svg?max-width=637&scale=1.18182) = −2.15 nm/V relating the extension or contraction ΔL of the tube piezo to the applied voltage.
= −2.15 nm/V relating the extension or contraction ΔL of the tube piezo to the applied voltage.
Fiber tube piezo calibration
In our measurements, the fiber is mounted at α = 15° so that it is directed perpendicular to the cantilever, which is also mounted at the same angle α to the horizontal [25]. The vertical movement of the fiber in z-direction (zf) changes the cavity length with ![[Graphic 7]](/bjnano/content/inline/2190-4286-16-143-i9.svg?max-width=637&scale=1.18182) . For the measurement of the actual tube piezo calibration factor
. For the measurement of the actual tube piezo calibration factor ![[Graphic 8]](/bjnano/content/inline/2190-4286-16-143-i10.svg?max-width=637&scale=1.18182) , we measure the contraction and extension of the tube via the change in cavity length Δd as a function of the change in the added voltage
, we measure the contraction and extension of the tube via the change in cavity length Δd as a function of the change in the added voltage ![[Graphic 9]](/bjnano/content/inline/2190-4286-16-143-i11.svg?max-width=637&scale=1.18182) . Initially, the control loop is frozen at
. Initially, the control loop is frozen at ![[Graphic 10]](/bjnano/content/inline/2190-4286-16-143-i12.svg?max-width=637&scale=1.18182) , with derr = 0 for a long time (many days) to facilitate complete equilibration of the piezo tube. After the start of the measurement,
, with derr = 0 for a long time (many days) to facilitate complete equilibration of the piezo tube. After the start of the measurement, ![[Graphic 11]](/bjnano/content/inline/2190-4286-16-143-i13.svg?max-width=637&scale=1.18182) is varied in positive and negative directions in steps of 20 V, while an accommodation time of 10 min passes before the extension or contraction is measured. The cantilever excitation voltage is kept constant at Vexc = 3.50 V, yielding an oscillation amplitude of A = 111 nm, facilitating convenient interferometer signal fits.
is varied in positive and negative directions in steps of 20 V, while an accommodation time of 10 min passes before the extension or contraction is measured. The cantilever excitation voltage is kept constant at Vexc = 3.50 V, yielding an oscillation amplitude of A = 111 nm, facilitating convenient interferometer signal fits.
Results and Discussion
Results are compiled in the four frames of Figure 1, including linear functions that fit the measurement points. Measurements have been performed in the sequence of contraction (![[Graphic 12]](/bjnano/content/inline/2190-4286-16-143-i14.svg?max-width=637&scale=1.18182) = 0 … 120 V, Figure 1b) and then extension (
= 0 … 120 V, Figure 1b) and then extension (![[Graphic 13]](/bjnano/content/inline/2190-4286-16-143-i15.svg?max-width=637&scale=1.18182) = 0 … −120 V, Figure 1a). Note that the contraction measurement yields a perfect result with the straight line very well fitting the data and crossing (0,0) in the (
= 0 … −120 V, Figure 1a). Note that the contraction measurement yields a perfect result with the straight line very well fitting the data and crossing (0,0) in the (![[Graphic 14]](/bjnano/content/inline/2190-4286-16-143-i16.svg?max-width=637&scale=1.18182) , derr) plane, while the fit for the following expansion measurement (Figure 1a) is less precise and exhibits a systematic trend of approach towards a limiting straight line defined by the last three data points (red line in Figure 1a). We find that the calibration factors for contraction (
, derr) plane, while the fit for the following expansion measurement (Figure 1a) is less precise and exhibits a systematic trend of approach towards a limiting straight line defined by the last three data points (red line in Figure 1a). We find that the calibration factors for contraction (![[Graphic 15]](/bjnano/content/inline/2190-4286-16-143-i17.svg?max-width=637&scale=1.18182) > 0) and extension (
> 0) and extension (![[Graphic 16]](/bjnano/content/inline/2190-4286-16-143-i18.svg?max-width=637&scale=1.18182) < 0) reproducibly differ from each other. From the slope of the straight lines in Figure 1, we determine
< 0) reproducibly differ from each other. From the slope of the straight lines in Figure 1, we determine ![[Graphic 17]](/bjnano/content/inline/2190-4286-16-143-i19.svg?max-width=637&scale=1.18182) = −(0.741 ± 0.006) nm/V for the contraction and
= −(0.741 ± 0.006) nm/V for the contraction and ![[Graphic 18]](/bjnano/content/inline/2190-4286-16-143-i20.svg?max-width=637&scale=1.18182) = −(0.889 ± 0.020) nm/V for the extension. Evaluating the calibration factor from the red, straight line yields
= −(0.889 ± 0.020) nm/V for the extension. Evaluating the calibration factor from the red, straight line yields ![[Graphic 19]](/bjnano/content/inline/2190-4286-16-143-i21.svg?max-width=637&scale=1.18182) = −(0.826 ± 0.004) nm/V, a value closer but clearly different from
= −(0.826 ± 0.004) nm/V, a value closer but clearly different from ![[Graphic 20]](/bjnano/content/inline/2190-4286-16-143-i22.svg?max-width=637&scale=1.18182) . Further, we note that, in Figure 1a, neither the first data point of this measurement nor one of the fit lines crosses (0,0). We attribute this behavior to piezo creep and hysteresis occurring after switching polarity from positive to negative. Note that we observe this phenomenon although we paused the measurement for 25 min between contraction and extension experiments to give the system time for equilibration. The deviation of data points from a straight line is a systematic effect yielding a bow shape that can qualitatively be explained by the action of creep accumulated over the extension steps. The striking observation that the bow is not observed for the contraction measurement points to a significant difference of the piezo response for contraction and extension.
. Further, we note that, in Figure 1a, neither the first data point of this measurement nor one of the fit lines crosses (0,0). We attribute this behavior to piezo creep and hysteresis occurring after switching polarity from positive to negative. Note that we observe this phenomenon although we paused the measurement for 25 min between contraction and extension experiments to give the system time for equilibration. The deviation of data points from a straight line is a systematic effect yielding a bow shape that can qualitatively be explained by the action of creep accumulated over the extension steps. The striking observation that the bow is not observed for the contraction measurement points to a significant difference of the piezo response for contraction and extension.
![[2190-4286-16-143-1]](/bjnano/content/figures/2190-4286-16-143-1.png?scale=2.0&max-width=1024&background=FFFFFF)
Figure 1:
Fiber tube piezo z-movement calibration measured with a cantilever oscillation amplitude of (a, b) A = 111 nm and (c, d) 126 nm. (a, c) Displacement measurements for tube extension (![[Graphic 21]](/bjnano/content/inline/2190-4286-16-143-i23.svg?max-width=637&scale=1.18182) < 0, ΔL > 0). (b, d) Displacement measurements for tube contraction (
< 0, ΔL > 0). (b, d) Displacement measurements for tube contraction (![[Graphic 22]](/bjnano/content/inline/2190-4286-16-143-i24.svg?max-width=637&scale=1.18182) > 0, ΔL < 0).
> 0, ΔL < 0).
Figure 1: Fiber tube piezo z-movement calibration measured with a cantilever oscillation amplitude of (a, b) A...
To clarify if the observation is inherent to the piezo or an artefact of the sequence of measurements or of a lack of accommodation time between measurements, we repeated the measurement in reverse order and with an extended accommodation time of 190 min between extension and contraction. The corresponding results compiled in Figure 1c,d qualitatively yield a perfect reproduction of the previous measurement, while there is a difference in quantitative results slightly beyond the statistical error of individual measurements. Based on the last measurements that we consider to be the most reliable ones, the study yields a calibration factor of Sf = −0.722 nm/V without specified error margins. We keep in mind that the response of the tube piezo depends in detail on the direction of the movement and that there are slight differences for the directional calibration factors ![[Graphic 23]](/bjnano/content/inline/2190-4286-16-143-i25.svg?max-width=637&scale=1.18182) and
and ![[Graphic 24]](/bjnano/content/inline/2190-4286-16-143-i26.svg?max-width=637&scale=1.18182) . Principally, it might be possible to reduce the bow effect observed for the tube piezo extension by leaving more accommodation time between the voltage steps. However, in this case, thermal drift is likely to deteriorate the measurement by similar amounts as the observed creep.
. Principally, it might be possible to reduce the bow effect observed for the tube piezo extension by leaving more accommodation time between the voltage steps. However, in this case, thermal drift is likely to deteriorate the measurement by similar amounts as the observed creep.
The fact that the measured tube piezo calibration factor differs from the nominal value by more than a factor of two might be due to the manufacturing tolerance; but, more likely, it can be explained by a depolarization of the tube piezo material as it has been subject to many heating cycles for bakeout of the UHV chamber.
Next, we investigate the influence that the extension or extension history of the fiber tube piezo might have on the cantilever excitation. The calibration of the cantilever excitation system comprising the excitation piezo, the cantilever, their mutual coupling, and electrical system parameters, further termed amplitude calibration, is highly accurate when performed with a perfectly aligned interferometer. A high-precision measurement based on an expanded dataset as described in [13] yields a value of Sprec = (33.26 ± 0.27) nm/V for the amplitude calibration factor.
For testing the calibration accuracy for the misaligned interferometer, various voltages ![[Graphic 25]](/bjnano/content/inline/2190-4286-16-143-i27.svg?max-width=637&scale=1.18182) are applied to the fiber tube piezo, and, after each step of voltage change, the cantilever excitation voltage is varied from 1 V to 7 V in steps. For each step, the interferometer signal is analyzed to extract the oscillation amplitude A corresponding to the respective voltage step. Figure 2 shows plots of A against the cantilever excitation voltage Vexc, where the data are fitted by straight lines. Note that all straight lines should coincide; however, they are shifted for each step along the Vexc axis for better clarity. The measurements presented in Figure 2a have been performed without activating the fiber piezo control loop. Hence, for each amplitude calibration run, the interferometer is misaligned by an amount defined by the respective voltage
are applied to the fiber tube piezo, and, after each step of voltage change, the cantilever excitation voltage is varied from 1 V to 7 V in steps. For each step, the interferometer signal is analyzed to extract the oscillation amplitude A corresponding to the respective voltage step. Figure 2 shows plots of A against the cantilever excitation voltage Vexc, where the data are fitted by straight lines. Note that all straight lines should coincide; however, they are shifted for each step along the Vexc axis for better clarity. The measurements presented in Figure 2a have been performed without activating the fiber piezo control loop. Hence, for each amplitude calibration run, the interferometer is misaligned by an amount defined by the respective voltage ![[Graphic 26]](/bjnano/content/inline/2190-4286-16-143-i28.svg?max-width=637&scale=1.18182) . For the measurement represented in Figure 2b, the misalignment compensation loop has been activated. Consequently, the interferometer is forced back to the initial condition of perfect alignment before each run of amplitude calibration. To allow for piezo relaxation after significant extension or retraction, a waiting time of 10 min has been applied between the change in
. For the measurement represented in Figure 2b, the misalignment compensation loop has been activated. Consequently, the interferometer is forced back to the initial condition of perfect alignment before each run of amplitude calibration. To allow for piezo relaxation after significant extension or retraction, a waiting time of 10 min has been applied between the change in ![[Graphic 27]](/bjnano/content/inline/2190-4286-16-143-i29.svg?max-width=637&scale=1.18182) and the following calibration measurement.
and the following calibration measurement.
![[2190-4286-16-143-2]](/bjnano/content/figures/2190-4286-16-143-2.png?scale=2.0&max-width=1024&background=FFFFFF)
Figure 2: Cantilever excitation amplitude calibration performed for fiber tube piezo extension or contraction. Calibration measurements are started after adjusting the tube piezo z voltage Vz,f to the specified voltage and waiting for 10 min for system equilibration. (a) The interferometer is misaligned according to the applied negative and positive voltages. (b) The misalignment is compensated with a control loop. Note that data and fit lines are shifted by an increment of 1 V along the Vexc axis for each calibration to separate measurements from each other. The undulation of data points around the straight line is due to peculiarities in fitting the data as explained in [13].
Figure 2: Cantilever excitation amplitude calibration performed for fiber tube piezo extension or contraction...
The amplitude calibration factors determined with the aligned or misaligned interferometer are compiled in Table 1. The weighted mean of the calibration factors for the misaligned interferometer (frozen loop) is determined as ![[Graphic 28]](/bjnano/content/inline/2190-4286-16-143-i30.svg?max-width=637&scale=1.18182) = (30.84 ± 0.15) nm/V, while in the measurements in which misalignment was corrected before each measurement (active loop), the mean of calibration factors is
= (30.84 ± 0.15) nm/V, while in the measurements in which misalignment was corrected before each measurement (active loop), the mean of calibration factors is ![[Graphic 29]](/bjnano/content/inline/2190-4286-16-143-i31.svg?max-width=637&scale=1.18182) = (30.34 ± 0.24) nm/V.
= (30.34 ± 0.24) nm/V.
Table 1: Measured calibration factors for the cantilever oscillation piezo determined for the non-aligned (frozen loop) and well-aligned (active loop) interferometer.
| frozen loop | active loop | ||
![[Graphic 30]](/bjnano/content/inline/2190-4286-16-143-i32.svg?max-width=637&scale=1.0)
|
Si [nm/V] |
![[Graphic 31]](/bjnano/content/inline/2190-4286-16-143-i33.svg?max-width=637&scale=1.0)
|
Si [nm/V] |
| 0 V | 32.008 ± 0.555 | 0 V | 30.855 ± 0.679 |
| 60 V | 31.794 ± 0.605 | 20 V | 30.608 ± 0.662 |
| 120 V | 30.736 ± 0.290 | 60 V | 30.320 ± 0.661 |
| 180 V | 30.542 ± 0.281 | 100 V | 30.168 ± 0.634 |
| −60 V | 31.587 ± 0.537 | −20 V | 30.135 ± 0.638 |
| −120 V | 29.900 ± 0.387 | −60 V | 30.278 ± 0.672 |
| −180 V | 29.325 ± 0.560 | −100 V | 31.035 ± 0.501 |
For the misaligned interferometer (frozen loop), the maximum and minimum ![[Graphic 32]](/bjnano/content/inline/2190-4286-16-143-i34.svg?max-width=637&scale=1.18182) values for
values for ![[Graphic 33]](/bjnano/content/inline/2190-4286-16-143-i35.svg?max-width=637&scale=1.18182) ≠ 0 differ by 2.470 nm/V and the
≠ 0 differ by 2.470 nm/V and the ![[Graphic 34]](/bjnano/content/inline/2190-4286-16-143-i36.svg?max-width=637&scale=1.18182) value for
value for ![[Graphic 35]](/bjnano/content/inline/2190-4286-16-143-i37.svg?max-width=637&scale=1.18182) = 0 differs from the mean
= 0 differs from the mean ![[Graphic 36]](/bjnano/content/inline/2190-4286-16-143-i38.svg?max-width=637&scale=1.18182) by 1.361 nm/V. Both differences are significantly larger than the standard deviation determined for the individual measurements and the weighted mean of uncertainties. This points to a systematic error in the amplitude calibration factor measurements. Applying the same analysis to the data of the alignment-corrected interferometer (active loop), we find that the respective differences are smaller or close to the relevant standard deviations. We conclude that, in the latter case, the loop action provides the same conditions for each calibration measurement, allowing for a calibration with 2% relative uncertainty in this case.
by 1.361 nm/V. Both differences are significantly larger than the standard deviation determined for the individual measurements and the weighted mean of uncertainties. This points to a systematic error in the amplitude calibration factor measurements. Applying the same analysis to the data of the alignment-corrected interferometer (active loop), we find that the respective differences are smaller or close to the relevant standard deviations. We conclude that, in the latter case, the loop action provides the same conditions for each calibration measurement, allowing for a calibration with 2% relative uncertainty in this case.
Above observations clearly demonstrate that the misalignment and the fiber piezo motion history may deteriorate the excitation system calibration. This is probably due to piezo hysteresis and the fit procedure that has been optimized for the perfectly aligned interferometer [13] but not extensively tested for the misaligned interferometer. The slight difference between the Si values corresponding to ![[Graphic 37]](/bjnano/content/inline/2190-4286-16-143-i39.svg?max-width=637&scale=1.18182) = 0 for frozen and active loops is a result of a slight change in the interferometer alignment during about 24 h elapsed between respective measurements. The differences between both values and Sprec are even larger as the precision measurement has been performed many weeks earlier. The difference in calibration results for measurements taken with significant time elapsed between can be explained by slight differences in the alignment of the laser spot on the cantilever due to manual adjustment or drift. Although, in our models, light is treated as a plane wave, in reality the light beam exiting the fiber end has a divergence of about 9°. As a consequence, light diffracted at the edges of the cantilever acts back on the reflected light sampled by the fiber. Furthermore, the partially coherent light of the laser produces speckle patterns [26] depending on minute charges in the beam profile or cantilever alignment. Both effects result in a considerable dependence of the lateral intensity distribution in the cantilever plane [25] on details of the alignment and, in turn, have an impact on the amount and interference structure of the reflected light, affecting the amplitude calibration.
= 0 for frozen and active loops is a result of a slight change in the interferometer alignment during about 24 h elapsed between respective measurements. The differences between both values and Sprec are even larger as the precision measurement has been performed many weeks earlier. The difference in calibration results for measurements taken with significant time elapsed between can be explained by slight differences in the alignment of the laser spot on the cantilever due to manual adjustment or drift. Although, in our models, light is treated as a plane wave, in reality the light beam exiting the fiber end has a divergence of about 9°. As a consequence, light diffracted at the edges of the cantilever acts back on the reflected light sampled by the fiber. Furthermore, the partially coherent light of the laser produces speckle patterns [26] depending on minute charges in the beam profile or cantilever alignment. Both effects result in a considerable dependence of the lateral intensity distribution in the cantilever plane [25] on details of the alignment and, in turn, have an impact on the amount and interference structure of the reflected light, affecting the amplitude calibration.
Conclusion
Our results demonstrate that a tube piezo, which is part of an interferometer for cantilever displacement detection, can precisely be calibrated by dynamic interferometry. However, care has to be taken in performing and analyzing experiments as piezo non-linearity and creep may have a considerable impact on the calibration results. Therefore, the calibration should be performed under conditions that are as close as possible to the conditions of the experiment the calibration results are used for. Generally, the system should be given much time to relax to avoid the deterioration of results by piezo creep. Also, one has to keep in mind that the piezo as a complex electromechanical system can be characterized by a single parameter Sf only in a limited range of system parameters. We find that, provided necessary precautions are applied, a valid amplitude calibration by dynamic interferometry can be performed for the well-aligned interferometer; however, additional care has to be taken for an amplitude calibration performed under conditions of a misaligned interferometer.
Data Availability Statement
Data generated and analyzed during this study is available from the corresponding author upon reasonable request.
References
-
Martin, Y.; Williams, C. C.; Wickramasinghe, H. K. J. Appl. Phys. 1987, 61, 4723–4729. doi:10.1063/1.338807
Return to citation in text: [1] -
Rugar, D.; Mamin, H. J.; Erlandsson, R.; Stern, J. E.; Terris, B. D. Rev. Sci. Instrum. 1988, 59, 2337–2340. doi:10.1063/1.1139958
Return to citation in text: [1] -
Erlandsson, R.; McClelland, G. M.; Mate, C. M.; Chiang, S. J. Vac. Sci. Technol., A 1988, 6, 266–270. doi:10.1116/1.575440
Return to citation in text: [1] -
Meyer, G.; Amer, N. M. Appl. Phys. Lett. 1988, 53, 1045–1047. doi:10.1063/1.100061
Return to citation in text: [1] -
Putman, C. A. J.; de Grooth, B. G.; van Hulst, N. F.; Greve, J. Ultramicroscopy 1992, 42–44, 1509–1513. doi:10.1016/0304-3991(92)90474-x
Return to citation in text: [1] -
Fujisawa, S.; Ohta, M.; Konishi, T.; Sugawara, Y.; Morita, S. Rev. Sci. Instrum. 1994, 65, 644–647. doi:10.1063/1.1145131
Return to citation in text: [1] -
Albrecht, T. R.; Grütter, P.; Rugar, D.; Smith, D. P. E. Ultramicroscopy 1992, 42–44, 1638–1646. doi:10.1016/0304-3991(92)90498-9
Return to citation in text: [1] -
Allers, W.; Schwarz, A.; Schwarz, U. D.; Wiesendanger, R. Rev. Sci. Instrum. 1998, 69, 221–225. doi:10.1063/1.1148499
Return to citation in text: [1] -
Hug, H. J.; Stiefel, B.; van Schendel, P. J. A.; Moser, A.; Martin, S.; Güntherodt, H.-J. Rev. Sci. Instrum. 1999, 70, 3625–3640. doi:10.1063/1.1149970
Return to citation in text: [1] -
Karcı, Ö.; Dede, M.; Oral, A. Rev. Sci. Instrum. 2014, 85, 103705. doi:10.1063/1.4897147
Return to citation in text: [1] -
von Allwörden, H.; Ruschmeier, K.; Köhler, A.; Eelbo, T.; Schwarz, A.; Wiesendanger, R. Rev. Sci. Instrum. 2016, 87, 073702. doi:10.1063/1.4955448
Return to citation in text: [1] -
Karc, Ö.; Çelik, Ü.; Oral, A. Rev. Sci. Instrum. 2020, 91, 013703. doi:10.1063/1.5120007
Return to citation in text: [1] -
Khachatryan, K.; Anter, S.; Reichling, M.; von Schmidsfeld, A. Beilstein J. Nanotechnol. 2024, 15, 1070–1076. doi:10.3762/bjnano.15.87
Return to citation in text: [1] [2] [3] [4] [5] [6] [7] -
von Schmidsfeld, A.; Reichling, M. Appl. Phys. Lett. 2015, 107, 123111. doi:10.1063/1.4931702
Return to citation in text: [1] -
Milde, P.; Langenhorst, M.; Hölscher, H.; Rottmann-Matthes, J.; Hundertmark, D.; Eng, L. M.; Hoffmann-Vogel, R. J. Appl. Phys. 2021, 130, 035303. doi:10.1063/5.0054509
Return to citation in text: [1] -
von Schmidsfeld, A.; Khachatryan, K.; Reichling, M. Rev. Sci. Instrum. 2025, 96, 093703. doi:10.1063/5.0269765
Return to citation in text: [1] [2] [3] [4] -
Vandervoort, K. G.; Zasadzinski, R. K.; Galicia, G. G.; Crabtree, G. W. Rev. Sci. Instrum. 1993, 64, 896–899. doi:10.1063/1.1144139
Return to citation in text: [1] -
Chen, F.; Mohideen, U. Rev. Sci. Instrum. 2001, 72, 3100–3102. doi:10.1063/1.1378341
Return to citation in text: [1] -
Dürselen, R.; Grunewald, U.; Preuss, W. Scanning 1995, 17, 91–96. doi:10.1002/sca.4950170205
Return to citation in text: [1] -
Al Janaideh, M.; Al Saaideh, M.; Rakotondrabe, M. Mech. Syst. Signal Process. 2020, 145, 106880. doi:10.1016/j.ymssp.2020.106880
Return to citation in text: [1] -
Jung, H.; Gweon, D.-G. Rev. Sci. Instrum. 2000, 71, 1896–1900. doi:10.1063/1.1150559
Return to citation in text: [1] -
Smith, W. F.; Axelrod, B. W. Rev. Sci. Instrum. 2000, 71, 1772–1775. doi:10.1063/1.1150535
Return to citation in text: [1] -
Piezocaramic tubes for ultra-precise positioning applications; EBL Productes Inc. (East Hartford, CT, USA), data sheet. https://eblproducts.com/wp-content/uploads/2023/09/piezoceramic-tubes.pdf (accessed Oct 22, 2025).
Return to citation in text: [1] -
Moheimani, S. O. R. Rev. Sci. Instrum. 2008, 79, 071101. doi:10.1063/1.2957649
Return to citation in text: [1] -
von Schmidsfeld, A.; Nörenberg, T.; Temmen, M.; Reichling, M. Beilstein J. Nanotechnol. 2016, 7, 841–851. doi:10.3762/bjnano.7.76
Return to citation in text: [1] [2] -
Akkermans, E.; Montambaux, G. J. Opt. Soc. Am. B 2004, 21, 101–112. doi:10.1364/josab.21.000101
Return to citation in text: [1]
| 25. | von Schmidsfeld, A.; Nörenberg, T.; Temmen, M.; Reichling, M. Beilstein J. Nanotechnol. 2016, 7, 841–851. doi:10.3762/bjnano.7.76 |
| 23. | Piezocaramic tubes for ultra-precise positioning applications; EBL Productes Inc. (East Hartford, CT, USA), data sheet. https://eblproducts.com/wp-content/uploads/2023/09/piezoceramic-tubes.pdf (accessed Oct 22, 2025). |
| 24. | Moheimani, S. O. R. Rev. Sci. Instrum. 2008, 79, 071101. doi:10.1063/1.2957649 |
| 1. | Martin, Y.; Williams, C. C.; Wickramasinghe, H. K. J. Appl. Phys. 1987, 61, 4723–4729. doi:10.1063/1.338807 |
| 2. | Rugar, D.; Mamin, H. J.; Erlandsson, R.; Stern, J. E.; Terris, B. D. Rev. Sci. Instrum. 1988, 59, 2337–2340. doi:10.1063/1.1139958 |
| 3. | Erlandsson, R.; McClelland, G. M.; Mate, C. M.; Chiang, S. J. Vac. Sci. Technol., A 1988, 6, 266–270. doi:10.1116/1.575440 |
| 4. | Meyer, G.; Amer, N. M. Appl. Phys. Lett. 1988, 53, 1045–1047. doi:10.1063/1.100061 |
| 5. | Putman, C. A. J.; de Grooth, B. G.; van Hulst, N. F.; Greve, J. Ultramicroscopy 1992, 42–44, 1509–1513. doi:10.1016/0304-3991(92)90474-x |
| 6. | Fujisawa, S.; Ohta, M.; Konishi, T.; Sugawara, Y.; Morita, S. Rev. Sci. Instrum. 1994, 65, 644–647. doi:10.1063/1.1145131 |
| 16. | von Schmidsfeld, A.; Khachatryan, K.; Reichling, M. Rev. Sci. Instrum. 2025, 96, 093703. doi:10.1063/5.0269765 |
| 13. | Khachatryan, K.; Anter, S.; Reichling, M.; von Schmidsfeld, A. Beilstein J. Nanotechnol. 2024, 15, 1070–1076. doi:10.3762/bjnano.15.87 |
| 14. | von Schmidsfeld, A.; Reichling, M. Appl. Phys. Lett. 2015, 107, 123111. doi:10.1063/1.4931702 |
| 15. | Milde, P.; Langenhorst, M.; Hölscher, H.; Rottmann-Matthes, J.; Hundertmark, D.; Eng, L. M.; Hoffmann-Vogel, R. J. Appl. Phys. 2021, 130, 035303. doi:10.1063/5.0054509 |
| 22. | Smith, W. F.; Axelrod, B. W. Rev. Sci. Instrum. 2000, 71, 1772–1775. doi:10.1063/1.1150535 |
| 13. | Khachatryan, K.; Anter, S.; Reichling, M.; von Schmidsfeld, A. Beilstein J. Nanotechnol. 2024, 15, 1070–1076. doi:10.3762/bjnano.15.87 |
| 16. | von Schmidsfeld, A.; Khachatryan, K.; Reichling, M. Rev. Sci. Instrum. 2025, 96, 093703. doi:10.1063/5.0269765 |
| 25. | von Schmidsfeld, A.; Nörenberg, T.; Temmen, M.; Reichling, M. Beilstein J. Nanotechnol. 2016, 7, 841–851. doi:10.3762/bjnano.7.76 |
| 7. | Albrecht, T. R.; Grütter, P.; Rugar, D.; Smith, D. P. E. Ultramicroscopy 1992, 42–44, 1638–1646. doi:10.1016/0304-3991(92)90498-9 |
| 8. | Allers, W.; Schwarz, A.; Schwarz, U. D.; Wiesendanger, R. Rev. Sci. Instrum. 1998, 69, 221–225. doi:10.1063/1.1148499 |
| 9. | Hug, H. J.; Stiefel, B.; van Schendel, P. J. A.; Moser, A.; Martin, S.; Güntherodt, H.-J. Rev. Sci. Instrum. 1999, 70, 3625–3640. doi:10.1063/1.1149970 |
| 10. | Karcı, Ö.; Dede, M.; Oral, A. Rev. Sci. Instrum. 2014, 85, 103705. doi:10.1063/1.4897147 |
| 11. | von Allwörden, H.; Ruschmeier, K.; Köhler, A.; Eelbo, T.; Schwarz, A.; Wiesendanger, R. Rev. Sci. Instrum. 2016, 87, 073702. doi:10.1063/1.4955448 |
| 12. | Karc, Ö.; Çelik, Ü.; Oral, A. Rev. Sci. Instrum. 2020, 91, 013703. doi:10.1063/1.5120007 |
| 16. | von Schmidsfeld, A.; Khachatryan, K.; Reichling, M. Rev. Sci. Instrum. 2025, 96, 093703. doi:10.1063/5.0269765 |
| 21. | Jung, H.; Gweon, D.-G. Rev. Sci. Instrum. 2000, 71, 1896–1900. doi:10.1063/1.1150559 |
| 13. | Khachatryan, K.; Anter, S.; Reichling, M.; von Schmidsfeld, A. Beilstein J. Nanotechnol. 2024, 15, 1070–1076. doi:10.3762/bjnano.15.87 |
| 13. | Khachatryan, K.; Anter, S.; Reichling, M.; von Schmidsfeld, A. Beilstein J. Nanotechnol. 2024, 15, 1070–1076. doi:10.3762/bjnano.15.87 |
| 20. | Al Janaideh, M.; Al Saaideh, M.; Rakotondrabe, M. Mech. Syst. Signal Process. 2020, 145, 106880. doi:10.1016/j.ymssp.2020.106880 |
| 16. | von Schmidsfeld, A.; Khachatryan, K.; Reichling, M. Rev. Sci. Instrum. 2025, 96, 093703. doi:10.1063/5.0269765 |
| 26. | Akkermans, E.; Montambaux, G. J. Opt. Soc. Am. B 2004, 21, 101–112. doi:10.1364/josab.21.000101 |
| 19. | Dürselen, R.; Grunewald, U.; Preuss, W. Scanning 1995, 17, 91–96. doi:10.1002/sca.4950170205 |
| 13. | Khachatryan, K.; Anter, S.; Reichling, M.; von Schmidsfeld, A. Beilstein J. Nanotechnol. 2024, 15, 1070–1076. doi:10.3762/bjnano.15.87 |
| 17. | Vandervoort, K. G.; Zasadzinski, R. K.; Galicia, G. G.; Crabtree, G. W. Rev. Sci. Instrum. 1993, 64, 896–899. doi:10.1063/1.1144139 |
| 18. | Chen, F.; Mohideen, U. Rev. Sci. Instrum. 2001, 72, 3100–3102. doi:10.1063/1.1378341 |
| 13. | Khachatryan, K.; Anter, S.; Reichling, M.; von Schmidsfeld, A. Beilstein J. Nanotechnol. 2024, 15, 1070–1076. doi:10.3762/bjnano.15.87 |
| 13. | Khachatryan, K.; Anter, S.; Reichling, M.; von Schmidsfeld, A. Beilstein J. Nanotechnol. 2024, 15, 1070–1076. doi:10.3762/bjnano.15.87 |
© 2025 Khachatryan and Reichling; licensee Beilstein-Institut.
This is an open access article licensed under the terms of the Beilstein-Institut Open Access License Agreement (https://www.beilstein-journals.org/bjnano/terms), which is identical to the Creative Commons Attribution 4.0 International License (https://creativecommons.org/licenses/by/4.0). The reuse of material under this license requires that the author(s), source and license are credited. Third-party material in this article could be subject to other licenses (typically indicated in the credit line), and in this case, users are required to obtain permission from the license holder to reuse the material.