Abstract
We developed a colorimetric method for the rapid detection of copper ions (Cu2+) in aqueous solution. The detection of Cu2+ is based on coordination reactions of Cu2+ with casein peptide-functionalized silver nanoparticles (AgNPs), leading to a distinct color change of the solution from yellow to red. The developed method has a good detection limit of about 0.16 µM Cu2+ using 0.05 mL of AgNPs stock solution and a linearity in the range of 0.08–1.44 µM Cu2+ with a correlation coefficient of R2 = 0.973. The developed method is a useful tool for the detection of Cu2+ ions. Furthermore, it can be used for monitoring Cu2+ in water at concentrations below the safe limit for drinking water set by the World Health Organization.
Introduction
Among heavy metals, copper is particularly interesting because it acts both as a micronutrient essential to life, but also as an environmental contaminant, due to its toxicity to most organisms when present above certain concentrations [1]. Copper is a widely distributed heavy metal in water bodies, as a result of direct dumping of industrial and mining waste and electronic waste [2,3]. Cu2+ has been used excessively in the form of copper sulfate and copper hydroxide as a fungicide, algaecide, and soil amendment, which also contributes to the increased Cu2+ concentrations [4]. Thus, a rapid and convenient approach for on-site visual analysis of Cu2+ is considered an important research topic in analytical chemistry [5]. However, procedures that rely on expensive and specialized equipment (e.g., atomic emission spectrometer, atomic absorption spectrometer, inductively coupled plasma mass spectrometer) are only of limited use for on-site applications [6]. Thus, the development of a convenient but highly sensitive and selective sensing method for Cu2+ with improved practicality is urgently needed.
Although colorimetric probes based on the aggregation of nanoparticles (NPs) induced by target-metal ions are advantageous, these probes may have difficulties in detecting Cu2+ in complex matrices [7]. Quantum-dot-based fluorescent probes showed improved sensitivity and selectivity for Cu2+ compared to traditional organic probes [8-10], but the preparation of such functionalized quantum dots is a time-consuming process. Similarly, colorimetric methods based on Cu2+-dependent click chemistry are well-known for high selectivity and tolerance to interference caused by other metal ions. Nonetheless, these strategies have limited practical applications due to a relatively high detection limit (3.0–20 μM) [11], which is much higher than that of fluorescence methods (0.8 μM) [5]. Recently, colorimetric methods based on gold [12], and platinum NPs have been widely reported for on-site use and analysis of multiple samples [13,14]. However, the use of gold and/or platinum limits the affordability of sensing probe. As exemplified in this work, cost-effective silver nanoparticles (AgNPs) having specifically modified ligands for detecting lower concentrations of Cu2+ offer a more portable and practical approach.
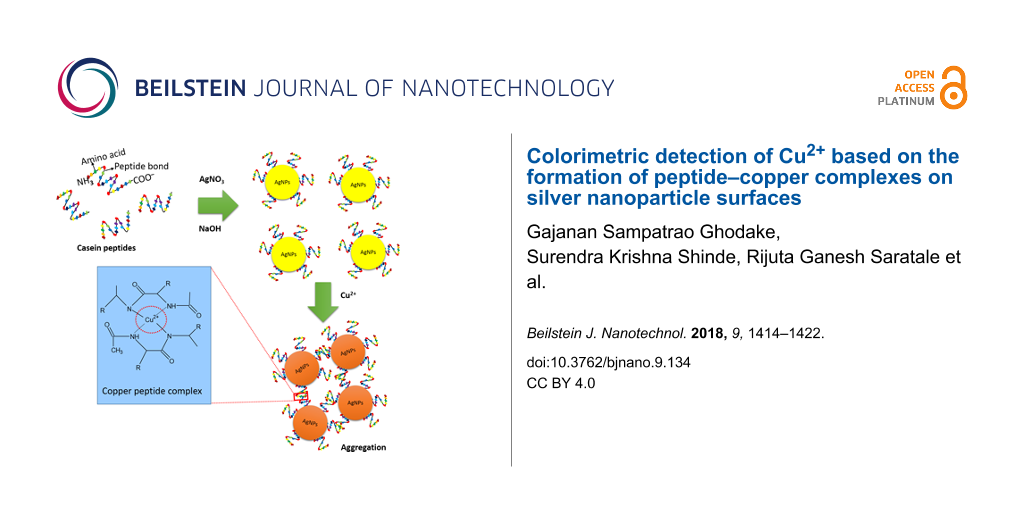
In a typical experiment, casein peptide-modified AgNPs were prepared by reduction of AgNO3 and the functionality of the AgNP–peptide conjugates to coordinate Cu2+ was improved by removing unbound casein peptides. Highly dispersed and stable 20 nm diameter AgNPs had an extinction peak at about 410 nm with a characteristic yellow appearance. In the presence of Cu2+, the coordination product was formed, followed by assembly of the AgNPs into aggregates, which exhibited extinction at 520 nm. In a proof-of-concept detection experiment, the estimated Cu2+ concentration range was 0.08–1.44 µM, depending on the amount of Cu2+-binding casein peptide ligands. The solution of aggregates was incubated for 20 min to allow for the coordination to occur.
Results and Discussion
Synthesis and characterization of casein peptide-capped AgNPs
The surface plasmon resonance (SPR) of spherical AgNPs immediately caused an absorbance peak in the UV–vis spectra at approximately 410–420 nm. The wavelength of maximum absorbance (λmax) can be used to determine the approximate concentration and the size range of the stable AgNPs. Herein, synthesis of AgNPs was performed using just 0.06% (w/v) casein peptides in the solution, to successfully convert 1 mM AgNO3 to crystalline AgNPs having a λmax of 400 nm. No additional reducing/stabilizing agents were added to the solution. Thus, most of the green chemistry principles were followed during the preparation of casein peptide-functionalized AgNPs [15,16].
The casein peptide-AgNPs were monodisperse in nature with a narrow size distribution, as expected from the narrow absorbance peak centered at 410 nm. The UV–vis spectroscopic data were collected before and after centrifugation (10000 rpm for 12 min) to observe how the SPR peak width and shift changed with the removal of unbound/unreacted casein peptides (Figure 1a). The minor red-shift (from 400 to 410 nm) and changes in the SPR peak width are indicative of the stable and dispersed nature of the AgNPs. Both peaks remained narrow, indicating a more homogeneous size distribution. Moreover, the absorption measurements revealed the stability of the casein peptide-facilitated functionality of the AgNPs (Figure 1a). These results are a qualitative measure of the size and size distributions of the AgNPs in distilled water after centrifugation.
![[2190-4286-9-134-1]](/bjnano/content/figures/2190-4286-9-134-1.png?scale=2.0&max-width=1024&background=FFFFFF)
Figure 1: (a) UV–vis spectrum and color of silver nanoparticles before and after centrifugation. A representative HR-TEM image of silver nanoparticles (b) before and (c) after centrifugation.
Figure 1: (a) UV–vis spectrum and color of silver nanoparticles before and after centrifugation. A representa...
Size, morphology, crystalline structure, and surface capping of the prepared AgNPs were characterized by high-resolution transmission electron microscopy (HR-TEM), XPS, XRD, and Fourier-transform infrared (FTIR) spectroscopy. The shape of the SPR peak determined the qualitative characterization of the AgNPs, and the size range of the particles in solution concurred with the HR-TEM images. As can be seen in the HR-TEM image, the freshly produced AgNPs had a highly uniform appearance with an average size of 20 ± 2 nm (Figure 1b). A representative HR-TEM image of the AgNPs after separation of excess casein peptides is also shown (Figure 1c). After centrifugation and re-dispersion of the AgNPs, some aggregates appeared, whereas, the average size of the individual AgNPs remained unchanged (Figure 1c). Accordingly, we concluded that under centrifugation conditions, bilayer structures of casein peptides remain intact and stable, thereby inhibiting AgNP aggregation and enabling increased sensitivity toward Cu2+ ions.
The C 1s, O 1s, N 1s, and Ag 3d peaks originating from the AgNPs surface are shown in the XPS survey spectrum (Figure 2a). The presence of O1s and N1s peaks after centrifugation indicates that the capping with casein peptides through electrostatic interaction was stable and appropriate to develop analytical applications. It can be concluded that amino acids bind to the nanoparticle surfaces through NH2–OH hydrogen bonds and electrostatic interactions [17]. In the N 1s spectrum two peaks were identified. The peak at 398.2 eV was allocated to deprotonated nitrogen bindings (N–C=O and NH2) while the higher binding energy (BE) peak at 402.0 eV corresponds to protonated amino groups [18]. The Ag 3d XPS spectrum (Figure 2b) shows two prominent spin–orbit pairs at 367.6 (Ag 3d5/2) and 373.5 (Ag 3d3/2) eV, separated by 5.9 eV, and a broadening at high BE values also occurred. The first spin–orbit pair of small intensity at higher BE values is due to the oxidized Ag surface atoms bonding with the peptide molecule. The main signal, the Ag 3d5/2 component, centered at 367.6 eV BE, corresponds to metallic Ag atoms in the bulk of AgNPs [19].
![[2190-4286-9-134-2]](/bjnano/content/figures/2190-4286-9-134-2.png?scale=2.0&max-width=1024&background=FFFFFF)
Figure 2: (a) XPS survey and (b) high-resolution Ag 3d spectra of casein peptide-capped silver nanoparticles.
Figure 2: (a) XPS survey and (b) high-resolution Ag 3d spectra of casein peptide-capped silver nanoparticles.
XRD was performed to reveal the formation of AgNPs and to identify their crystalline structure (Figure 3a). The diffraction peaks at scattering angles, 2θ, of 38.25°, 44.42°, 64.51° and 77.55° were assigned to the crystallographic planes (111), (200), (220) and (311), respectively.
![[2190-4286-9-134-3]](/bjnano/content/figures/2190-4286-9-134-3.png?scale=2.0&max-width=1024&background=FFFFFF)
Figure 3: (a) XRD pattern and (b) FTIR spectra of casein peptide-capped silver nanoparticles.
Figure 3: (a) XRD pattern and (b) FTIR spectra of casein peptide-capped silver nanoparticles.
FTIR was performed to examine the capping of casein peptides on the AgNP surfaces. The higher-frequency absorption band at 1640 cm−1, corresponding to the amide-I band is identified for centrifuged AgNPs (Figure 3b) while a lower-frequency amide-II band was shifted from 1620 to 1530 cm−1 after capping of casein peptides to AgNPs, largely due to trans-NH bending of the carbonyl oxygen. In this study, casein peptides were successfully used as reducing and stabilizing agents in the formation of extremely stable AgNPs. Amide groups and side chains of the peptides were involved as both reducing and capping agents. Functional groups of casein peptides can result in passivation of the AgNP surface [20] and stabilize NPs via coordination of N atoms with Ag atoms at the surface of AgNPs [21,22]. Contributions of the side-chain functional groups of the casein peptides, such as C–H stretching modes and –CH2– bending modes were identified at 2929 and 2850 cm−1 and at 1458 cm−1, respectively, in agreement with [23].
Selectivity
At first, the selectivity of the functionalized AgNPs was examined with various ions, including Cu2+, Mn2+, Mo3+, Na+, Cr3+, Hg2+, Ni2+, Ca2+, K+, Cs+, Li+, As+, PO43−, NH4, and NO3−, at 100 ppb. The color change of the AgNPs solutions was observed in the presence of various metal ions. The Cu2+ ions caused a change from yellow to red. However, no color change was noticed for the other ions and salts, and the original color and SPR band of the AgNPs were retained (data not shown). It was shown that casein peptide-capped AgNPs are suitable to detect Cu2+ ions with excellent selectivity, whereas the other evaluated metal ions exhibit insignificant coordination under identical conditions.
Effect of acidic and alkaline conditions and ionic strength
In general, the pH value of the NP solution plays a vital role in the colorimetric detection. Consequently, the Cu2+-sensing ability of the functionalized AgNPs under increasingly acidic or alkaline conditions was investigated. The casein peptides led to AgNP aggregation under acidic conditions (0.1–0.6 mM HCl). However, alkaline conditions (0.1–0.6 mM NaOH) provided additional stability to the AgNP dispersions. The absorbance signal at 410 nm linearly decreased with increasing concentration of diluted HCl from 0.1 to 0.6 mM and then further declined in the presence of Cu2+. The extreme decrease in absorbance of AgNPs triggered by Cu2+ addition, even in the presence of 0.1 mM HCl, indicates that the functionalized AgNPs are very sensitive to acidic conditions (Figure 4a). The result showed that the AgNP response toward Cu2+ could be increased with an increase in acidity strength. Free –NH2/–COOH groups are more suitable to bind to divalent metal ions, such as Cu2+, as illustrated in [24].
![[2190-4286-9-134-4]](/bjnano/content/figures/2190-4286-9-134-4.png?scale=2.0&max-width=1024&background=FFFFFF)
Figure 4: Absorbance intensity (at 410 nm) of the proposed probe in the presence and absence of Cu2+ at different (a) HCl concentrations, (b) NaOH concentrations and (c) ionic strengths.
Figure 4: Absorbance intensity (at 410 nm) of the proposed probe in the presence and absence of Cu2+ at diffe...
In contrast, the absorbance intensity at 410 nm did not change markedly, before and after addition of Cu2+, with increasing concentration of NaOH (0.1 to 0.6 mM), demonstrating the stability of the analytical platform under alkaline pH conditions (Figure 4b). Under highly alkaline conditions, stable dispersions of AgNPs could be formed through interactions with OH− ions [25], which inhibit the formation of AgNPs aggregates in the presence of Cu2+. Instead, in the present study, stable sensitivity occurred under alkaline pH conditions, possibly through the formation of various coordination complexes.
The ionic strength of the NP solution is also an important parameter during the detection of target metal ions. The effect of ionic strength on the absorbance of AgNPs is presented in Figure 4c. The absorbance intensity at 410 nm changed linearly before and after Cu2+ addition with increasing concentration of NaCl (1.0 to 3.5 mM), revealing that the sensitivity of the analytical platform can be increased with the increase of ionic strength. Based on these results, further tests on Cu2+ were performed using distilled water, even though this method is versatile and adaptable at different pH values and ionic strengths.
Cu2+ quantification
It is highly desirable to establish a system based on visual and spectral detection of Cu2+ in water at concentrations below the safe limit for drinking water of 20 and 30 µM set by the US Environmental Protection Agency and the World Health Organization [5,26], and below the normal blood concentration of Cu2+, which is in the range of 24–135 µg/dL [27]. The interaction of Cu2+ with the peptide ligands on the AgNP surfaces attracts neighboring AgNPs, which is observed as a color change from yellow to red. The change in absorbance was monitored by UV–vis spectroscopy at various Cu2+ concentrations (0.08 to1.44 µM).
The absorbance intensity at 520 nm increased with an increase of the Cu2+ concentration, and the sensitivity was purely dependent upon the volume of added AgNPs stock solution as presented in Figure 5. Thus, the quantitative features, including the calibration curve, correlation coefficients (R2), and limit of detection (LOD) were studied using coordination peptides number approach. In all three instances, a linear correlation existed between the absorbance at 520 nm and the Cu2+ concentration over the ranges of 0.08–0.4, 0.08–0.72, and 0.08–1.44 µM Cu2+ (for 0.05, 0.1, and 0.2 mL of added AgNPs stock solution) with R2 = 0.985, 0.994, and 0.973, respectively (Figure 5). The spectral LOD toward Cu2+ was observed at about 0.16, 0.24, and 0.32 µM, respectively, for 0.05, 0.1, and 0.2 mL of added AgNPs solution with a broad detection range of 0.08–1.44 µM. The color of the solution changed from yellow to red by the addition of Cu2+ ions. The visual LOD is a desired characteristic of sensing probes. In this study, the visual LOD values of 0.32, 0.56, and 1.12 µM, respectively, for 0.05, 0.1, and 0.2 mL of stock AgNPs could be achieved, as shown in the insets of Figure 5. The increase in absorbance intensity at 520 nm was successfully used to quantify Cu2+, with a low intensity associated with the yellow dispersed AgNPs and a high intensity associated with the red colored aggregates of AgNPs. Moreover, these changes can be quantified with the naked eye. Involvement of the deprotonated amide groups in the coordination of Cu2+ was recently reported [28]. The LOD of the casein peptide-AgNPs is much lower than that of comparable methods (Table 1). A distinct color change was detectable by the naked eye at the smallest Cu2+ concentration of 0.4 μM. This concentration is significantly lower than that of 20 μM reported by Xu et al. [11], and 5.0 μM by Lu and Liu [26], using DNA-modified NPs. Recently, colorimetric methods based on gold NPs have been widely reported for Cu2+ detection (Table 1). However, as mentioned above, such procedures are costly. The detection platform established in the current report was sufficiently sensitive and cost-effective to detect Cu2+ in drinking water below the limit (20 μM) directed by the WHO and the United States Environmental Protection Agency [26].
![[2190-4286-9-134-5]](/bjnano/content/figures/2190-4286-9-134-5.png?scale=2.0&max-width=1024&background=FFFFFF)
Figure 5: Absorbance intensity (at 520 nm) with increasing amounts of Cu2+ using (a) 0.05, (b) 0.1, and (c) 0.2 mL AgNPs solution. (The visual detection limits are given in the insets).
Figure 5: Absorbance intensity (at 520 nm) with increasing amounts of Cu2+ using (a) 0.05, (b) 0.1, and (c) 0...
Table 1: Detection limit of Cu2+ reported using various colorimetric methods and surface chemistries.
| surface chemistry | nanomaterial | detection range (μM) | detection limit (μM) | reference |
|---|---|---|---|---|
| DNA | gold nanoparticles | 20–100 | 20 | [11] |
| DNA | gold nanoparticles | 1–100 | 10 | [26] |
| triazole | click chemistry | 0.60–13 | 10 | [35] |
| polythiophene | click chemistry | 0.5–10 | 3.0 | [5] |
| azide | gold nanoparticles | 1.8–200 | 1.8 | [36] |
| dopamine | gold nanoparticles | 1–10 | 1.4 | [24] |
| catalytic leaching | gold nanoparticles | 0.03–3.0 | 0.7 | [37] |
| copper catalysis | silver nanoparticles | 0.25–2.0 | 0.75 | [38] |
| casein peptide | silver nanoparticles | 0.08–1.44 | 0.16 | described here |
Stability of coordination complexes
Most of the colorimetric and visual methods are based on the change in color, and the spectral response received immediately after exposure to the target metal ions. The current report also studied the real-time UV–vis absorption spectroscopy, with the intent of investigating the stability of the established sensing platform. Stable spectral shifts indicate that the AgNPs–casein peptide probe is viable for rapid and sensitive detection of Cu2+. The SPR peak shift from 410 nm to longer wavelengths (520 nm) demonstrated the formation of the stable Cu2+ coordination complex at both low and high Cu2+ concentrations. Figure 6a–c presents the spectral response time of the AgNPs-casein peptides at 0.64, 0.96, and 1.28 µM Cu2+ within a time frame of 20 to 120 min. Initially, the absorbance intensity increased to a maximum and then remained stable for an extended period (120 min). The stability of sensing probe is noticed as no gradual decrease or increase in the absorbance was detected at all tested concentrations of Cu2+. In contrast, in an earlier report, the realization of fractal growth of the AuNP aggregates occurred for tryptophan–Mg2+ coordination complexes [29].
![[2190-4286-9-134-6]](/bjnano/content/figures/2190-4286-9-134-6.png?scale=2.0&max-width=1024&background=FFFFFF)
Figure 6: Time course of the spectral response of silver nanoparticles in the presence of (a) 0.64, (b) 0.96, and (c) 1.28 µM Cu2+. (d) Time course of the absorbance intensity of silver nanoparticles recorded in the presence of the three different Cu2+ concentrations.
Figure 6: Time course of the spectral response of silver nanoparticles in the presence of (a) 0.64, (b) 0.96,...
As can be seen in Figure 6d, the absorbance intensity at 520 nm increased rapidly within 1 s after exposure to different dosages of Cu2+ (0.64, 0.96, and 1.28 µM) and subsequently reached a stable value. In the presence of Cu2+, aggregation and a red appearance occurred almost within the fraction of a second. Therefore, the absorbance probe ensured the rapid detection of Cu2+, similar to fluorescent probes developed for the analysis of Fe3+ [30].
Cu2+-spiked water samples analysis
Cu2+ spiked water samples were readily used to determine the copper content and the recoveries of the known amount of Cu2+ in the samples were in between 98–110% (Figure 7). The Cu2+-spiked water samples (0.96 µM) caused large red-shift in the absorption spectra and dramatic change in visual appearance of yellow to red suggests possibilities in implementing both colorimetric and spectrophotometric measurements (Figure 7). Levels of Cu2+ in Cu2+-spiked tap water (2.9 μM) and pond water (3.2 μM) were measured using the designed method and compared with literature values obtained by alternative techniques [31]. The tested Cu2+ contents were in a reasonable range relative to the literature data discussed in Table 1 for gold NPs [32], and also with atomic absorption spectroscopy [33], and inductively coupled plasma mass spectroscopy [34].
![[2190-4286-9-134-7]](/bjnano/content/figures/2190-4286-9-134-7.png?scale=2.0&max-width=1024&background=FFFFFF)
Figure 7: The recoveries of the known amount of Cu2+ in Cu2+-spiked water samples demonstrates reliability of the established sensing probe.
Figure 7: The recoveries of the known amount of Cu2+ in Cu2+-spiked water samples demonstrates reliability of...
Conclusion
Functionalized AgNPs were synthesized using casein peptides as the reducing and stabilizing agent in an aqueous medium. The formation of AgNPs and the effect of centrifugation on their stability were verified by measuring the SPR spectra using a UV–vis spectrophotometer. This paper designates the sensing application of water-dispersible casein peptide-capped AgNPs as a sensing probe for the colorimetric detection of Cu2+ ions in water samples, and the color change is visible with the naked eye. When compared with alternative reported methods, the proposed procedure is intrinsically more sensitive, due to the direct coordination of divalent Cu ions using the peptide coordination complex. Therefore, the AgNPs–casein peptide system offers a new possibility for the rapid and sensitive real-time detection of Cu2+. The AgNPs–casein peptide system holds great potential for developing practical applications to detect Cu2+ in various types of drinking and non-drinking water samples, without involving expensive analytical instruments.
Experimental
Chemicals
AgNO3 and casein peptide (vitamin-free) were purchased from Sigma-Aldrich (Korea). NaOH and NaCl were obtained from Dae Jung Chemicals Korea. Standard solutions, including Cu2+, Mn2+, Mo3+, Na+, Cr3+, Hg2+, Ni2+, Ca2+, K+, Cs+, Li+, As+, PO43–, NH4, and NO3− were obtained from Kanto Chemicals. All reagents were of analytical grade and used without any further treatment. Ultrapure distilled water was prepared freshly and used throughout the synthesis and sensing experiments.
Synthesis of casein peptide-capped AgNPs
The casein peptide-capped AgNPs were prepared as follows: Briefly, 16.9 mL ultrapure water was added into a series of 50 mL glass tubes, followed by 2 mL casein peptide stock solution (0.6% w/v). This reaction mixture was then preheated at 95 °C before 1 mL AgNO3 (20 mM) was added. The freshly prepared AgNPs were purified from the reducing and stabilizing agents (casein peptides) involved in the synthesis, by using centrifugation (10000 rpm for 12 min). The stability of the casein peptide-capped AgNPs was revealed after removal of excess casein peptides from the AgNPs solution, by observing the surface plasmon resonance (λmax) and bandwidth (Δλ), before and after centrifugation of the AgNPs.
Characterization of AgNPs
The UV–vis spectra of the AgNPs in the presence and absence of Cu2+ were observed, using an Optizen 2120 spectrophotometer (Korea). To reveal the stability of the centrifuged AgNPs, λmax and Δλ were recorded after each addition of 0.25 mL distilled water to 1 mL of AgNPs stock solution. HR-TEM samples were prepared using carbon-coated copper grids. Shape, size-distribution, and images were observed on Tecnai G2 (FEI Company, USA). The XRD measurements were performed using a thin film sample containing the AgNPs (Rigaku Ultima-IV diffractometer, Cu Kα radiation). The centrifuged AgNPs were examined by FTIR spectroscopy using a Thermo Scientific Nicolet iS5 FTIR spectrometer equipped with a attenuated total reflectance tool, in the 1000–4000 cm−1 wavelength range at 0.48 cm−1 resolution.
Selectivity
To assess the selectivity of the proposed method, coordination of the functionalized AgNPs was tested with various ions, including Cu2+, Mn2+, Mo3+, Na+, Cr3+, Hg2+, Ni2+, Ca2+, K+, Cs+, Li+, As+, PO3–, NH4, and NO3−. Typically, one species was added to distilled water in the presence of 200 μL of AgNPs stock solution at a final concentration of 100 ppb for a 20 min reaction time at ambient temperature, and then, UV–vis spectra were collected in the range 350–800 nm.
Effect of acidic and alkaline conditions and ionic strength
The effect of acidic and alkaline conditions and ionic strength was studied as follows: 200 μL of the AgNPs stock solution was exposed to different concentrations of diluted HCl (0.1–0.6 mM), NaOH (0.1–0.6 mM), and NaCl (1.0–3.5 mM). The absorbance of the solutions was measured at 410 nm after 5 min. Then, Cu2+ (1.28 µM) was added, respectively. The solutions were again incubated for another 5 min before the absorbance of the suspensions was re-measured at 410 nm.
Detection of Cu2+ concentration
The casein peptide-capped AgNPs were used in the sensing experiment at low concentration/optical density (ca. 0.2–0.8 OD). Several different Cu2+ concentrations were tested using AgNPs solutions in disposable UV–vis cuvettes after adjusting the volume (1 mL) with distilled water. The total incubation volume of the stock AgNPs solution comprised 0.05, 0.1, and 0.2 mL, respectively, to enable detection over a wide range (0.08–1.44 µM Cu2+). After the coordination reaction was performed at 24 °C for 20 min, the spectral shift was detected by UV–vis spectroscopy, and the solution color was observed with the naked eye.
Real-time UV–vis response of AgNPs toward Cu2+
The AgNPs solution (200 µL) was incubated with 0.64, 0.96 and 1.28 µM Cu2+ in distilled water. At different reaction times, the stability behavior of the coordination product was studied by measuring the absorption spectra of the reaction solutions. Similarly, the rapid absorbance response of AgNPs aggregates was observed immediately after the Cu2+ coordination reaction, and the absorbance of the reaction solutions was measured at 520 nm. Subsequently, the rapid absorbance responses were determined every 5 s for a total time of 30 s at the three different Cu2+ concentrations.
Spiked water samples analysis
UV–vis absorbance of the AgNPs was recorded at 520 nm after reacting various water samples containing Cu2+. Typically, 200 μL of the AgNPs solution was treated with Cu2+ spiked water samples for 20 min. The absorbance of the AgNP suspensions was recorded after 20 min at 520 nm. A plot of the concentration versus absorbance intensity was prepared, and used as the standard graph for the determination of Cu2+ concentrations present in the water samples.
References
-
Hoang, T. C.; Pryor, R. L.; Rand, G. M.; Frakes, R. A. Ecotoxicol. Environ. Saf. 2011, 74, 1011–1020. doi:10.1016/j.ecoenv.2011.01.015
Return to citation in text: [1] -
Ginocchio, R.; Sánchez, P.; de la Fuente, L. M.; Camus, I.; Bustamante, E.; Silva, Y.; Urrestarazu, P.; Torres, J. C.; Rodríguez, P. H. Environ. Toxicol. Chem. 2006, 25, 712–718. doi:10.1897/05-105R.1
Return to citation in text: [1] -
Torres, R.; Lapidus, G. T. Waste Manage. (Oxford, U. K.) 2016, 57, 131–139. doi:10.1016/j.wasman.2016.03.010
Return to citation in text: [1] -
Sacristán, D.; Carbó, E. Copper Contamination in Mediterranean Agricultural Soils: Soil Quality Standards and Adequate Soil Management Practices for Horticultural Crops. In Soil Contamination - Current Consequences and Further Solutions, Larramendy, M. L.; Soloneski, S., Eds.; InTech: Rijeka, Croatia, 2016. doi:10.5772/64771
Return to citation in text: [1] -
Yao, Z.; Yang, Y.; Chen, X.; Hu, X.; Zhang, L.; Liu, L.; Zhao, Y.; Wu, H.-C. Anal. Chem. 2013, 85, 5650–5653. doi:10.1021/ac401386v
Return to citation in text: [1] [2] [3] [4] -
Wen, T.; Qu, F.; Li, N. B.; Luo, H. Q. Arabian J. Chem. 2017, 10, S1680–S1685. doi:10.1016/j.arabjc.2013.06.013
Return to citation in text: [1] -
Zhang, Z.; Chen, Z.; Qu, C.; Chen, L. Langmuir 2014, 30, 3625–3630. doi:10.1021/la500106a
Return to citation in text: [1] -
Jin, L.-H.; Han, C.-S. Anal. Chem. 2014, 86, 7209–7213. doi:10.1021/ac501515f
Return to citation in text: [1] -
Yang, P.; Zhao, Y.; Lu, Y.; Xu, Q.-Z.; Xu, X.-W.; Dong, L.; Yu, S.-H. ACS Nano 2011, 5, 2147–2154. doi:10.1021/nn103352b
Return to citation in text: [1] -
Chan, Y.-H.; Chen, J.; Liu, Q.; Wark, S. E.; Son, D. H.; Batteas, J. D. Anal. Chem. 2010, 82, 3671–3678. doi:10.1021/ac902985p
Return to citation in text: [1] -
Xu, X.; Daniel, W. L.; Wei, W.; Mirkin, C. A. Small 2010, 6, 623–626. doi:10.1002/smll.200901691
Return to citation in text: [1] [2] [3] -
Han, K. N.; Choi, J.-S.; Kwon, J. Sci. Rep. 2017, 7, 2806. doi:10.1038/s41598-017-02948-x
Return to citation in text: [1] -
Pan, N.; Zhu, Y.; Wu, L.-L.; Xie, Z.-J.; Xue, F.; Peng, C.-F. Anal. Methods 2016, 8, 7531–7536. doi:10.1039/C6AY01789D
Return to citation in text: [1] -
Li, L.; Yuan, Z.; Peng, X.; Li, L.; He, J.; Zhang, Y. J. Chin. Chem. Soc. 2014, 61, 1371–1376. doi:10.1002/jccs.201400188
Return to citation in text: [1] -
Hussain, I.; Singh, N. B.; Singh, A.; Singh, H.; Singh, S. C. Biotechnol. Lett. 2016, 38, 545–560. doi:10.1007/s10529-015-2026-7
Return to citation in text: [1] -
Kim, D.-Y.; Kim, M.; Shinde, S.; Saratale, R. G.; Sung, J.-S.; Ghodake, G. ACS Sustainable Chem. Eng. 2017, 5, 7678–7689. doi:10.1021/acssuschemeng.7b01101
Return to citation in text: [1] -
Habibi, N.; Kamaly, N.; Memic, A.; Shafiee, H. Nano Today 2016, 11, 41–60. doi:10.1016/j.nantod.2016.02.004
Return to citation in text: [1] -
Zorn, G.; Liu, L.-H.; Árnadóttir, L.; Wang, H.; Gamble, L. J.; Castner, D. G.; Yan, M. J. Phys. Chem. C 2014, 118, 376–383. doi:10.1021/jp409338y
Return to citation in text: [1] -
Pang, J.; Liu, H.; Li, J.; Zhai, T.-T.; Wang, K. ChemPhysChem, in press.
Return to citation in text: [1] -
Maus, L.; Dick, O.; Bading, H.; Spatz, J. P.; Fiammengo, R. ACS Nano 2010, 4, 6617–6628. doi:10.1021/nn101867w
Return to citation in text: [1] -
Hu, Y.; Xu, W.; Li, G.; Xu, L.; Song, A.; Hao, J. Langmuir 2015, 31, 8599–8605. doi:10.1021/acs.langmuir.5b02036
Return to citation in text: [1] -
Imaz, I.; Rubio-Martínez, M.; Saletra, W. J.; Amabilino, D. B.; Maspoch, D. J. Am. Chem. Soc. 2009, 131, 18222–18223. doi:10.1021/ja908721t
Return to citation in text: [1] -
Burt, J. L.; Gutiérrez-Wing, C.; Miki-Yoshida, M.; José-Yacamán, M. Langmuir 2004, 20, 11778–11783. doi:10.1021/la048287r
Return to citation in text: [1] -
Mehta, V. N.; Kumar, M. A.; Kailasa, S. K. Ind. Eng. Chem. Res. 2013, 52, 4414–4420. doi:10.1021/ie302651f
Return to citation in text: [1] [2] -
Bertrand, F.; German, S.-A.; Anwar, A.; Irune, V.; Gemma, B.; Yolanda, R. D. M.; Lennart, B. Sci. Technol. Adv. Mater. 2013, 14, 023001.
Return to citation in text: [1] -
Liu, J.; Lu, Y. Chem. Commun. 2007, 4872–4874. doi:10.1039/b712421j
Return to citation in text: [1] [2] [3] [4] -
Amiri, L.; Movahed, A.; Iranpour, D.; Ostovar, A.; Raeisi, A.; Keshtkar, M.; Hajian, N.; Dobaradaran, S. Data Brief 2016, 9, 4–7. doi:10.1016/j.dib.2016.08.021
Return to citation in text: [1] -
Stadlbauer, S.; Riechers, A.; Späth, A.; König, B. Chem. – Eur. J. 2008, 14, 2536–2541. doi:10.1002/chem.200701442
Return to citation in text: [1] -
Kim, D.-Y.; Shinde, S.; Ghodake, G. Sci. Rep. 2017, 7, 3966. doi:10.1038/s41598-017-04359-4
Return to citation in text: [1] -
Li, J.; Wang, Q.; Guo, Z.; Ma, H.; Zhang, Y.; Wang, B.; Bin, D.; Wei, Q. Sci. Rep. 2016, 6, 23558. doi:10.1038/srep23558
Return to citation in text: [1] -
Ratnarathorn, N.; Chailapakul, O.; Henry, C. S.; Dungchai, W. Talanta 2012, 99, 552–557. doi:10.1016/j.talanta.2012.06.033
Return to citation in text: [1] -
Wang, Y.; Wang, L.; Su, Z.; Xue, J.; Dong, J.; Zhang, C.; Hua, X.; Wang, M.; Liu, F. Sci. Rep. 2017, 7, 41557. doi:10.1038/srep41557
Return to citation in text: [1] -
Lima, R. T.; Raposo, J. L., Jr.; Virgílio, A.; Gomes Neto, J. A. Ecletica Quim. 2010, 35, 87–92. doi:10.1590/S0100-46702010000400011
Return to citation in text: [1] -
Louie, H.; Wu, M.; Di, P.; Snitch, P.; Chapple, G. J. Anal. At. Spectrom. 2002, 17, 587–591. doi:10.1039/b109121m
Return to citation in text: [1] -
Singh, G.; Arora, A.; Rani, S.; Kalra, P.; Kumar, M. ChemistrySelect 2017, 2, 3637–3647. doi:10.1002/slct.201700186
Return to citation in text: [1] -
Hua, C.; Zhang, W. H.; De Almeida, S. R. M.; Ciampi, S.; Gloria, D.; Liu, G.; Harper, J. B.; Gooding, J. J. Analyst 2012, 137, 82–86. doi:10.1039/C1AN15693D
Return to citation in text: [1] -
Wang, X.; Chen, L.; Chen, L. Microchim. Acta 2014, 181, 105–110. doi:10.1007/s00604-013-1075-7
Return to citation in text: [1] -
Yuan, X.; Chen, Y. Analyst 2012, 137, 4516–4523. doi:10.1039/c2an35956a
Return to citation in text: [1]
| 35. | Singh, G.; Arora, A.; Rani, S.; Kalra, P.; Kumar, M. ChemistrySelect 2017, 2, 3637–3647. doi:10.1002/slct.201700186 |
| 5. | Yao, Z.; Yang, Y.; Chen, X.; Hu, X.; Zhang, L.; Liu, L.; Zhao, Y.; Wu, H.-C. Anal. Chem. 2013, 85, 5650–5653. doi:10.1021/ac401386v |
| 1. | Hoang, T. C.; Pryor, R. L.; Rand, G. M.; Frakes, R. A. Ecotoxicol. Environ. Saf. 2011, 74, 1011–1020. doi:10.1016/j.ecoenv.2011.01.015 |
| 6. | Wen, T.; Qu, F.; Li, N. B.; Luo, H. Q. Arabian J. Chem. 2017, 10, S1680–S1685. doi:10.1016/j.arabjc.2013.06.013 |
| 31. | Ratnarathorn, N.; Chailapakul, O.; Henry, C. S.; Dungchai, W. Talanta 2012, 99, 552–557. doi:10.1016/j.talanta.2012.06.033 |
| 5. | Yao, Z.; Yang, Y.; Chen, X.; Hu, X.; Zhang, L.; Liu, L.; Zhao, Y.; Wu, H.-C. Anal. Chem. 2013, 85, 5650–5653. doi:10.1021/ac401386v |
| 20. | Maus, L.; Dick, O.; Bading, H.; Spatz, J. P.; Fiammengo, R. ACS Nano 2010, 4, 6617–6628. doi:10.1021/nn101867w |
| 32. | Wang, Y.; Wang, L.; Su, Z.; Xue, J.; Dong, J.; Zhang, C.; Hua, X.; Wang, M.; Liu, F. Sci. Rep. 2017, 7, 41557. doi:10.1038/srep41557 |
| 4. | Sacristán, D.; Carbó, E. Copper Contamination in Mediterranean Agricultural Soils: Soil Quality Standards and Adequate Soil Management Practices for Horticultural Crops. In Soil Contamination - Current Consequences and Further Solutions, Larramendy, M. L.; Soloneski, S., Eds.; InTech: Rijeka, Croatia, 2016. doi:10.5772/64771 |
| 17. | Habibi, N.; Kamaly, N.; Memic, A.; Shafiee, H. Nano Today 2016, 11, 41–60. doi:10.1016/j.nantod.2016.02.004 |
| 29. | Kim, D.-Y.; Shinde, S.; Ghodake, G. Sci. Rep. 2017, 7, 3966. doi:10.1038/s41598-017-04359-4 |
| 2. | Ginocchio, R.; Sánchez, P.; de la Fuente, L. M.; Camus, I.; Bustamante, E.; Silva, Y.; Urrestarazu, P.; Torres, J. C.; Rodríguez, P. H. Environ. Toxicol. Chem. 2006, 25, 712–718. doi:10.1897/05-105R.1 |
| 3. | Torres, R.; Lapidus, G. T. Waste Manage. (Oxford, U. K.) 2016, 57, 131–139. doi:10.1016/j.wasman.2016.03.010 |
| 18. | Zorn, G.; Liu, L.-H.; Árnadóttir, L.; Wang, H.; Gamble, L. J.; Castner, D. G.; Yan, M. J. Phys. Chem. C 2014, 118, 376–383. doi:10.1021/jp409338y |
| 30. | Li, J.; Wang, Q.; Guo, Z.; Ma, H.; Zhang, Y.; Wang, B.; Bin, D.; Wei, Q. Sci. Rep. 2016, 6, 23558. doi:10.1038/srep23558 |
| 5. | Yao, Z.; Yang, Y.; Chen, X.; Hu, X.; Zhang, L.; Liu, L.; Zhao, Y.; Wu, H.-C. Anal. Chem. 2013, 85, 5650–5653. doi:10.1021/ac401386v |
| 13. | Pan, N.; Zhu, Y.; Wu, L.-L.; Xie, Z.-J.; Xue, F.; Peng, C.-F. Anal. Methods 2016, 8, 7531–7536. doi:10.1039/C6AY01789D |
| 14. | Li, L.; Yuan, Z.; Peng, X.; Li, L.; He, J.; Zhang, Y. J. Chin. Chem. Soc. 2014, 61, 1371–1376. doi:10.1002/jccs.201400188 |
| 37. | Wang, X.; Chen, L.; Chen, L. Microchim. Acta 2014, 181, 105–110. doi:10.1007/s00604-013-1075-7 |
| 11. | Xu, X.; Daniel, W. L.; Wei, W.; Mirkin, C. A. Small 2010, 6, 623–626. doi:10.1002/smll.200901691 |
| 15. | Hussain, I.; Singh, N. B.; Singh, A.; Singh, H.; Singh, S. C. Biotechnol. Lett. 2016, 38, 545–560. doi:10.1007/s10529-015-2026-7 |
| 16. | Kim, D.-Y.; Kim, M.; Shinde, S.; Saratale, R. G.; Sung, J.-S.; Ghodake, G. ACS Sustainable Chem. Eng. 2017, 5, 7678–7689. doi:10.1021/acssuschemeng.7b01101 |
| 8. | Jin, L.-H.; Han, C.-S. Anal. Chem. 2014, 86, 7209–7213. doi:10.1021/ac501515f |
| 9. | Yang, P.; Zhao, Y.; Lu, Y.; Xu, Q.-Z.; Xu, X.-W.; Dong, L.; Yu, S.-H. ACS Nano 2011, 5, 2147–2154. doi:10.1021/nn103352b |
| 10. | Chan, Y.-H.; Chen, J.; Liu, Q.; Wark, S. E.; Son, D. H.; Batteas, J. D. Anal. Chem. 2010, 82, 3671–3678. doi:10.1021/ac902985p |
| 36. | Hua, C.; Zhang, W. H.; De Almeida, S. R. M.; Ciampi, S.; Gloria, D.; Liu, G.; Harper, J. B.; Gooding, J. J. Analyst 2012, 137, 82–86. doi:10.1039/C1AN15693D |
| 7. | Zhang, Z.; Chen, Z.; Qu, C.; Chen, L. Langmuir 2014, 30, 3625–3630. doi:10.1021/la500106a |
| 12. | Han, K. N.; Choi, J.-S.; Kwon, J. Sci. Rep. 2017, 7, 2806. doi:10.1038/s41598-017-02948-x |
| 24. | Mehta, V. N.; Kumar, M. A.; Kailasa, S. K. Ind. Eng. Chem. Res. 2013, 52, 4414–4420. doi:10.1021/ie302651f |
| 24. | Mehta, V. N.; Kumar, M. A.; Kailasa, S. K. Ind. Eng. Chem. Res. 2013, 52, 4414–4420. doi:10.1021/ie302651f |
| 21. | Hu, Y.; Xu, W.; Li, G.; Xu, L.; Song, A.; Hao, J. Langmuir 2015, 31, 8599–8605. doi:10.1021/acs.langmuir.5b02036 |
| 22. | Imaz, I.; Rubio-Martínez, M.; Saletra, W. J.; Amabilino, D. B.; Maspoch, D. J. Am. Chem. Soc. 2009, 131, 18222–18223. doi:10.1021/ja908721t |
| 33. | Lima, R. T.; Raposo, J. L., Jr.; Virgílio, A.; Gomes Neto, J. A. Ecletica Quim. 2010, 35, 87–92. doi:10.1590/S0100-46702010000400011 |
| 23. | Burt, J. L.; Gutiérrez-Wing, C.; Miki-Yoshida, M.; José-Yacamán, M. Langmuir 2004, 20, 11778–11783. doi:10.1021/la048287r |
| 34. | Louie, H.; Wu, M.; Di, P.; Snitch, P.; Chapple, G. J. Anal. At. Spectrom. 2002, 17, 587–591. doi:10.1039/b109121m |
| 11. | Xu, X.; Daniel, W. L.; Wei, W.; Mirkin, C. A. Small 2010, 6, 623–626. doi:10.1002/smll.200901691 |
| 11. | Xu, X.; Daniel, W. L.; Wei, W.; Mirkin, C. A. Small 2010, 6, 623–626. doi:10.1002/smll.200901691 |
| 27. | Amiri, L.; Movahed, A.; Iranpour, D.; Ostovar, A.; Raeisi, A.; Keshtkar, M.; Hajian, N.; Dobaradaran, S. Data Brief 2016, 9, 4–7. doi:10.1016/j.dib.2016.08.021 |
| 28. | Stadlbauer, S.; Riechers, A.; Späth, A.; König, B. Chem. – Eur. J. 2008, 14, 2536–2541. doi:10.1002/chem.200701442 |
| 25. | Bertrand, F.; German, S.-A.; Anwar, A.; Irune, V.; Gemma, B.; Yolanda, R. D. M.; Lennart, B. Sci. Technol. Adv. Mater. 2013, 14, 023001. |
| 5. | Yao, Z.; Yang, Y.; Chen, X.; Hu, X.; Zhang, L.; Liu, L.; Zhao, Y.; Wu, H.-C. Anal. Chem. 2013, 85, 5650–5653. doi:10.1021/ac401386v |
| 26. | Liu, J.; Lu, Y. Chem. Commun. 2007, 4872–4874. doi:10.1039/b712421j |
© 2018 Ghodake et al.; licensee Beilstein-Institut.
This is an Open Access article under the terms of the Creative Commons Attribution License (http://creativecommons.org/licenses/by/4.0), which permits unrestricted use, distribution, and reproduction in any medium, provided the original work is properly cited.
The license is subject to the Beilstein Journal of Nanotechnology terms and conditions: (https://www.beilstein-journals.org/bjnano)