Search results
Search for "thermal noise" in Full Text gives 68 result(s) in Beilstein Journal of Nanotechnology.
Subsurface imaging of flexible circuits via contact resonance atomic force microscopy
Beilstein J. Nanotechnol. 2019, 10, 1636–1647, doi:10.3762/bjnano.10.159

- the second eigenmodes, respectively. The cantilever stiffness and the free resonance frequency were calibrated by utilizing the thermal noise method while others were provided by the respective manufacturers. Multilayer contact model The axisymmetric indentation of a tip contacting with a multilayered


Review of time-resolved non-contact electrostatic force microscopy techniques with applications to ionic transport measurements
Beilstein J. Nanotechnol. 2019, 10, 617–633, doi:10.3762/bjnano.10.62

- by the detection electronics, but instead is theoretically limited only by the thermal noise of the cantilever [18]. This principle can be easily extended to ionic systems (such as those discussed previously) by simply replacing the pulsed light source with a pulsed voltage. In this case, the


Effective sensor properties and sensitivity considerations of a dynamic co-resonantly coupled cantilever sensor
Beilstein J. Nanotechnol. 2018, 9, 2546–2560, doi:10.3762/bjnano.9.237

- which becomes possible with the derived analytic expressions. Besides the description of effective sensor properties, it was studied how the thermal noise and, consequently, minimal detectable frequency shift for the co-resonantly coupled sensor represented by a coupled harmonic oscillator could be
- presented. These allow to estimate the potential performance and limitation of the system (e.g., sensitivity for a given task) before fabricating it and give new insights into the behaviour of co-resonantly coupled oscillating systems. Additionally, the treatment of thermal noise within the coupled system
- will be outlined. Sensitivity of a Cantilever Sensor The sensitivity of a cantilever sensor is given by its minimal detectable frequency shift with respect to an external interaction. It is influenced by various noise contributions which are due to the cantilever itself (e.g., thermal noise, thermal


![[Graphic 7]](/bjnano/content/inline/2190-4286-9-237-i43.svg?max-width=637&scale=1.18182) ...
...


A simple extension of the commonly used fitting equation for oscillatory structural forces in case of silica nanoparticle suspensions
Beilstein J. Nanotechnol. 2018, 9, 1095–1107, doi:10.3762/bjnano.9.101

- ) serving as colloidal probe. The spring constant of the cantilever was determined via the thermal noise method [62]. The surface of the colloidal probe and the silicon wafer form the two confining walls for the experiment. As the colloidal probe is orders of magnitude larger than their distance, the forces
- multiple factors. On one hand, identifying the factual A depends on the correct determination of the spring constant. As mentioned above this was done via the thermal noise method and already introduces an error of about 10%. On the other hand, it is highly sensitive to the correct transformation of the


Beyond Moore’s technologies: operation principles of a superconductor alternative
Beilstein J. Nanotechnol. 2017, 8, 2689–2710, doi:10.3762/bjnano.8.269

- of Josephson junctions on a chip. There is no need for large-scale circuit partitioning. (iv) The bias current plays the role of the clock signal. There is no need for an SFQ clock distribution network. (v) The clock signal is not affected by thermal noise. Logical unity (or zero) is represented by a


Exploring wear at the nanoscale with circular mode atomic force microscopy
Beilstein J. Nanotechnol. 2017, 8, 2662–2668, doi:10.3762/bjnano.8.266

- stiffness was 12 N/m and 0.4 N/m, respectively (as determined by the thermal noise method [27][28]). For each set of wear experiments, a unique AFM tip was used. After each measurement, force curves on a silicon wafer were performed to verify the state of the tip. Every data point represented in Figure 5


High-stress study of bioinspired multifunctional PEDOT:PSS/nanoclay nanocomposites using AFM, SEM and numerical simulation
Beilstein J. Nanotechnol. 2017, 8, 2069–2082, doi:10.3762/bjnano.8.207

- versus distance or deflection versus distance curves were used to calibrate the amplitude of the first eigenmode or deflection in nanometers, respectively. The theoretical optical sensitivity (see Tab. 1 in [75]) was used to estimate the free amplitude of the second mode. The thermal noise method was


Measuring adhesion on rough surfaces using atomic force microscopy with a liquid probe
Beilstein J. Nanotechnol. 2017, 8, 813–825, doi:10.3762/bjnano.8.84

- of the cantilever we use the thermal noise method that appeals to the energy equipartition theorem, which states that the thermal energy contribution of each quadratic term in the Hamiltonian of a system is kBT/2 where kB is the Boltzmann constant and T is the absolute temperature. The cantilever is
- modeled as an ideal spring with a spring constant kc. The thermal noise of the mean square displacement, , allows us to determine the constant using [31][32]. With a spectral analyzer (Stanford Research Systems, 760 FFT, USA), we identify the peak corresponding to the first fundamental resonant mode of


Optimizing qPlus sensor assemblies for simultaneous scanning tunneling and noncontact atomic force microscopy operation based on finite element method analysis
Beilstein J. Nanotechnol. 2017, 8, 657–666, doi:10.3762/bjnano.8.70

- individually. This is in particular important as any change in f0 is an indication that some change in k may have taken place as well, as f0 and k are entangled properties [26]. In contrast, the thermal noise δfthermal of the measurement, which is one of the main noise sources in FM-AFM, scales with Q−1/2


Graphene–polymer coating for the realization of strain sensors
Beilstein J. Nanotechnol. 2017, 8, 21–27, doi:10.3762/bjnano.8.3

- thermal noise, as shown in the Figure 5. It is interesting to stress here that this result is obtained on a graphene/PMMA sample where the graphene layer is about 1 μm thick. This behavior can be ascribed to the high thermal conductivity of graphene compared to the other materials reported in Figure 5


Noise in NC-AFM measurements with significant tip–sample interaction
Beilstein J. Nanotechnol. 2016, 7, 1885–1904, doi:10.3762/bjnano.7.181
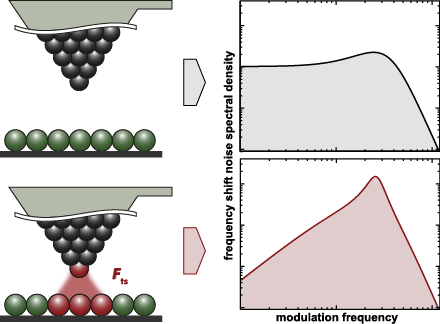
- & Astronomy, The University of Nottingham, University Park, Nottingham NG7 2RD, UK 10.3762/bjnano.7.181 Abstract The frequency shift noise in non-contact atomic force microscopy (NC-AFM) imaging and spectroscopy consists of thermal noise and detection system noise with an additional contribution from
- : amplitude noise; cantilever stiffness; closed loop; detection system noise; frequency shift noise; non-contact atomic force microscopy (NC-AFM); Q-factor; spectral analysis; thermal noise; tip–sample interaction; Introduction Non-contact atomic force microscopy (NC-AFM) [1][2] is an unmatched surface
- demodulator (mostly a phase-locked loop detector, PLL), cantilever properties and ultimately thermal noise [11]. The footing of our work are these precursor studies, and the rigorous system analysis introduced by Polesel-Maris et al. [12], showing that the frequency shift noise at close tip–sample distance is


![[Graphic 32]](/bjnano/content/inline/2190-4286-7-181-i73.png?max-width=637&scale=1.18182) wit...
wit...

![[Graphic 34]](/bjnano/content/inline/2190-4286-7-181-i75.png?max-width=637&scale=1.18182) wit...
wit...


Monolayer graphene/SiC Schottky barrier diodes with improved barrier height uniformity as a sensing platform for the detection of heavy metals
Beilstein J. Nanotechnol. 2016, 7, 1800–1814, doi:10.3762/bjnano.7.173

- to literature, graphene oxide is more toxic than pristine graphene [27], has a lower carrier mobility [28], higher thermal noise and a natural tendency to agglomerate [29]. In addition, because of the high material inhomogeneity and small domain sizes, it is complicated to fabricate sensing devices


Signal enhancement in cantilever magnetometry based on a co-resonantly coupled sensor
Beilstein J. Nanotechnol. 2016, 7, 1033–1043, doi:10.3762/bjnano.7.96

- [3][22][23], leading to three main considerations which have to be taken into account: the sensitivity of the detection setup and thermal and magnetic noise in the oscillating system. From these, thermal noise is considered to be the most dominant one [24], followed by the detector noise which is
- statistically independent of the former [25]. For our discussion, we will only focus on thermal noise. Even if only this single noise source is considered it is still an open question how the noise is distributed in the co-resonantly coupled sensor system [26]. We will therefore use the approach of discussing


![[Graphic 11]](/bjnano/content/inline/2190-4286-7-96-i21.png?max-width=637&scale=1.18182) on the interaction spring constant k3. Th...
on the interaction spring constant k3. Th...
Contact-free experimental determination of the static flexural spring constant of cantilever sensors using a microfluidic force tool
Beilstein J. Nanotechnol. 2016, 7, 492–500, doi:10.3762/bjnano.7.43

- and demonstrate that this, in combination with a thermal noise spectrum, can provide the static flexural spring constant for cantilever sensors of different geometric shapes over a wide range of spring constant values (≈0.8–160 N/m). Keywords: AFM; cantilever sensors; microfluidic force tool; spring
- the photodiode signal in native units of the instrument (volts) and σ1 is the optical lever sensitivity for thermal oscillations [34][35]. Knowledge of σ1 is required for calibration of the spring constant via the thermal noise method [16]. It can be experimentally obtained, for example, from a force
- sensitivity ratio α = σ1/σ2 can still be theoretically obtained. This conversion is similar to the dynamic-to-static optical lever sensitivity conversion required in the thermal noise method [33]. From the photodiode signal, the deflection for a total force and the peak area under a thermal noise curve are


![[Graphic 28]](/bjnano/content/inline/2190-4286-7-43-i34.png?max-width=637&scale=1.18182) value for cantilever NCHV. The dashed line indicates the mean
value for cantilever NCHV. The dashed line indicates the mean ![[Graphic 29]](/bjnano/content/inline/2190-4286-7-43-i35.png?max-width=637&scale=1.18182) value for ...
value for ...
Active multi-point microrheology of cytoskeletal networks
Beilstein J. Nanotechnol. 2016, 7, 484–491, doi:10.3762/bjnano.7.42

- , amplitude A and direction θ. Consequently, the motion of the reference particle is a superposition of thermal noise and the sinusoidal oscillation. The motion of the response particles is also a superposition of thermal noise, the same sinusoidal function and additionally several terms of the sinusoidal


Length-extension resonator as a force sensor for high-resolution frequency-modulation atomic force microscopy in air
Beilstein J. Nanotechnol. 2016, 7, 432–438, doi:10.3762/bjnano.7.38

- temperature and humidity sensor (SHT71, Sensirion AG [22]). Basic image processing (e.g., levelling) is done with the Gwyddion software [23]. To determine the sensitivity S of the LER a thermal noise spectrum was acquired around the resonance frequency (Figure 1c). Integration over the noise power spectral
- ) Thermal noise spectrum (black) of a LER with a SSS-NCHR tip attached and a fit of a damped harmonic oscillator (red). The right axis is obtained by multiplying the left axis with the inverse sensitivity 1/S = 2.2 nm/Vrms. Parameters derived from the fit: Q = 17,000, f0 = 999.3 kHz. The detector noise


Molecular machines operating on the nanoscale: from classical to quantum
Beilstein J. Nanotechnol. 2016, 7, 328–350, doi:10.3762/bjnano.7.31

- ; nanoscale friction and thermal noise; quantum effects; thermodynamic efficiency; Introduction A myriad of minuscule molecular nanomotors (not visible in standard, classical, optical microscopes) operate in living cells and perform various tasks. These utilize metabolic energy, for example, the energy
- forever even at thermal equilibrium. The energy necessary for this is supplied by thermal fluctuations. Therefore, friction and thermal noise are intimately related, which is the physical context of the fluctuation–dissipation theorem [10]. Statistical mechanics allows the development of a coherent
- the Wiener–Khinchin theorem, , as S(ω) = 2kBTJ(ω)/ω. The strict ohmic model, J(ω) = ηω, without a frequency cutoff, corresponds to the standard Langevin equation: with uncorrelated white Gaussian thermal noise, . Such noise is singular, and its mean-square amplitude is infinite. This is, of course, a

![[Graphic 40]](/bjnano/content/inline/2190-4286-7-31-i86.png?max-width=637&scale=1.18182) with depth ε. Bias Δμ < 0 per one rotation tur...
with depth ε. Bias Δμ < 0 per one rotation tur...

![[Graphic 48]](/bjnano/content/inline/2190-4286-7-31-i94.png?max-width=637&scale=1.18182) , for the most asymmetric sawtooth mod...
, for the most asymmetric sawtooth mod...


Determination of Young’s modulus of Sb2S3 nanowires by in situ resonance and bending methods
Beilstein J. Nanotechnol. 2016, 7, 278–283, doi:10.3762/bjnano.7.25

- BIO) using the thermal noise method [36]. Results and Discussion Figure 1a,b shows SEM images of Sb2S3 nanowires with a length of 10 μm and a radius of 67 nm with applied AC voltage at two different frequencies, where one is far from the resonance and second matches resonant excitation. The force


Kelvin probe force microscopy for local characterisation of active nanoelectronic devices
Beilstein J. Nanotechnol. 2015, 6, 2193–2206, doi:10.3762/bjnano.6.225

- below the thermal noise limited bandwidth of the cantilever [24], but the modulation induced by rough surfaces as well as the desired scan bandwidth establish lower limits. Furthermore, the sideband transfer function explains the higher resolution obtained by heterodyne amplitude-modulated KFM [47]. In


![[Graphic 33]](/bjnano/content/inline/2190-4286-6-225-i48.png?max-width=637&scale=1.18182) for different modulation amplitu...
for different modulation amplitu...


Capillary and van der Waals interactions on CaF2 crystals from amplitude modulation AFM force reconstruction profiles under ambient conditions
Beilstein J. Nanotechnol. 2015, 6, 809–819, doi:10.3762/bjnano.6.84

- were used (Nanosensors PPP-CONTR). The cantilever spring constant was calibrated in situ using the thermal noise method implemented in the MFP-3D microscope and the deflection in volts converted to deflection in nanometers by means of sensitivity calculations on dry CaF2 crystals. Thin slices of CaF2


Mechanical properties of MDCK II cells exposed to gold nanorods
Beilstein J. Nanotechnol. 2015, 6, 223–231, doi:10.3762/bjnano.6.21

- Instrument AG, Berlin, Germany) with HEPES buffered culture medium kept at 37 °C. AFM images were performed in contact mode. Before force spectroscopy measurements the exact spring constant of the used cantilever was determined by thermal noise analysis using software provided by the manufacturer. Local


Increasing throughput of AFM-based single cell adhesion measurements through multisubstrate surfaces
Beilstein J. Nanotechnol. 2015, 6, 157–166, doi:10.3762/bjnano.6.15

- experiments. 200 µm-long, tip-less, v-shaped, silicon nitride cantilevers having nominal spring constants of 0.06 N/m (NP-O, Bruker) were used for adhesion measurements. The spring constant of every cantilever was determined prior to the experiment using the thermal noise method. Prior to experiments, cells


Multifunctional layered magnetic composites
Beilstein J. Nanotechnol. 2015, 6, 134–148, doi:10.3762/bjnano.6.13

- of the cantilever from the raw displacement data. The spring constant of the cantilever (0.56 N/m) was deduced from its thermal noise spectrum prior to the attachment of the colloidal probe [66]. Magnetite formation inside a gelatin gel matrix (grey) that is placed inside the chitin scaffold of


High-frequency multimodal atomic force microscopy
Beilstein J. Nanotechnol. 2014, 5, 2459–2467, doi:10.3762/bjnano.5.255

- tune method and a FastScan A cantilever in air, we measured a baseline noise level of 45 fm/ for our deflection readout. Figure 3c shows the thermal noise peak of the first flexural mode, while Figure 3d shows the thermal noise peak of the second flexural mode. We expect that further optimization of
- 6.0 for the FastScan A and FastScan C cantilevers, respectively. The spring constants of the two cantilevers are calibrated by using the thermal noise method. We measure k0 = 15.4 N·m−1, k1 = 470 N·m−1 for the first and second eigenmode of the used FastScan A and k0 = 0.85 N·m−1, k1 = 94 N·m−1
- ), torsional resonances can be excited (red curve). Visible are the first three flexural modes (f0, f1 and f2), the first two torsional modes (t1 and t2), and a complex higher resonant mode (hm). c) Thermal noise peak of the first flexural mode of a FastScan A cantilever, with a baseline noise floor of 45 fm


Modification of a single-molecule AFM probe with highly defined surface functionality
Beilstein J. Nanotechnol. 2014, 5, 2122–2128, doi:10.3762/bjnano.5.221

- . When the probe is retracted, the force to break the hydrogen bonds should be detectable. The force spectroscopy experiments were carried out in contact mode at room temperature in isopropanol. The spring constant of the AFM probes were calibrated by using the thermal noise method [30]. The measured


