Search results
Search for "fitting" in Full Text gives 523 result(s) in Beilstein Journal of Nanotechnology. Showing first 200.
An iridescent film of porous anodic aluminum oxide with alternatingly electrodeposited Cu and SiO2 nanoparticles
Beilstein J. Nanotechnol. 2019, 10, 735–745, doi:10.3762/bjnano.10.73

- only to a very little extent. The Nyquist and Bode diagrams were fitted using the ZView software, and after a careful adjustment, equivalent circuit diagrams were obtained with the lowest fitting error (Supporting Information File 1, Figure S3). As presented in Supporting Information File 1, Figure S3


Outstanding chain-extension effect and high UV resistance of polybutylene succinate containing amino-acid-modified layered double hydroxides
Beilstein J. Nanotechnol. 2019, 10, 684–695, doi:10.3762/bjnano.10.68

- fitting and extrapolation of the Cole–Cole representation to the x-axis (η′ at η″ = 0), the Newtonian zero-shear viscosity η0 can be calculated using Equation 1, which reflects even small changes in molecular mass. The effect of 5 wt % Mg2Al LDH filler on the PBS chain extension is presented as η”–η’ Cole


Commercial polycarbonate track-etched membranes as substrates for low-cost optical sensors
Beilstein J. Nanotechnol. 2019, 10, 677–683, doi:10.3762/bjnano.10.67

- (Scharlab, Barcelona, Spain) are placed on it. The reflectivity measurements were performed in the NIR range (1110–2500 nm) with a resolution of 4 cm−1. To enhance the SNR, 30 scans were collected every minute to perform a continuous monitoring of the spectrum shift evolution. For the fitting and the


Review of time-resolved non-contact electrostatic force microscopy techniques with applications to ionic transport measurements
Beilstein J. Nanotechnol. 2019, 10, 617–633, doi:10.3762/bjnano.10.62

- operating (scanning) parameters (bandwidth of ca. 100 Hz) the PLL response will not affect the extracted values obtained from directly fitting the data. However, as the relaxation time approaches the response time of the PLL, the output signal will become a convolution of the PLL response function and the
- directly calculated from the fit results. Note that since the frequency shift is quadratic in voltage and it is the voltage being changed here, we must first take the square root of the data before fitting. The results are shown in Figure 2b where the shaded area is the region for which τ* < τPLL ≈ 600 μs
- dependence of the system after a bias is applied, which is typically a stretched exponential as in Equation 1. Although this is in principle feasible, the main challenge is to perform the fitting. We attempted to fit the data in Figure 3 to a stretched exponential with an additional parameter, β, which


Widening of the electroactivity potential range by composite formation – capacitive properties of TiO2/BiVO4/PEDOT:PSS electrodes in contact with an aqueous electrolyte
Beilstein J. Nanotechnol. 2019, 10, 483–493, doi:10.3762/bjnano.10.49

- and 300 W. XPS measurements were performed at room temperature under ultrahigh-vacuum conditions, with pressures below 1.1 × 10⁻⁸ mbar. Data analysis was performed with the CASA XPS software package using Shirley background subtraction and a least-squares Gaussian–Lorentzian curve fitting algorithm


Temperature-dependent Raman spectroscopy and sensor applications of PtSe2 nanosheets synthesized by wet chemistry
Beilstein J. Nanotechnol. 2019, 10, 467–474, doi:10.3762/bjnano.10.46

- fitting the Lorentzian function to the A1g and Eg modes. The temperature coefficient can be calculated by Equation 1 [29]: where ω0 is the peak position of the A1g and Eg mode at zero Kelvin, χ is the temperature coefficient of the A1g and Eg modes, and ω is a Raman phonon frequency. The slope of the


Reduced graphene oxide supported C3N4 nanoflakes and quantum dots as metal-free catalysts for visible light assisted CO2 reduction
Beilstein J. Nanotechnol. 2019, 10, 448–458, doi:10.3762/bjnano.10.44

- impurity elements are found (Figure 3a). Figure 3b shows the fit to the C 1s peak of the GCN-5 hybrid. The fitting of the C 1s spectrum shows four major deconvoluted peaks related to the carbon states of rGO and g-C3N4. The sharp peaks at binding energies of 285.04, 287.03, 288.52, and 289.6 eV observed in


Improving control of carbide-derived carbon microstructure by immobilization of a transition-metal catalyst within the shell of carbide/carbon core–shell structures
Beilstein J. Nanotechnol. 2019, 10, 419–427, doi:10.3762/bjnano.10.41

- spectra were taken using Jobin Yvon HR 800 with a HeNe laser (633 nm and 20 mW power). Peak deconvolution of Raman spectra was carried by peak fitting with four Lorentzian/Gaussian functions as described in [15]. Energy-dispersive spectroscopy (EDS) measurements were performed on a scanning electron


Sub-wavelength waveguide properties of 1D and surface-functionalized SnO2 nanostructures of various morphologies
Beilstein J. Nanotechnol. 2019, 10, 379–388, doi:10.3762/bjnano.10.37

- temperature-dependent PL of the belt, cylinder, and square shaped NWs, respectively. It is clear that there are six peaks at 1.84, 1.97, 2.1, 2.3, 2.5, and 2.75 eV, which overlap with each other in all three different morphological NW types. Gaussian fitting of these peaks is given in the Supporting
- Information File 1 (Figure S4). Figure S4a–c shows the Gaussian fitting of the PL spectra recorded at 80 K for belt, cylinder, and square shaped NWs, respectively. Irrespective of the morphology, the PL spectra are uniform for all NWs. An increase in PL intensity with decreasing temperature (Figure 8a–c
- square-shaped NWs) at the temperatures 300 K, 160 K and 80 K were calculated. The results from Gaussian fitting of these curves are given in the Supporting Information File 1 (Figure S5). At 300 K, the PL peak at 1.97 eV is found to contribute the most and is around 34% of the total area among all peaks


Intuitive human interface to a scanning tunnelling microscope: observation of parity oscillations for a single atomic chain
Beilstein J. Nanotechnol. 2019, 10, 337–348, doi:10.3762/bjnano.10.33

- atoms i and j, r0 is the equilibrium distance, and ζ, q, A and p are parameters that can be determined by fitting bulk material properties to experimental values. The parameters used for the results shown in this manuscript are: r0 = 2.884 Å, ζ = 1.8184 eV, A = 0.20967 eV, q = 4.03 eV and p = 10.145 eV
- to think about the correct description of the interaction between the metallic system and the molecules. Typically MD is used for molecules in solution or for solid-state bulk materials [57], rarely for metal surfaces in contact with molecules [58]. The right way to go would be fitting a force field


A Ni(OH)2 nanopetals network for high-performance supercapacitors synthesized by immersing Ni nanofoam in water
Beilstein J. Nanotechnol. 2019, 10, 281–293, doi:10.3762/bjnano.10.27

- mainly consists of Ti4+ and Zr4+ oxides. On the other hand, Figure 4d and Figure 4e reveal the Ni 2p3/2 and O 1s peaks obtained from the as-spun alloy and as-dealloyed alloy before and after immersion in deionized water. The O 1s region analyzed by using a Gaussian fitting method (Figure 4e) shows three


Magnetic-field sensor with self-reference characteristic based on a magnetic fluid and independent plasmonic dual resonances
Beilstein J. Nanotechnol. 2019, 10, 247–255, doi:10.3762/bjnano.10.23
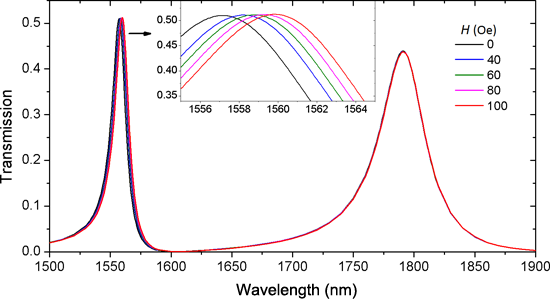
- saturation value nsat. nMF follows the Langevin function [2]: In Equation 15, H is the magnetic field strength, T represents the temperature, and α is a fitting parameter. Hc is the critical field (ca. 30 Oe). n0 denotes the refractive index of the magnetic fluid at magnetic fields lower than the critical


Interaction of Te and Se interlayers with Ag or Au nanofilms in sandwich structures
Beilstein J. Nanotechnol. 2019, 10, 238–246, doi:10.3762/bjnano.10.22

- ][28]. Data fitting was performed using Leptos 4.02 software package provided by Bruker. The electron density was simulated by a box type function. The thicknesses of the Se and Te wetting films were fitting parameters (the density of this film was fixed) and for all samples, the fit equated 2 ± 0.5 nm
- . The optical thickness of the Ag and Au layers were fitted for the samples without the wetting films fabricated in the same processes, and then fixed for all other samples, while the density was left as a fitting parameter for all samples. The thickness and density of the LiF protective films were
- fitted for the samples without wetting films, and then fixed for all other samples. The wetting films/metal and metal/LiF interface roughness were left as fitting parameters. More information about XRR modeling can be found in [40] and references therein. The wide-angle X-ray diffraction (XRD


Uniform Sb2S3 optical coatings by chemical spray method
Beilstein J. Nanotechnol. 2019, 10, 198–210, doi:10.3762/bjnano.10.18

- Sb2S3 has 30 predicted Raman active modes: ΓRaman = 10Ag + 5B1g + 10B2g + 5B3g [18][20]. The Raman spectra were deconvoluted using Lorentzian fitting into vibrational bands of Sb2S3 based on the literature [12][16][21][22]. The centers of the bands of Sb2S3 in the deconvoluted Raman spectra (Table 1
- optical transmittance spectra of glass/ITO/TiO2/Sb2S3 samples. Supporting Information Supporting Information File 34: Additional XRD, EDX data, SEM images, Lorentzian fitting of Sb2S3 Raman vibrational bands, and Tauc plots. Acknowledgements We acknowledge Dr. Valdek Mikli from the Laboratory of


Mechanism of silica–lysozyme composite formation unravelled by in situ fast SAXS
Beilstein J. Nanotechnol. 2019, 10, 182–197, doi:10.3762/bjnano.10.17

- with decreasing size [38]. However, it is unlikely that U > −3kBT, and within the considered range, the value of U will not affect our fitting results. ν is a local packing parameter, i.e., a local volume fraction within the aggregate, and for the random packing of polydisperse spheres it does not
- describing the arrangement of primary particles within the composites, and A is a single collective fitting parameter in our model, which is proportional to the number density of aggregates, Nagg, and their specific surface area, SSAagg. Hence, it expresses indirectly the size/extent of the aggregates. In
- distribution of this parameter in the fitting routine. The need for such mathematical treatment is in fact a manifestation of the actual physical effects, if we consider that aReHS represents a radius of a LZM molecule. A LZM molecule can become, at least partially, heterogeneously deformed (on average, in a


Nanoporous water oxidation electrodes with a low loading of laser-deposited Ru/C exhibit enhanced corrosion stability
Beilstein J. Nanotechnol. 2019, 10, 157–167, doi:10.3762/bjnano.10.15

- system with a base pressure of 10−9 mbar. Adventitious carbon was removed from the surface by 1 min, 2 kV Ar+ ion sputtering. To prevent charging a combination of electron and ion neutralization was employed. The Ru 3d and O 1s XPS core level spectra were analyzed using a fitting routine which decomposes


Sputtering of silicon nanopowders by an argon cluster ion beam
Beilstein J. Nanotechnol. 2019, 10, 135–143, doi:10.3762/bjnano.10.13

- the cluster, A = 57 eV and q = 2.25 are the fitting parameters. At low energy, the denominator is close to 1 and the equation is simplified to The functional dependence in Equation 1 and Equation 3 is the same except for the presence of the threshold energy Eth in Equation 1. In general, the existence


New micro/mesoporous nanocomposite material from low-cost sources for the efficient removal of aromatic and pathogenic pollutants from water
Beilstein J. Nanotechnol. 2019, 10, 119–131, doi:10.3762/bjnano.10.11

- 4-nitrophenol, especially when considering the very short empty bed contact time (the time a treated solution is in contact with 2Z-HYCA@650 °C nanocomposite material) of 8.6 s, as determined from the AdDesignSTM software [48]. The rate constant obtained by fitting the data with the Thomas model


Wet chemistry route for the decoration of carbon nanotubes with iron oxide nanoparticles for gas sensing
Beilstein J. Nanotechnol. 2019, 10, 105–118, doi:10.3762/bjnano.10.10

- of Fe 2p with a fitting curve for sample C (a), O 1s (b) and C 1s (c) for the samples A (black curve), B (red curve) and C (green curve). The C 1s spectra has been normalized and aligned. XRD pattern for Fe2O3 nanoparticles (a) and decorated CNTs with Fe2O3 nanoparticles (b). Electrical resistance of


Graphene–graphite hybrid epoxy composites with controllable workability for thermal management
Beilstein J. Nanotechnol. 2019, 10, 95–104, doi:10.3762/bjnano.10.9

- -filler composites (Figure 2b) were also applicable to the hybrid composite, when fitting the viscosity curves (Figure 4b) to a modified version of the K–D model that takes a multiple filler system into account [62]: The overall relative viscosity of the hybrid includes contributions of each filler’s
- ). Single-filler composites: (a) TC and (b) viscosity and relative viscosity as functions of filler type and volume fraction at constant shear rate (0.1 1/s) and temperature of 25 °C. Each graph displays the fitting parameters. The solid lines in (a) are fits to the ROM model (Equation 1), and those in (b
- ), to the Krieger–Dougherty model (Equation 2). The dashed lines in (b) represent the critical volume fraction, φM, found by fitting to the Krieger–Dougherty (K–D) model (Equation 2). Some error bars are hidden by the data symbols due to small measurement errors. Storage modulus (G', solid symbols) and


Electrolyte tuning in dye-sensitized solar cells with N-heterocyclic carbene (NHC) iron(II) sensitizers
Beilstein J. Nanotechnol. 2018, 9, 3069–3078, doi:10.3762/bjnano.9.285

- impedance spectroscopy (EIS) is an important technique for the investigation of interfaces in DSCs [49][50]. Fitting of the Nyquist and Bode plots, which are used to describe the EIS results, leads to parameters including the recombination resistance (Rrec), electron/hole transport resistance (Rtr), charge
- electrolyte. The constant phase element was employed in this study because of the surface roughness [51][52]. We chose to focus on understanding the observations involving the MBI additive, and EIS studies were conducted for electrolytes E2b, E2c and E2e. Measurements and curve fitting were made for duplicate


A novel polyhedral oligomeric silsesquioxane-modified layered double hydroxide: preparation, characterization and properties
Beilstein J. Nanotechnol. 2018, 9, 3053–3068, doi:10.3762/bjnano.9.284

- slopes of these lines using the following expression: The fitting results and Eα data are summarized in Table 4. Results show that the apparent activation energy increases as a whole with increasing conversion. Combined with the TGA data and the data of α as a function of T, the Eα values of NLDH can be


Ternary nanocomposites of reduced graphene oxide, polyaniline and hexaniobate: hierarchical architecture and high polaron formation
Beilstein J. Nanotechnol. 2018, 9, 2936–2946, doi:10.3762/bjnano.9.272

- the sp2-hybridized carbons in the graphene structure, since pristine graphite presents only an asymmetric peak at ca. 284 eV (carbon atoms in sp2 environment) [39][40][41]. The curve fitting of the C 1s spectra, also presented in Figure 4, can provide detailed information on the oxygen-containing
- groups, since these groups induce different environments for the carbon atoms and, consequently, their corresponding C 1s photoelectrons present slightly different binding energies [34][39][40][42][43][44][45][46][47][48][49][50][51]. The comparison of the curve fitting for GO and rGO-25 shows the
- groups, and the conversion of some epoxy to hydroxy groups [28][45][46][48]. In contrast, rGO-80 presents a dramatic change in the C 1s spectral profile, evidenced by an intense peak at ca. 284 eV and a weak shoulder at 285–290 eV. The comparison of the curve fitting for this sample and rGO-25 shows a


In situ characterization of nanoscale contaminations adsorbed in air using atomic force microscopy
Beilstein J. Nanotechnol. 2018, 9, 2925–2935, doi:10.3762/bjnano.9.271

- electrostatic interaction. For each interaction image three curves are obtained: a (true) van der Waals interaction ΔνvdW(d) curve (Figure 3, middle row), a tip–sample capacitance C″(d) curve (not shown) and a contact potential UCP(d) curve (not shown). As discussed in the Experimental section, by fitting these
- frequency shift with bias, as expected from Equation 3. Fitting the experimental data to a parabola, for each horizontal (voltage) scan line three parameters are determined: the position of the minimum of each parabola, corresponding to the contact potential UCP, the vertical “offset” of the parabola
- Hamaker constant the experimental data is essentially processed as follows: First, a radius R and the pole of the electrostatic interaction h/ε are determined from the capacity curve C″(d) by fitting to the term πε0R/(d + h/ε)2 (second term in Equation 2). Then the Hamaker constant is determined from a


Magnetic and luminescent coordination networks based on imidazolium salts and lanthanides for sensitive ratiometric thermometry
Beilstein J. Nanotechnol. 2018, 9, 2775–2787, doi:10.3762/bjnano.9.259

- magnetic coupling constant and T is the temperature. The simultaneous fitting of the susceptibility and the χT product with the Fischer expression above lead to refined values of g = 2.00(1) and J = −0.026 cm−1. The g value was left free during fitting and is in line with the tabulated g values for Gd ions


