Search results
Search for "XRD" in Full Text gives 523 result(s) in Beilstein Journal of Nanotechnology. Showing first 200.
Tubular glassy carbon microneedles with fullerene-like tips for biomedical applications
Beilstein J. Nanotechnol. 2022, 13, 455–461, doi:10.3762/bjnano.13.38

- local crystalline structure [17]. This is in good agreement with Raman spectrum data for glassy carbon [17][18] and confirms that the carbon microneedles fabricated here are glassy in nature. Figure 5 shows the XRD measurement of the glassy carbon tubules. The single sharp peak is indicative of
- calculated from the XRD data to have a d-spacing of 4.89 Å, which is further experimental evidence that the microneedles are of glassy carbon. Most glassy carbons prepared to date have been made by pyrolysis of polymeric materials. These generally do not have long-range crystalline order and undergo glass
- work, we have shown that the pyrolysis of methane leads to the formation of glassy carbon microneedles. These were characterized and identified using a combination of SEM, Raman spectroscopy, and XRD. This simple method of preparation provides an easy and efficient alternative to previously used


A non-enzymatic electrochemical hydrogen peroxide sensor based on copper oxide nanostructures
Beilstein J. Nanotechnol. 2022, 13, 424–436, doi:10.3762/bjnano.13.35

- atom %), which confirms the high chemical purity of the samples obtained and the absence of foreign impurities. Figure 2 shows the XRD analysis results. The diffractogram shows only peaks corresponding to CuO and pure Cu (substrate peaks). Extraneous phases and inclusions were not detected. A low
- on the surface of the main CuO layer (f). XRD pattern of CuO films. The red diffractogram corresponds to the sample obtained by thermal oxidation and the black diffractogram corresponds to the sample obtained by chemical hydrothermal oxidation. (a) CV results for a nanostructured CuO film in 0.1 M


Selected properties of AlxZnyO thin films prepared by reactive pulsed magnetron sputtering using a two-element Zn/Al target
Beilstein J. Nanotechnol. 2022, 13, 344–354, doi:10.3762/bjnano.13.29

- deposited directly above the target, at X = 40 and 50 mm, are composed of very small grains of 35–55 nm with an average size of ca. 45 nm. At larger X, the films had larger, densely packed, and homogeneously distributed grains of 55–80 nm with an average size of ca. 70 nm. These results agree with the XRD
- and are then repulsed by the field near the target toward the substrate placed above it. For the case presented here, an analysis of the XRD results may be used to clarify the sudden change in the electrical properties of the deposited thin films depending on X. Measurements of structural properties
- , it can be considered that for films deposited at X ≥ 50 mm, more Al3+ ions were successfully incorporated into the host lattice as the aluminium content increases (confirmed by the EDS results) and the Al2ZnO4 phase decreases (confirmed by the XRD results). ZnO is a wide-bandgap semiconductor with


Interfacial nanoarchitectonics for ZIF-8 membranes with enhanced gas separation
Beilstein J. Nanotechnol. 2022, 13, 313–324, doi:10.3762/bjnano.13.26

- ., strong acids or bases or organic solvents) compared to polymer substrates. The particle size of α-Al2O3 on dense top layers of these disks is around 200 nm (information from Fraunhofer IKTS, Germany). The porosity of the disks was measured as 41.58% by mercury porosimeter measurements. The XRD patterns
- synthesis method. Figure 1a shows that the XRD patterns of the as-synthesized free-standing ZIF-8 thin film was identical to that of a ZIF-8 crystal simulated with data from Crystallography Open Database (Mercury, version 3.6), indicating the success of the synthesis of ZIF-8 crystals by interfacial
- synthesis. The SEM image shows that the ZIF-8 crystals have a grain size of approximately 5 μm (Figure 1b). A layer of white ZIF-8 crystals was clearly formed at the interface between aqueous and organic phases (Figure 1c,d). Characterizations of ZIF-8 membranes The XRD patterns of ZIF-8 membranes


The effect of metal surface nanomorphology on the output performance of a TENG
Beilstein J. Nanotechnol. 2022, 13, 298–312, doi:10.3762/bjnano.13.25

- concentration, and temperature during the electrodeposition of copper. The samples were characterized using XRD and SEM. The output performance of the TENG is closely related to the size, charge density distribution, and shape of the metal nanoparticles. Keywords: charge density; green energy; metal
- agglomerate. Results and Discussion The XRD data (Figure 4) were processed using the JADE software to calculate the average particle sizes. SEM micrographs were screened according to the surface morphology size of the nanoparticles and colored according to the nanoscale topography size (Figure 5 and Figure 6
- . Figure 1 was redrawn from [13] (ϕMetal: metal work function). Electrodeposition process. A PMMA plate was used as the electrodeposition liner. Contact and separation of Cu and PTFE. XRD diffraction patterns of the 16 samples after electrodeposition. Samples 1–8 of the 16 samples were screened and


Investigation of a memory effect in a Au/(Ti–Cu)Ox-gradient thin film/TiAlV structure
Beilstein J. Nanotechnol. 2022, 13, 265–273, doi:10.3762/bjnano.13.21

- impurities were observed in the coating. Structural properties were analyzed using X-ray diffraction (XRD) and transmission electron microscopy (TEM). XRD patterns were obtained with a PANalytical Empyrean PIXed3D powder diffractometer with Cu Kα radiation (1.5406 Å) and no diffraction peaks were observed


Relationship between corrosion and nanoscale friction on a metallic glass
Beilstein J. Nanotechnol. 2022, 13, 236–244, doi:10.3762/bjnano.13.18

- -spinning technique and provided by the Physics Institute at the University of Basel (Switzerland). The X-ray diffraction of Cu Kα radiation (XRD) verified the amorphous nature of the ribbons. All friction experiments were conducted at room temperature in 0.2 M phosphate buffer (Na2HPO4 + NaH2PO4, pH ≈ 7


Surfactant-free syntheses and pair distribution function analysis of osmium nanoparticles
Beilstein J. Nanotechnol. 2022, 13, 230–235, doi:10.3762/bjnano.13.17

- conditions to obtain Os NPs for further studies. Transmission electron microscopy images from samples synthesized with these parameter sets are shown in Figure 1. The small size of the nanoparticles challenges conventional structural characterization methods such as X-ray diffraction analysis (XRD). Here, we
- . Figure S24: XRD characterization of the nanomaterials obtained. Figures S25–42: PDF characterization of the nanomaterials obtained. Figures S43–45: Crystal structures and models of the different clusters and complexes. Figure S46: PDF characterization of the nanomaterials obtained. Table S1: Overview of


Piezoelectric nanogenerator for bio-mechanical strain measurement
Beilstein J. Nanotechnol. 2022, 13, 192–200, doi:10.3762/bjnano.13.14

- characterized through scanning electron microscopy (SEM) and X-ray diffraction (XRD) to determine morphology and crystalline structure, respectively. Sensor development, its embedding, and testing The prepared PVDF nanofibrous mesh was folded into a square shape (4 cm2) with 2 mm thickness for sensor
- (Figure 2C). Therefore, these fibers were selected for developing the piezoelectric sensor. The average diameter of the fibers obtained from different solutions is provided in Figure 2D. XRD analysis PVDF exhibits four crystalline structures: α, β, γ, and δ [38]. Normally, all phases of PVDF show almost
- fibers obtained from the 16 wt % solution compared to the solutions of 12 and 14 wt %. The crystallinity was calculated from the XRD diffractograms and came out to be 52.3%, 54.6%, and 57.7% for the fibers made from 12, 14, and 16 wt % solutions, respectively. This phenomenon can be correlated with the


Theranostic potential of self-luminescent branched polyethyleneimine-coated superparamagnetic iron oxide nanoparticles
Beilstein J. Nanotechnol. 2022, 13, 82–95, doi:10.3762/bjnano.13.6

- sensitivity the results obtained from TEM are usually more reliable [52]. The XRD pattern of SPION@bPEI synthesized in situ indicates a crystalline magnetite structure composed of both magnetite (Fe3O4) and maghemite (Fe2O3), including nanoparticles (Figure 1c). Considering only XRD patterns it would be


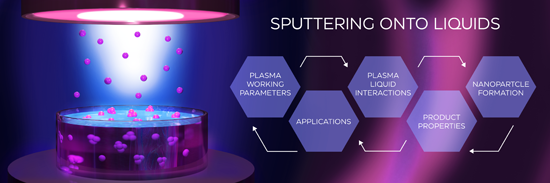
Sputtering onto liquids: a critical review
Beilstein J. Nanotechnol. 2022, 13, 10–53, doi:10.3762/bjnano.13.2


Biocompatibility and cytotoxicity in vitro of surface-functionalized drug-loaded spinel ferrite nanoparticles
Beilstein J. Nanotechnol. 2021, 12, 1339–1364, doi:10.3762/bjnano.12.99

- cytotoxicity of these nanocarriers for potential anticancer drug delivery systems. Results and Discussion Physical characterizations The X-ray diffraction (XRD) data of all samples was analyzed using Rietveld refinement techniques in the Fullprof Suit program. The data was refined according to their space
- groups. The Rietveld-refined XRD pattern of the MFe2O4 nanoparticles (Figure 1a), where triangles indicate experimental data, is shown by the red solid lines which represent the calculated intensities. The difference between the two intensities was indicated by the blue line at the bottom of the graphs
- phase of the samples is consistent with the XRD results. The formation of spherical NPs was confirmed by transmission electron microscopy (TEM) (Figure 2a). The nanospheres are uniformally distributed throughout the surface of the samples. High-resolution transmission electron microscopy (HR-TEM) images


Plasmon-enhanced photoluminescence from TiO2 and TeO2 thin films doped by Eu3+ for optoelectronic applications
Beilstein J. Nanotechnol. 2021, 12, 1271–1278, doi:10.3762/bjnano.12.94

- centrosymmetric structures. This led to the conclusion that there might be some nanocrystal areas in the TiO2:Eu films. It is in line with our previous structural investigations. XRD measurements showed an amorphous or nanocrystalline structure of the oxide layers deposited by magnetron sputtering [31]. The


Electrical, electrochemical and structural studies of a chlorine-derived ionic liquid-based polymer gel electrolyte
Beilstein J. Nanotechnol. 2021, 12, 1252–1261, doi:10.3762/bjnano.12.92

- work [10]. The uniformly distributed pores present in the films lead to the retention of liquid electrolytes, thereby increasing the overall ionic conductivity of the electrolyte films. X-ray diffraction (XRD) patterns were also recorded to check the crystallinity of the synthesized material. The
- variations in the crystallinity of the polymer electrolytes are directly related to the intensity and full width at half maximum (FWHM) of the peak. Usually, the crystallinity and FWHM are inversely proportional to each other, the larger the FWHM, the smaller the crystal size and vice versa [32]. XRD
- patterns of the electrolyte membranes are depicted in Figure 2a–e. The XRD pattern of pure PVdF-HFP can be marked according to the α, β, and γ PVdF crystalline phases. From Figure 2a, it can be seen that pure PVdF-HFP possesses well-defined peaks at 18.4, 20.4, 25.6, and 38°. The peak at 18.4° [20


Morphology-driven gas sensing by fabricated fractals: A review
Beilstein J. Nanotechnol. 2021, 12, 1187–1208, doi:10.3762/bjnano.12.88

- -assisted chemical etching was used by Qin et al. [79] to prepare a dendritic array of Si/WO3 NW composites, which was tested for the detection of NO2 gas at room temperature. Figure 17a–e SEM and high-resolution transmission electron microscopy (HR-TEM) images of Si/WO3 NWs. Figure 17f shows the XRD
- permission of AIP Publishing. This content is not subject to CC BY 4.0. Si/WO3 nanowires. (a–d) SEM images of Si/WO3 NWs, (e) HRTEM image of a WO3/SiNW interface, (f) XRD pattern of SiNWs and SiNWs/WO3. Dynamic responses of (g) the composite and (h) pure SiNWs to 0.5–5 ppm NO2 at room temperature


The effect of cobalt on morphology, structure, and ORR activity of electrospun carbon fibre mats in aqueous alkaline environments
Beilstein J. Nanotechnol. 2021, 12, 1173–1186, doi:10.3762/bjnano.12.87

- electron microscopy (SEM), energy-dispersive X-ray spectroscopy (EDX), X-ray diffraction (XRD), X-ray photoelectron spectroscopy (XPS), Raman spectroscopy, elemental analysis, and inductively coupled plasma optical emission spectrometry (ICP-OES). In addition, the fibres were analysed in terms of their
- cobalt. To further investigate the nature of the cobalt-containing particles XRD diffractograms were recorded (Figure 3). The diffractograms for samples with cobalt display the characteristic reflexes at angles attributed to the Co fcc phase. Their intensity increases with carbonisation temperature
- oxidation likely results in amorphous species explains the absence of reflexes attributed to oxidised species, such as Co3O4, CoO, or Co(OH)2, in the XRD diffractograms. This behaviour also explains the plateau in the cobalt metal values found for samples carbonised above 800 °C. At these temperatures the


pH-driven enhancement of anti-tubercular drug loading on iron oxide nanoparticles for drug delivery in macrophages
Beilstein J. Nanotechnol. 2021, 12, 1127–1139, doi:10.3762/bjnano.12.84

- distribution of these particles was also high, i.e., FWHM of 670.94 nm, resulting from the variation in particle aggregate sizes. The XRD pattern obtained for the synthesized particles were in accordance with the pattern observed in the XRD database for iron oxide (COD: 9013529) [32] (Figure 2c). The zeta
- individual nanoparticles (Figure 3b), clearly indicating a reduced aggregate size in comparison to the UIONPs which was also indicated by the reduced FWHM, i.e., 40.72 nm. The XRD pattern confirmed the presence of iron oxide nanoparticles (Figure 3c). The FTIR spectrum of NOR@IONPpH5 indicated the presence
- particle aggregation. The XRD pattern of NOR@IONPpH10 was indicative of the presence of iron oxide nanoparticles (Figure 4c). Further confirmation of iron oxide was found through the Fe–O stretching, observed at 590 cm−1 in the FTIR spectrum [37][38]. The FTIR spectrum of the sample indicates either the


Revealing the formation mechanism and band gap tuning of Sb2S3 nanoparticles
Beilstein J. Nanotechnol. 2021, 12, 1021–1033, doi:10.3762/bjnano.12.76

- after 30 min. There were still type III structures found consisting of type II particles. After 8 h, the dispersion started to turn brownish in color. The amorphous, spherically shaped type II nanoparticles (see X-ray diffraction spectrometry, XRD in Figure 2 below) began to form the first crystalline
- /aggregates, the size and aspect ratios of the crystalline particles, the corresponding molar ratio of Sb and S obtained by EDX, and the associated band gap obtained by reflectance measurements (see discussion of the optical data below). XRD measurements of an orange-red (30 min) and a grayish-black (18 h
- electron beam, which caused the particles to appear larger. Consequently, the stacked deflection peaks (Figure 5b, 14.7 nm, red and green mark) correspond to a nanoparticle cluster similar to those found in Figure 4b. Chemical composition To confirm the XRD results for stibnite and to examine the


Progress and innovation of nanostructured sulfur cathodes and metal-free anodes for room-temperature Na–S batteries
Beilstein J. Nanotechnol. 2021, 12, 995–1020, doi:10.3762/bjnano.12.75

- undergo a sodiation process to form Na2S2. Then, the Na2S2 intermediate is converted to Na2S. Another remarkable electrocatalyst are gold nanodots, as reported by Wang et al. [49]. The in situ synchrotron XRD results show that gold can effectively catalyze the transformation of Na2S4 into Na2S in the


A Au/CuNiCoS4/p-Si photodiode: electrical and morphological characterization
Beilstein J. Nanotechnol. 2021, 12, 984–994, doi:10.3762/bjnano.12.74

- University, 70200, Karaman, Turkey Department of Biotechnology, Faculty of Science, Selcuk University, 42130, Konya, Turkey 10.3762/bjnano.12.74 Abstract In this present work, CuNiCoS4 thiospinel nanocrystals were synthesized by hot injection and characterized by X-ray diffractometry (XRD), high-resolution
- transmission electron microscopy (HR-TEM), and energy-dispersive X-ray spectroscopy (EDS). The XRD, EDS, and HR-TEM analyses confirmed the successful synthesis of CuNiCoS4. The obtained CuNiCoS4 thiospinel nanocrystals were tested for photodiode and capacitance applications as interfacial layer between Au and
- characteristics of the photodiode after inserting CuNiCoS4 nanocrystals as interlayer between Au metal and p-Si were investigated. The aim is to obtain more powerful photodiodes by using a new type of interlayer material. XRD, HR-TEM, and SEM analyses were carried out to characterize the thiospinel CuNiCoS4


Silver nanoparticles nucleated in NaOH-treated halloysite: a potential antimicrobial material
Beilstein J. Nanotechnol. 2021, 12, 798–807, doi:10.3762/bjnano.12.63

- Netzsch STA 449 F3. X-ray diffraction (XRD) measurements were carried out using a Shimadzu diffractometer, model XRD-7000, with Cu Kα radiation (λ = 0.154 nm). Substrate preparation To prepare the substrates for silver nucleation, halloysite was treated in a NaOH(aq) bath. Three HNT suspensions were
- , and HNT-8 were recorded with TEM, while sample HNT-8 was also measured with XRD. (XRD was also performed for HNT-0 and HNT-4 but omitted from this report because it did not show any significant difference from HNT-8). Silver nanoparticle synthesis To synthesize silver nanoparticles, 10 g of HNT (from
- metallic silver. They were then labelled Ag/HNT-0, Ag/HNT-4, and Ag/HNT-8 (according to the NaOH treatment), and characterized by TEM and EDS. Sample Ag/HNT-8 was also characterized by XRD. Ag-NPs nucleation analysis In order to study the nucleation of silver nanoparticles, 1 g of Ag/HNT-8 was used for TGA


High-yield synthesis of silver nanowires for transparent conducting PET films
Beilstein J. Nanotechnol. 2021, 12, 624–632, doi:10.3762/bjnano.12.51

- alignment on a large scale and were characterized by UV–vis spectroscopy, scanning electron microscopy (SEM), X-ray diffraction (XRD), and PL spectroscopy. The luminescent AgNWs exhibited red emission, which was accredited to deep holes. The SEM results confirmed the formation of AgNWs of 3.3 to 4.7 µm in
- morphology of the Ag NWs was best at a reaction temperature of 160 °C and a 1:4 ratio of AgNO3/PVP. The XRD analysis confirmed the crystallinity of the AgNWs structures. The aqueous solution of the AgNWs exhibited a broad PL emission band in the red region. The SEM images confirmed that the final product was
- the actual solution colors. (b) XRD pattern of the as-synthesized AgNWs sample. (c) PL emission spectrum of AgNWs falling in the range of 600–800 nm with red emission. The de-convolution into Lorentzian peaks yields peaks at 607, 657, and 718 nm. The red dashed curve is the fit sum of all three


Stability and activity of platinum nanoparticles in the oxygen electroreduction reaction: is size or uniformity of primary importance?
Beilstein J. Nanotechnol. 2021, 12, 593–606, doi:10.3762/bjnano.12.49

- assignment in the field of scientific activity No 0852-2020-0019). Acknowledgements The authors are grateful to Mr. Nikulin A.Yu. for assistance in the XRD pattern registration and to the “Shared Use Center High-Resolution Transmission Electron Microscopy” (SFedU) for conducting the TEM studies.


Boosting of photocatalytic hydrogen evolution via chlorine doping of polymeric carbon nitride
Beilstein J. Nanotechnol. 2021, 12, 473–484, doi:10.3762/bjnano.12.38

- terminal amino groups (–NH2 or =NH) [53][54]. The spectra do not show Cl-containing functional groups, which can be attributed to their relatively low amount and the signal may be overlapped by the CN vibration. The X-ray diffraction (XRD) patterns (Figure 3b) showed that both samples displayed a similar
- packing motif of the tri-s-triazine units. The shift from 27.38° to 27.30° is caused by the increased internal distance of PCN by Cl doping, which is in good agreement with AFM data and suggests that Cl is located at the interlayers of carbon nitride. Moreover, the XRD and FTIR analyses confirmed that the
- energy-dispersive X-ray spectroscopy (EDX) elemental mappings of N, C, O, and Cl in Cl-PCN (f). AFM images and height profile of PCN (a, b) and Cl-PCN (c, d). (a) FTIR spectra and (b) XRD patterns of PCN and Cl-PCN. C 1s and N 1s XPS spectra of polymeric carbon nitride (a, b) and Cl-PCN (c, d). Structure


A review on nanostructured silver as a basic ingredient in medicine: physicochemical parameters and characterization
Beilstein J. Nanotechnol. 2021, 12, 440–461, doi:10.3762/bjnano.12.36

- anionic and stable. Another important point is that with the increase in ionic strength the diffuse layer becomes more compact while the ZP decreases, and vice versa [153]. X-ray diffraction: The principle of the X-ray diffraction (XRD) technique is based on Bragg's law. The crystallographic planes of a
- crystalline structure, size, and shape of the unit cell of a silver nanoparticle can be determined using XRD. The Bragg reflexes of the face-centered cubic structure (FCC) of AgNPs are generally observed at 2θ (Bragg angle) = 38.00°, 44.16°, 64.40°, and 77.33° and correspond to (111), (200), (220), and (311
- ) planes, respectively [158]. Powder XRD is effective in studying the crystalline structure of heterogeneous nanoparticles and nanostructures [159]. As the 2θ angle increases, the phase difference between two progressive waves also increases and the scattering intensity decreases [159]. Nanoparticles with


