Search results
Search for "fitting" in Full Text gives 475 result(s) in Beilstein Journal of Nanotechnology. Showing first 200.
Imaging of viscoelastic soft matter with small indentation using higher eigenmodes in single-eigenmode amplitude-modulation atomic force microscopy
Beilstein J. Nanotechnol. 2018, 9, 1116–1122, doi:10.3762/bjnano.9.103

- Gn and τn used in the simulations were digitalized from the data provided by Brinson and Brinson [17], who obtained the values by fitting the experimental data of Catsiff and Tobolsky [22]. The digitalized values are summarized in Table 1. The plot for these values is also provided in Supporting File


P3HT:PCBM blend films phase diagram on the base of variable-temperature spectroscopic ellipsometry
Beilstein J. Nanotechnol. 2018, 9, 1108–1115, doi:10.3762/bjnano.9.102

- optical model parametrizes the spectral dependence of the refractive index n and the extinction coefficient k on the wavelength λ by the following relations: where the temperature-dependent parameters ni and ki, with i = 0, 1 and 2, are the model (fitting) parameters and the coefficients C0 and C1 are the
- a function of the temperature for P3HT, PCBM and P3HT:PCBM (1:1) blend films are shown. At each measured temperature T the thickness was determined by fitting the Cauchy optical model to the experimental data using the SpectraRay 3 software from SENTECH Instruments. For comparison, we have also


A simple extension of the commonly used fitting equation for oscillatory structural forces in case of silica nanoparticle suspensions
Beilstein J. Nanotechnol. 2018, 9, 1095–1107, doi:10.3762/bjnano.9.101

- suspensions measured with a colloidal probe AFM. Using the simple fitting procedure with three parameters often leads to underestimation of actually measured forces. The deviation of the fit from the experimental data is especially pronounced at small distances of the confining surfaces and at high
- fitting parameters in the system studied here. Keywords: confinement; depletion; fitting; silica nanoparticles; structural forces; Introduction Oscillatory structural forces are a genuine feature observed for simple and complex fluids in the vicinity of smooth surfaces [1][2]. Due to the ubiquitous
- into the fit leads to a poor fit of the experimental data at larger separations. It has been noted also, that amplitude A and decay length ξ vary strongly depending on the exact starting point of the fit. In this work, we focus on the dependence of the three fitting parameters A, ξ and λ with respect


Room-temperature single-photon emitters in titanium dioxide optical defects
Beilstein J. Nanotechnol. 2018, 9, 1085–1094, doi:10.3762/bjnano.9.100

- in the HBT setup. For D1, a three-level model was chosen to fit normalised g(2) data. It has the form [6][58]: g(2)(τ) = A − B·exp(−κ21)τ + C·exp(−κ23/31)τ, where A, B and C are fitting coefficients. The excited state and non-radiative decay rates are represented by κ21 and κ23/31, respectively. An
- linear fits omit the pump powers of 99 and 148 μW due to their poor statistics, there was a large variance in the correlation data away from the centre of the antibunching dip. A moving average filter was applied to the data to obtain a smooth response to assist with the fitting, without success


An implementation of spin–orbit coupling for band structure calculations with Gaussian basis sets: Two-dimensional topological crystals of Sb and Bi
Beilstein J. Nanotechnol. 2018, 9, 1015–1023, doi:10.3762/bjnano.9.94

- fitting multiplicative factor to effectively model the SOC effect. Importantly, despite the fact that we are dealing with different types of orbitals of different shells, only a single parameter is needed since the relative values of the matrix elements are properly captured. As possibly relevant examples


Automated image segmentation-assisted flattening of atomic force microscopy images
Beilstein J. Nanotechnol. 2018, 9, 975–985, doi:10.3762/bjnano.9.91

- -based polynomial fitting was proposed to process images with complex background trends. The working principle of the two-step image flattening scheme were presented, followed by the investigation of the influence of a sliding-window size and polynomial fitting direction on the flattened images
- . Additionally, the role of image flattening on the morphological characterization and segmentation of AFM images were verified with the proposed method. Keywords: atomic force microscopy; contour expansion; image flattening; polynomial fitting; sliding window; Introduction Since its invention, the atomic
- required prior to analysis. In AFM image flattening, individual scan lines are fitted as polynomial curves with the least-square method [29]. The obtained polynomial curves are then subtracted from AFM scan lines to get flattened images. The direct polynomial fitting can cause stripe-type artifacts


Electro-optical interfacial effects on a graphene/π-conjugated organic semiconductor hybrid system
Beilstein J. Nanotechnol. 2018, 9, 963–974, doi:10.3762/bjnano.9.90

- these plots) and Table 1 shows the respective fitting parameters. Considering, initially, parameter α in Table 1, which is related to the geometric capacitance and dielectric constant, there is no significant variation, as expected, since the geometric capacitance should remain the same. The minor
- of RA molecules. For a better visualization, the inset at the top left shows the superposition of the G band obtained for both cases. The Raman mode at ≈1570 cm−1 originates from C=C RA molecule bond. Fitting parameters of Equation 2 for the experimental data in Figure 4c–e. The error values from the
- fitting analysis are shown in the first line of the table. Supporting Information Supporting Information File 66: Supporting Information File 1 contains morphological characterization of retinoic acid deposited on different substrates; morphological and electrical characterization of graphite microplate


Cyclodextrin inhibits zinc corrosion by destabilizing point defect formation in the oxide layer
Beilstein J. Nanotechnol. 2018, 9, 936–944, doi:10.3762/bjnano.9.86
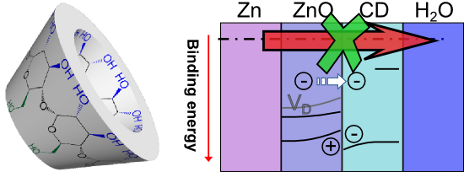
- potential in a frequency range from 104 to 10−1 Hz. The impedance spectra were fitted using the software ZView. The resulting impedance spectra and the equivalent circuit for data fitting are shown in Figure S2 (Supporting Information File 1). From EIS data, the corrosion current densities icorr were
- estimated as given on page 48 of [16] as from the area-normalized polarization resistance Rp. The latter was determined from fitting the EIS data. The inhibition efficiency η was calculated as from the corrosion current densities and recorded in the presence and absence of the inhibitor β-CD, respectively


Effect of annealing treatments on CeO2 grown on TiN and Si substrates by atomic layer deposition
Beilstein J. Nanotechnol. 2018, 9, 890–899, doi:10.3762/bjnano.9.83

- atmosphere by using a graphite dome. Thickness, interface and surface roughness, and electronic density have been determined by data fitting using the MAUD software program [24]. MAUD has also been used for Rietveld refinement of GIXRD patterns, allowing to determine CeO2 cell parameter and crystallite size
- at 600 °C during diffraction acquisition in N2 atmosphere for CeO2/TiN and annealed at 900 °C during diffraction acquisition in N2 atmosphere for CeO2/Si). XRR data are resumed in Figure 1a for CeO2/TiN and Figure 1b for CeO2/Si. By fitting the XRR profiles of the as-deposited samples and the samples
- comparing the XRR profiles of the as-deposited samples with those annealed at high temperatures, we obtained different results, as shown by the fitting parameters reported in Table 1. In particular, we deduced an evolution of the composition of TiN, correctly simulated in a two-layer model, where the


Comparative study of antibacterial properties of polystyrene films with TiOx and Cu nanoparticles fabricated using cluster beam technique
Beilstein J. Nanotechnol. 2018, 9, 861–869, doi:10.3762/bjnano.9.80

- performed using CASA XPS software. For the Ti 2p peak fitting the procedure described in [23] is applied. The Ti 2p3/2 and Ti 2p1/2 are fitted with four separate peaks that correspond to metallic Ti and three titanium oxides Ti(II), Ti(III) and Ti(IV). Metallic Ti is fitted by Lorentzian asymmetric peak in


Towards the third dimension in direct electron beam writing of silver
Beilstein J. Nanotechnol. 2018, 9, 842–849, doi:10.3762/bjnano.9.78

- carbon-based fragments of the precursor molecules. The intensity ratios between the D and G bands (ID/IG) were evaluated using a Lorentzian peak fitting, which suggests the formation of nanocrystalline graphite clusters within a disordered carbon matrix in both deposits [30]. The Raman measurements


Facile synthesis of a ZnO–BiOI p–n nano-heterojunction with excellent visible-light photocatalytic activity
Beilstein J. Nanotechnol. 2018, 9, 789–800, doi:10.3762/bjnano.9.72

- shows the physical color of the samples. (b) The plot of (αhν)2 vs photon energy (hν). Photocatalytic activity under visible light illumination. (a) The rhodamine B (RhB) solution degradation of the as-prepared samples with sample with no catalyst and P25 as comparison. (b) The linear fitting of the


Surface-plasmon-enhanced ultraviolet emission of Au-decorated ZnO structures for gas sensing and photocatalytic devices
Beilstein J. Nanotechnol. 2018, 9, 771–779, doi:10.3762/bjnano.9.70

- insightful information for depicting the fast charge carriers as well as to elucidate the mechanism of charge transfer, TRPL spectra were recorded at room temperature for all samples (Figure 3d). The fast decay time (fast and slow), as extracted by fitting the bi-exponential curve at the 385 nm emission peak


Synthesis and characterization of two new TiO2-containing benzothiazole-based imine composites for organic device applications
Beilstein J. Nanotechnol. 2018, 9, 721–739, doi:10.3762/bjnano.9.67

- fitting. Temperature evolution of the FTIR spectrum of SP1 imine obtained during heating in two spectral ranges: 1200–650 cm−1 (a) and between 1780–1220 cm−1 (b). Temperature evolution of the FT-MIR spectrum of SP2 imine obtained during heating between: (a) 3080 and 2800 cm−1 (left) and temperature


Perovskite-structured CaTiO3 coupled with g-C3N4 as a heterojunction photocatalyst for organic pollutant degradation
Beilstein J. Nanotechnol. 2018, 9, 671–685, doi:10.3762/bjnano.9.62

- , visible and sunlight). To demonstrate the photocatalytic performance of the as-prepared catalysts more precisely, the kinetics of the photodegradation of RhB aqueous solutions was studied by fitting the obtained degradation results to a pseudo-first-order reaction model [54][55] and modified Freundlich
- corresponding linear regression coefficients (R2). The kinetic plots obtained by fitting the experimental data to the modified Freundlich model are presented in Figure 10d–f. The calculated k and R2 values are provided in Table S2 in Supporting Information File 1. From the analysis of the kinetic plots and


Tuning adhesion forces between functionalized gold colloidal nanoparticles and silicon AFM tips: role of ligands and capillary forces
Beilstein J. Nanotechnol. 2018, 9, 660–670, doi:10.3762/bjnano.9.61

- NPs with diameters below 20 nm. Logarithm of the adhesion between silicon tip and functionalized Au NPs deposited on silicon wafer measured with Peakforce QNM AFM, versus NPs diameters: red circles –OCH3, black diamonds –CH3. Fitting parameter R² is approx. 0.80 for both groups. Adhesion forces


Electron interactions with the heteronuclear carbonyl precursor H2FeRu3(CO)13 and comparison with HFeCo3(CO)12: from fundamental gas phase and surface science studies to focused electron beam induced deposition
Beilstein J. Nanotechnol. 2018, 9, 555–579, doi:10.3762/bjnano.9.53

- of the Fe 2p peaks. In the Ru 3d/C 1s region, the spectral envelope can be fit with three peaks prior to electron irradiation (fitting can be seen in Figure S2, Supporting Information File 1). Peaks at 286.2 eV and 282.2 eV correspond to the Ru 3d3/2 and Ru 3d5/2 transitions respectively, while
- low intensity. Upon electron irradiation, the Ru 3d3/2 and Ru 3d5/2 peak positions shift measurably towards a lower binding energy, and the CO peak decreases in intensity. Spectral fitting of the Ru 3d/C 1s XPS region measured after an electron irradiation of a dose of 1.4 × 10¹⁸ e−/cm2 reveals an


Single-step process to improve the mechanical properties of carbon nanotube yarn
Beilstein J. Nanotechnol. 2018, 9, 545–554, doi:10.3762/bjnano.9.52

- due to the presence of amorphous carbon. Carbon atoms can be sputtered from the outer shell under irradiation and recombine. Fitting of all spectra was achieved with Lorentzian peaks and the ID/IG ratio was calculated for each sample. ID/IG increases with an increase in the number of defects on the


Colloidal solution of silver nanoparticles for label-free colorimetric sensing of ammonia in aqueous solutions
Beilstein J. Nanotechnol. 2018, 9, 499–507, doi:10.3762/bjnano.9.48

- experimental points are arranged along a straight line also in the log–log plot of Figure 7a and Figure 7c. The fitting allows us to determine the values of H and p reported in Table 3. The addition of small amounts of ammonia (up to 0.5 ppm) catalyse the formation of nanoparticles less rapidly and with less


Facile synthesis of ZnFe2O4 photocatalysts for decolourization of organic dyes under solar irradiation
Beilstein J. Nanotechnol. 2018, 9, 436–446, doi:10.3762/bjnano.9.42

- Rh B over ZFO-500. Adsorption spectra of the phenol solution before and after photodegradation over ZFO-500. Formation of luminescent 2-hydroxyterephthalic acid from terephthalic acid. First-order fitting results of Congo red decolourization over ZFO samples. Zero-order fitting parameters of Rh B


Dynamic behavior of nematic liquid crystal mixtures with quantum dots in electric fields
Beilstein J. Nanotechnol. 2018, 9, 399–406, doi:10.3762/bjnano.9.39

- , R = 3 nm and cv = 1.16% (volumetric fraction). Therefore, we obtain for the sample containing QDs, the experimental relaxation time τon−exp = 0.167 s when the field is switched on and τoff−exp = 0.139 s when the field is switched off. By fitting the data of the 5CB sample, we obtained a relaxation


Electron interaction with copper(II) carboxylate compounds
Beilstein J. Nanotechnol. 2018, 9, 384–398, doi:10.3762/bjnano.9.38

- of the corresponding ion formation by a fitting procedure using a modified Wannier law [55]. This value then represents an ionization potential or appearance energy of electron ionization or dissociative ionization respectively. where b represent background, AE represent appearance (or ionization
- ) energy, ε is electron energy and a, d are independent fitting parameters. Calibration of the electron energy has been carried out by measurement of the ionization potential of Ar atoms and calibration to its known value 15.76 eV [56] and with reference to the maximum of the electron attachment resonance


Photocatalytic and adsorption properties of TiO2-pillared montmorillonite obtained by hydrothermally activated intercalation of titanium polyhydroxo complexes
Beilstein J. Nanotechnol. 2018, 9, 364–378, doi:10.3762/bjnano.9.36

- concentration of sorbate [49]. Figure 9 represents the isotherms of MO and RhB adsorption on TiO2-PMM500 (Figure 9a) and TiO2-PMMH500 (Figure 9b), which are related an adsorption model fitting the experimental data in the most appropriate way. Thereby, the hydrothermal treatment does not significantly influence


The nanofluidic confinement apparatus: studying confinement-dependent nanoparticle behavior and diffusion
Beilstein J. Nanotechnol. 2018, 9, 301–310, doi:10.3762/bjnano.9.30

- significantly contribute to the results. Particle localization Radial symmetry-based tracking was used to identify the central lateral position of the nanosphere. This tracking algorithm yields similar accuracies compared to Gaussian fitting, is fast in execution, and detects any radially symmetric intensity


Synthesis and characterization of electrospun molybdenum dioxide–carbon nanofibers as sulfur matrix additives for rechargeable lithium–sulfur battery applications
Beilstein J. Nanotechnol. 2018, 9, 262–270, doi:10.3762/bjnano.9.28

- steep sloping line in the low-frequency region, corresponding to the Warburg impedance, was represented by W0. The fitting results are listed in Table 4. Obviously, the S/MoO2–CNF cathodes possessed lower charge transfer resistance than pure sulfur cathodes, indicating better charge transfer between the


