Search results
Search for "core level" in Full Text gives 86 result(s) in Beilstein Journal of Nanotechnology.
Nanoporous water oxidation electrodes with a low loading of laser-deposited Ru/C exhibit enhanced corrosion stability
Beilstein J. Nanotechnol. 2019, 10, 157–167, doi:10.3762/bjnano.10.15

- system with a base pressure of 10−9 mbar. Adventitious carbon was removed from the surface by 1 min, 2 kV Ar+ ion sputtering. To prevent charging a combination of electron and ion neutralization was employed. The Ru 3d and O 1s XPS core level spectra were analyzed using a fitting routine which decomposes


Wet chemistry route for the decoration of carbon nanotubes with iron oxide nanoparticles for gas sensing
Beilstein J. Nanotechnol. 2019, 10, 105–118, doi:10.3762/bjnano.10.10

- Fe2O3 and oxide-hydroxide. It is reported that the typical value for the satellite peak of Fe2+ (FeO) is 715.5 eV [30] and main 2p peak centered at 708 eV [31], while metallic iron has the main peak at much lower binding energy (706.7 eV). The O 1s core level spectra, shown in Figure 5b, was reproduced
- peaks are attributed to other O–C groups and adsorbed water [32][33]. C–O contributions can be also observed in the C 1s core level spectra in Figure 5c by the presence of the peak at 288.6 eV. This contribution is higher in the spectrum recorded on sample A, where the highest amount of oxygen was found
- (c) and acetone (d). Different decoration densities for different decoration ratios of 1:1 (a), 1:1.3 (b) and 1:1.5 (c). High magnification HRTEM images of MWCNTs decorated with Fe2O3 nanoparticles. The inset shows the electron diffraction pattern (SAED) for the selected area. XPS core level spectra


Zn/F-doped tin oxide nanoparticles synthesized by laser pyrolysis: structural and optical properties
Beilstein J. Nanotechnol. 2019, 10, 9–21, doi:10.3762/bjnano.10.2

- ZTO0.44 sample and is directly dependent on the Zn/Sn vapor flow ratio. High-resolution XPS core level spectra of Sn3d, O1s, F1s and Zn2p were made for the highest Zn-doped sample (ZTO0.44) and the only the fluorine-doped sample (ZTOst). The binding energies were calibrated using the C1s peak at 284.4 eV


Ternary nanocomposites of reduced graphene oxide, polyaniline and hexaniobate: hierarchical architecture and high polaron formation
Beilstein J. Nanotechnol. 2018, 9, 2936–2946, doi:10.3762/bjnano.9.272

- level photoelectrons present slightly different binding energies depending on the environment of the carbon atoms. Figure 4 shows the high-resolution XPS spectra at the C 1s core level for GO and rGO samples prepared by reactions at 25 °C for 7 days and at 80 °C for 3 h (rGO-25 and rGO-80, respectively
- degree of reduction of the rGO-80 sample. This also points out the very important role of the temperature on the recovery of the sp2 carbon network in graphene oxide. Analogously to C 1s, XPS spectra at the N 1s core level can be discussed in detail and provide interesting structural information on the
- information on the oxidation and doping states of the polymer in PANI-based materials. Figure 5 shows XPS spectra at the N 1s core level of PANI and rGO/PANI and rGO/PANI/hexNb nanocomposites, and the respective curve fitting results. The N 1s peak of PANI-based materials is dominated by an amine (–NH


Nanostructure-induced performance degradation of WO3·nH2O for energy conversion and storage devices
Beilstein J. Nanotechnol. 2018, 9, 2845–2854, doi:10.3762/bjnano.9.265

- . Figure 5b,c depicts the high-resolution XPS core-level W4f and O1s spectra, respectively. The W 4f orbitals in Figure 5b are almost identical in the three samples and can be resolved into W 4f5/2 and W 4f7/2. The two main peaks correspond to the W4f7/2 and W4f5/2 of the tungsten atoms in a +6 oxidation
- , respectively. High-resolution XPS core-level b) W4f and c) O1s spectra of the three as-synthesized samples. CV curves of the three samples at a) the 1st cycle and b) the 500th cycle; schematic illustration of ion intercalation into c) WO3·2H2O, d) WO3·H2O, and e) WO3. SEM images of the three typical samples


Au–Si plasmonic platforms: synthesis, structure and FDTD simulations
Beilstein J. Nanotechnol. 2018, 9, 2599–2608, doi:10.3762/bjnano.9.241

- same spectra measured for the as-prepared film and for bulk Au are added. The binding energy of the Au 4f core-level shifts, depending on cluster size, cluster–substrate interactions, cluster morphology and charge transfer between cluster and substrates [23][24]. Additionally, the peak ratio of the Au


Phosphorus monolayer doping (MLD) of silicon on insulator (SOI) substrates
Beilstein J. Nanotechnol. 2018, 9, 2106–2113, doi:10.3762/bjnano.9.199

- dwell time of 0.3 s and a pass energy of 50 eV. Core-level scans were acquired at the applicable binding energy range with a step size of 0.1 eV, dwell time of 0.1 s and pass energy of 20 eV averaged over 10 scans. A non-monochromated Al Kα X-ray source at 200 W power was used for all scans. All spectra


Metal-free catalysis based on nitrogen-doped carbon nanomaterials: a photoelectron spectroscopy point of view
Beilstein J. Nanotechnol. 2018, 9, 2015–2031, doi:10.3762/bjnano.9.191

- exhibits a vacancy as neighbor. The different nitrogen configurations are easily distinguished by XPS according to the binding energy of the N 1s core level spectra. The pyridinic configuration is usually found at 398–399 eV, the pyrrolic configuration and other defective components at 399.5–400.5 eV, and
- -doping effect. This behavior is reflected in the DOS at the Fermi level, and it can be clearly observed in Figure 3 in which the VB spectra of N-doped CNTs are reported together with the respective N 1s core level spectra [58]. After plasma exposure, the amount of pyrrolic and pyridinic nitrogen
- , 550 and 750 °C, allowing one to obtain approximately the same amount of nitrogen (around 7 atom %) but different ratios between graphitic N and pyridinic N of 0.7 and 2.3, respectively. The obtained N 1s core level spectra are shown in Figure 8a,b. The reported catalytic activity measured by CV and


Toward the use of CVD-grown MoS2 nanosheets as field-emission source
Beilstein J. Nanotechnol. 2018, 9, 1686–1694, doi:10.3762/bjnano.9.160

- indicates the presence of more than three layers of MoS2 [23]. The chemical state of the as-grown samples was investigated by XPS. The Mo 3d, S 2p and O 1s high-resolution core-level spectrum fits are presented in Figure 2b,c. The corresponding data analysis results are given in Table S1 (Supporting
- Information File 1). In the high-resolution Mo 3d core-level spectrum fit, the doublet Mo 3d5/2 and Mo 3d3/2 peaks at 228.9 and 232 eV, respectively, are attributed to the formation of MoS2 (Figure 2b) [23][24]. This is further confirmed by the presence of a shoulder in the S 2s region at 226.2 eV [23]. A
- the S 2p core-level spectrum fit presented in Figure 2c, with the S 2p3/2 and S 2p1/2 component peaks appearing at 161.8 and 163 (MoS3) eV (Table S1, Supporting Information File 1), respectively, with a spin–orbit energy separation of 1.2 eV corresponding to MoS2 (S2− oxidation state) [24]. In the O


Sheet-on-belt branched TiO2(B)/rGO powders with enhanced photocatalytic activity
Beilstein J. Nanotechnol. 2018, 9, 1550–1557, doi:10.3762/bjnano.9.146

- , b) TEM and (c) HRTEM image of sample TGN-branch 4 h. The inset in (b) shows the corresponding SAED pattern. Raman spectra of samples TGN and TGN-branch 4 h recorded over the range of (a) 100–1000 cm−1 and (b) 1000–2000 cm−1. (a) XPS survey spectrum and core level XPS spectra of (b) Ti 2p, (c) C 1s


Cr(VI) remediation from aqueous environment through modified-TiO2-mediated photocatalytic reduction
Beilstein J. Nanotechnol. 2018, 9, 1448–1470, doi:10.3762/bjnano.9.137


Cyclodextrin inhibits zinc corrosion by destabilizing point defect formation in the oxide layer
Beilstein J. Nanotechnol. 2018, 9, 936–944, doi:10.3762/bjnano.9.86
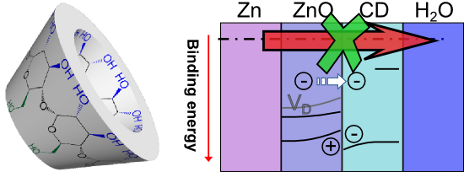
- II UPS sensitivity area. Band bending was observed at the interface between the ZnO thin film and β-CD on top. While the Zn 3d and VB energy changes are ≈0.40 eV, Zn 2p as the main Zn core level shifts ≈0.50 eV towards lower binding energy. The different traces of VBonset and VBmax are attributed to


Graphene composites with dental and biomedical applicability
Beilstein J. Nanotechnol. 2018, 9, 801–808, doi:10.3762/bjnano.9.73

- 0.47 eV). High resolution spectra for the core level C 1s and O 1s were recorded in 0.05 eV steps. An electron flood gun was used during the measurements to prevent sample charging. The FLG material was also characterized by TEM, HRTEM (Jeol ARM at 80 kV) and helium ion microscopy (HeIM, Zeiss Orion at


Facile synthesis of a ZnO–BiOI p–n nano-heterojunction with excellent visible-light photocatalytic activity
Beilstein J. Nanotechnol. 2018, 9, 789–800, doi:10.3762/bjnano.9.72

- and B-6 samples. They are characteristics of Zn 2p1/2 at 1043 eV and Zn 2p3/2 at 1020 eV ascribed to the Zn2+ state [47]. In the Zn 2p core level of B-4, a pair of satellite peaks are observed with binding energy of 1045.65 and 1022.65 eV, which are probably caused by the change of chemical state of


Single-step process to improve the mechanical properties of carbon nanotube yarn
Beilstein J. Nanotechnol. 2018, 9, 545–554, doi:10.3762/bjnano.9.52

- analyzer with a 128-channel detector. Survey data were collected at 200 eV pass energy and an energy resolution of 1 eV/step, while core level data were collected at 50 eV pass energy and 0.1 eV/step energy resolution. Sample charging was eliminated by using the dual-beam charge compensation source of the


Ultralight super-hydrophobic carbon aerogels based on cellulose nanofibers/poly(vinyl alcohol)/graphene oxide (CNFs/PVA/GO) for highly effective oil–water separation
Beilstein J. Nanotechnol. 2018, 9, 508–519, doi:10.3762/bjnano.9.49

- photoelectron spectroscopy was carried out (Figure 5a). The higher C/O ratio of rGO revealed the effective reduction during the thiolation reaction, which was verified more clearly in the high-resolution C 1s core-level spectra shown in Figure 5b and 5c. The typical C 1s core-level spectrum was divided into


Patterning of supported gold monolayers via chemical lift-off lithography
Beilstein J. Nanotechnol. 2017, 8, 2648–2661, doi:10.3762/bjnano.8.265

- computationally analyzed the XPS core-level shifts (CLSs) for each Au atom in the lifted-off complexes (Figure S11, Supporting Information File 1). These calculated spectra are signatures of the predicted structures resulting from CLL of SAMs packed on Au with and without defects. When comparing the spectra and
- the structures, we found that the shifts are spread ≈1.5 eV around the bulk reference value, and similar chemical environments of the Au atoms resulted in similar core-level shift energies. These simulations indicate that the CLSs of a Au atom in a Au–alkanethiolate monolayer are sensitive to its
- energy of the system damping to the energy added due to pulling. Core-level shifts were calculated for the Au atoms in the modeled structures that were removed from surfaces in the simulations. The density functional theory with the PBE functional was used again via GPAW to calculate the energies of the


Ta2N3 nanocrystals grown in Al2O3 thin layers
Beilstein J. Nanotechnol. 2017, 8, 2162–2170, doi:10.3762/bjnano.8.215

- 4p or N 1s core levels. We focus our XPS measurements on the Ta 4f photoemission, which shows a more distinctive structure and larger chemical shifts than the emissions from the Ta 4p and N 1s levels [30][31]. As an example, we show in Figure 5 the Ta 4f core level photoemission spectra taken from
- nm and (b) 12 nm. The curves are vertically shifted for clarity. SIMS profiles of as-grown and annealed MLs for two different nominal thicknesses of the metallic layers: (a) 4 nm for ML4m and ML4m9 and (b) 12 nm for ML12m and ML12m9. Deconvoluted XPS spectra for Ta 4f core level of as-grown (upper


Intercalation of Si between MoS2 layers
Beilstein J. Nanotechnol. 2017, 8, 1952–1960, doi:10.3762/bjnano.8.196

- photoelectron spectroscopy (XPS) [31]. It should be pointed out here that this study showed that the S 2p3/2 peak in MoS2 is at around 167.6 eV, which is considerably higher than the pure core-level line of pure S. This high value might be an indication of contamination with O [32] or Ni [33]. Here we revisit
- measurements, the pressure was kept at or below 1 × 10⁻⁹ mbar. The angle between the X-ray source, which is aligned along the surface normal, and spectrometer is 54.7°. All XPS core-level spectra were analyzed using Augerscan software, which is equipped with its own curve-fitting program. The core-level peaks
- are fitted using a Gaussian–Lorentzian (GL) function to include the instrumental response function along with the core-level line shape. The secondary-electron background was subtracted using a Shirley function [34]. The energy differences between the 3d and 2p spin–orbit couples were set to 3.13 eV


Coexistence of strongly buckled germanene phases on Al(111)
Beilstein J. Nanotechnol. 2017, 8, 1946–1951, doi:10.3762/bjnano.8.195

- energy electron diffraction and core-level photoelectron spectroscopy. Experimental results show that a germanium layer can be formed at a relatively high substrate temperature showing either (3×3) or (√7×√7)R±19.1° reconstructions. First-principles calculations based on density functional theory suggest
- an atomic model consisting of a strongly buckled (2×2) germanene layer, which is stable in two different orientations on Al(111). Simulated STM of both orientations fit nicely with experimental STM images and the Ge 3d core-level data decomposed into four components is consistent with the suggested
- model. Keywords: core-level spectroscopy; DFT; germanene; STM; Introduction The properties of two-dimensional (2D) materials are currently subjected to intense experimental and theoretical studies. The research is focused on many important properties predicted by theory for various conceivable 2D


Methionine-mediated synthesis of magnetic nanoparticles and functionalization with gold quantum dots for theranostic applications
Beilstein J. Nanotechnol. 2017, 8, 1734–1741, doi:10.3762/bjnano.8.174

- cobalt ferrite NPs was also investigated using X-ray photoelectron spectroscopy (XPS). The surface chemical composition of the CoFe2O4@Met–Au NPs is presented in Table 1, whereas the typical core-level spectrum of the deposited gold is presented in Figure 5. As shown, the main Au 4f7/2 photoelectron peak
- is located at a binding energy (BE) value of 83.94 eV, typical of pure metallic Au0 species [31]. The fitting of the Au 4f core-level spectrum is performed further by using two spin–orbit split Au 4f7/2 and Au 4f5/2 components, separated by 3.56 eV. Surprisingly, the Au 4f curve fitting shows an
- calibration, processing and fitting routines were done using Avantage software (5.918) provided by Thermo VG Scientific. Core-level peaks of Fe 2p, Co 2p, Au 4f, C 1s and O 1s were analyzed using a nonlinear Shirley-type background and the calculation of the elemental composition was performed on the basis of


Fluorination of vertically aligned carbon nanotubes: from CF4 plasma chemistry to surface functionalization
Beilstein J. Nanotechnol. 2017, 8, 1723–1733, doi:10.3762/bjnano.8.173

- range used for the plasma diagnostic. In Figure 3, we report the XPS analysis performed on the samples immediately after the fluorination. The C 1s and F 1s core level spectra are illustrated for the selected set of plasma parameters: power (Figure 3a,b), time (Figure 3d,e) and distance (Figure 3g,h
- , CF–CFn, CF2 and CF3 bond configurations [27][30]. The bars at the top axis of the frames indicate the binding energy of these peaks. The asymmetric line-shape of F 1s core level signal is representative for the two carbon-fluorine bonds. They include a contribution around 686 eV, which corresponds to
- concentrations are evaluated from the F 1s and C 1s core level spectra shown in Figure S4 in Supporting Information File 1. The valence band spectra are reported in Figure 5a for the pristine (black curve) and for the fluorinated vCNT before and after heating (blue and green curves, respectively). In the binding


Effect of the fluorination technique on the surface-fluorination patterning of double-walled carbon nanotubes
Beilstein J. Nanotechnol. 2017, 8, 1688–1698, doi:10.3762/bjnano.8.169

- [29]. A spectrum arises as a result of core-level electrons being excited into partially filled and empty states, thus providing information about the unoccupied density of states of the X-ray absorbing elements. We consider the F K-edge spectra because they showed a considerable variation of the pre


Charge transfer from and to manganese phthalocyanine: bulk materials and interfaces
Beilstein J. Nanotechnol. 2017, 8, 1601–1615, doi:10.3762/bjnano.8.160

- in the core-level region, and polarization-dependent studies have often been carried out to study the molecular orientation on substrates. In addition to our experiments we performed calculations within the density functional theory (DFT) framework. We used a recent version of the NRLMOL all-electron
- exact composition of these phases was finally determined by an analysis of the respective C 1s and K 2p core-level excitations. These data are depicted in Figure 3. In this Figure, excitation from the C 1s core level in unoccupied π-derived states start at about 285 eV, those into σ-derived carbon
- structure has its origin in the fact that the phthalocyanine ring consists of carbon atoms with different chemical environments, namely those with nitrogen as neighbors and those without. This is clearly seen in corresponding C 1s core-level photoemission data [74][81][82], in which the binding energy for


Oxidative chemical vapor deposition of polyaniline thin films
Beilstein J. Nanotechnol. 2017, 8, 1266–1276, doi:10.3762/bjnano.8.128

- . To investigate the presence of the antimony pentachloride oxidant before and after washing, high resolution Cl2p and Sb3d core level XPS spectra were obtained (Figure S2, Supporting Information File 1). From these spectra, the amount of Cl and Sb in the as-deposited film was 6.9 and 11.59 atom


