Search results
Search for "impedance" in Full Text gives 172 result(s) in Beilstein Journal of Nanotechnology.
Porous N- and S-doped carbon–carbon composite electrodes by soft-templating for redox flow batteries
Beilstein J. Nanotechnol. 2019, 10, 1131–1139, doi:10.3762/bjnano.10.113

- (CV) and electrochemical impedance spectroscopy (EIS). The N- and S-doped carbon electrodes show promising activity for the positive side reaction and could be seen as a significant advance in the design of carbon felt electrodes for use in redox flow batteries. Keywords: N- and S-doped carbon
- readily on the composite electrodes than on the undoped reference materials. Additional electrochemical impedance spectroscopy was performed to study the charge transfer of the VO2+/VO2+ redox reaction. The corresponding Nyquist plots are displayed in Figure 7. In the described circuit Ru stands for the
- analysis. Electrochemical data of the VO2+/VO2+ redox couple obtained from cyclic voltammograms. Values for the charge transfer resistance and the double-layer capacity received by fitting the impedance data with corresponding circuit model in Figure 7 and converting the CPE parameters following Hirschorn


Glucose-derived carbon materials with tailored properties as electrocatalysts for the oxygen reduction reaction
Beilstein J. Nanotechnol. 2019, 10, 1089–1102, doi:10.3762/bjnano.10.109

- basic electrolyte at 1600 rpm and the Nyquist plot obtained from electrochemical impedance spectroscopy measurements are shown in Figure 2a and 2b, respectively. To evaluate the performance of the prepared electrocatalysts, cyclic voltammetry (CV) and linear sweep voltammetry (LSV) were performed. LSV
- microporosity, which can be related to the more developed porous structure. These two effects can be confirmed by the electrochemical impedance spectroscopy measurements (Figure 2b). The Nyquist plot shows that a higher degree of activation results in a lower cell resistance and a smaller semicircle at high
- Warburg impedance, indicating a higher resistance of the electrolyte ion diffusion into the porous structure, and hence, a lower value of limiting current density. These diffusion limitations are less evident for those samples with wider pore size, as pores act as diffusion channels favoring the kinetics


Direct growth of few-layer graphene on AlN-based resonators for high-sensitivity gravimetric biosensors
Beilstein J. Nanotechnol. 2019, 10, 975–984, doi:10.3762/bjnano.10.98

- detailed study of the influence of growth conditions on the characteristics of the graphene layers grown in our system can be found in [19]. To check whether the performance of the SMRs was affected by the integration of graphene, we measured the electrical impedance spectra of the SMRs before and after
- and quality factor of the resonators remain almost constant, with typical values of, respectively, 3% and 150 [20]. It is worth noting that the modulus of the impedance displays a minimum at around 3000 MHz due to the LC resonance that arises from the static capacitance of the resonator and the series
- ) and low (SiO2) acoustic impedance of the fully insulating reflector, the Ir/AlN/Mo piezoelectric stack and the Ni catalyst that covers the active area of the device (Figure 8a). All these layers were adjusted to set the resonant frequency to the desired value and to achieve the best performance of the


In situ AFM visualization of Li–O2 battery discharge products during redox cycling in an atmospherically controlled sample cell
Beilstein J. Nanotechnol. 2019, 10, 930–940, doi:10.3762/bjnano.10.94

- design permitted acquisition of electrochemical impedance spectroscopy, contributing information about electrical double layers under the system’s controlled environment. This characterization method can be applied to a wide range of reactive surfaces undergoing transformations under carefully controlled
- of water in the electrolyte. In our previous attempt [25] a closed AFM cell was exposed to atmosphere during imaging and discharge with oxygen saturated solvent precluding any impedance spectroscopy and cell recharge studies. Lang et al. discussed in situ AFM studies of lithium/sulfur [26] batteries
- many of the previous studies mentioned above, improvements in cell design have allowed us to keep the battery cell completely sealed during discharge, charge, and collection of electrochemical impedance spectra. The controlled atmosphere allowed our study to trace the topographical changes on the


An efficient electrode material for high performance solid-state hybrid supercapacitors based on a Cu/CuO/porous carbon nanofiber/TiO2 hybrid composite
Beilstein J. Nanotechnol. 2019, 10, 781–793, doi:10.3762/bjnano.10.78

- pseudo-capacitance behavior. Electrochemical measurements were performed by cyclic voltammetry, galvanostatic charge–discharge and electrochemical impedance spectroscopy. The highest specific capacitance value of 530 F g−1 at a current density of 1.5 A g−1 was obtained for the Cu/CuO/PCNF/TiO2 composite
- given in Figure 2. Cyclic voltammetry (CV) and galvanostatic charge–discharge (GCD) tests for the synthesized samples and its composites were performed over a voltage range from 0 to 0.8 V. The electrochemical impedance spectra (EIS) were recorded employing the same instrument over a frequency range of
- The electrochemical studies of developed electrode materials for supercapacitors were executed by cyclic voltammetry, galvanostatic charge–discharge, and electrochemical impedance spectroscopy in a 1 M H2SO4 aqueous electrolyte in a three-electrode configuration. Figure 10a shows the CV curves of TiO2


An iridescent film of porous anodic aluminum oxide with alternatingly electrodeposited Cu and SiO2 nanoparticles
Beilstein J. Nanotechnol. 2019, 10, 735–745, doi:10.3762/bjnano.10.73

- sealing the pores with hot water was to close the pores in the anodic oxide film and hence to avoid impurities entering the film. Electrochemical properties Electrochemical impedance testing was carried out by applying a small-amplitude AC voltage to the system and measuring the ratio of the signal
- voltage to the current (this ratio was defined as the system impedance) with the change of the sinusoidal-wave frequency, or the variation of the phase angle of the impedance with the change in frequency. Nyquist and Bode diagrams can be obtained by the electrochemical impedance measurements. The
- interfacial impedance of the sample was estimated on the basis of the analysis described above, and the corrosion resistance performance was evaluated in more detail. Furthermore, the electrical polarization process of the sample in the test solution was studied by analyzing the Nyquist and Bode diagrams. The


A porous 3D-RGO@MWCNT hybrid material as Li–S battery cathode
Beilstein J. Nanotechnol. 2019, 10, 514–521, doi:10.3762/bjnano.10.52

- the conductivity during cycling a Li–S battery equipped with the S-3D-RGO@MWCNT cathode, were investigated using electrochemical impedance spectroscopy (EIS). Figure 8 presents the Nyquist plots for the Li–S cell assessed before cycling, and after the 1st and the 4th cycle. In the high-frequency
- region the x-intercept is attributed to the contact resistance (R0), and the semicircle is attributed to the charge-transfer resistance (Rct) at the electrode/electrolyte interface. Finally, the inclined slope in the low-frequency region is associated with the Warburg impedance (W) [28], which correlates
- to the Li+ transportation process. Notably, there is a significant shift in the impedance curves before and after cycling. The primary reason for the decrease in the contact resistance after the initial cycle may be the redispersion of sulfur. The significant shift in the Warburg element indicates an


Nanocomposite–parylene C thin films with high dielectric constant and low losses for future organic electronic devices
Beilstein J. Nanotechnol. 2019, 10, 428–441, doi:10.3762/bjnano.10.42

- frequencies for this sample is probably the consequence of a parasitic impedance at the electrode–polymer interface. This observation is related to the fact that this material has the highest roughness (see Table 2) and the deposition of the upper electrode for the measurement is probably impacted by the
- properties were measured using a Novocontrol broadband dielectric spectroscopy (BDS20) impedance meter in the frequency range of 0.1–106 Hz at room temperature. Ag dose (left) and film thickness (right) versus rotations. Film thickness versus RBS thickness (see text for details). Blue and red squares data


Electromagnetic analysis of the lasing thresholds of hybrid plasmon modes of a silver tube nanolaser with active core and active shell
Beilstein J. Nanotechnol. 2019, 10, 294–304, doi:10.3762/bjnano.10.28

- the laser cavity. In line with the classical electromagnetics of time-harmonic fields (depending on time as e−iωt), these quantities are where Z0 is the free-space impedance, ε = ν2, S is a closed surface, which contains all resonator elements, and is the mode complex Poynting vector. If the active


![[Graphic 29]](/bjnano/content/inline/2190-4286-10-28-i46.svg?max-width=637&scale=1.18182) λ = 565.03...
λ = 565.03...

![[Graphic 36]](/bjnano/content/inline/2190-4286-10-28-i53.svg?max-width=637&scale=1.18182) ...
...


A Ni(OH)2 nanopetals network for high-performance supercapacitors synthesized by immersing Ni nanofoam in water
Beilstein J. Nanotechnol. 2019, 10, 281–293, doi:10.3762/bjnano.10.27

- employed as the working electrodes, the counter electrode and the reference electrode, respectively. Cyclic voltammograms (CV), galvanostatic charge/discharge curves (GCD) and electrochemical impedance spectroscopy (EIS) measurements were carried out using an electrochemical workstation (Chenhua CHI660D
- reservoir” structure is badly damaged. This results in a decrease in the surface area of active materials and subsequently leads to the decline in the volumetric capacitance of the electrode. Impedance spectroscopy To better understand the kinetics of the charge transfer within the electrodes, EIS
- measurements were also carried out. The impedance spectra (Nyquist plots) are shown in Figure 7c,d. The inset is the equivalent electrical circuit. The intersection with the Z′-axis represents the equivalent series resistance (Rs). All Nyquist plots exhibit a small semi-circle at high frequencies and a


Threshold voltage decrease in a thermotropic nematic liquid crystal doped with graphene oxide flakes
Beilstein J. Nanotechnol. 2019, 10, 71–78, doi:10.3762/bjnano.10.7

- oscilloscope (Tektronix TDS 2014) was used to register the electro-optical response. The duration of the driving pulse was 1 s. Dielectric spectroscopy (DS) studies were performed using an impedance analyzer (Agilent 4294A) and conducted over a broad frequency range from 100 Hz to 10 MHz, with the oscillation


Amorphous NixCoyP-supported TiO2 nanotube arrays as an efficient hydrogen evolution reaction electrocatalyst in acidic solution
Beilstein J. Nanotechnol. 2019, 10, 62–70, doi:10.3762/bjnano.10.6

- by cyclic voltammetry, linear sweep voltammetry, and electrochemical impedance spectroscopy. We show that after incorporating Co into Ni–P, the resulting NixCoyP/TNAs present enhanced electrocatalytic activity due to the improved electron transfer and increased electrochemically active surface area
- electrochemical workstation (Chenhua, Shanghai) including linear sweep voltammetry (LSV), cyclic voltammetry (CV), electrochemical impedance spectroscopy (EIS), and Tafel analysis at 25 °C. The three electrode system was constituted of the sample working electrode, a platinum counter electrode, a Ag/AgCl
- active site density, and thus the electrocatalytic activity. The Nyquist and Bode plots are displayed in Figure 8. In the Nyquist plot, the arc radius of the high-frequency section corresponds to the impedance of charge transfer between electrolyte and the catalyst surface, and the ones of the low


Electrolyte tuning in dye-sensitized solar cells with N-heterocyclic carbene (NHC) iron(II) sensitizers
Beilstein J. Nanotechnol. 2018, 9, 3069–3078, doi:10.3762/bjnano.9.285

- achieved giving η in the range of 0.47 to 0.57% which represents 7.8 to 9.3% relative to an N719 reference DSC set at 100%. Electrochemical impedance spectroscopy has been used to understand the role of the MBI additive in the electrolytes. Keywords: dye-sensitized solar cell; electrolyte; nanoparticles
- mV (no TBP) to 541 mV (0.5 M TBP). However, this gain is not sufficient to enhance the global efficiency which drops from 0.51% to 0.26% (Table 4). The trends are reproduced for duplicate DSCs (Table S2, Supporting Information File 1). Electrochemical impedance spectroscopy (EIS) Electrochemical
- impedance spectroscopy (EIS) is an important technique for the investigation of interfaces in DSCs [49][50]. Fitting of the Nyquist and Bode plots, which are used to describe the EIS results, leads to parameters including the recombination resistance (Rrec), electron/hole transport resistance (Rtr), charge


Charged particle single nanometre manufacturing
Beilstein J. Nanotechnol. 2018, 9, 2855–2882, doi:10.3762/bjnano.9.266


Impact of the anodization time on the photocatalytic activity of TiO2 nanotubes
Beilstein J. Nanotechnol. 2018, 9, 2628–2643, doi:10.3762/bjnano.9.244

- hypothesis of a doping effect originating from an extended anodization time (Figure S3a, Supporting Information File 1). As it was stated in previous sections, a relation between the capacitive processes seems to be associated with the length of the TNTs. Consequently, electrochemical impedance spectroscopy


ZnO-nanostructure-based electrochemical sensor: Effect of nanostructure morphology on the sensing of heavy metal ions
Beilstein J. Nanotechnol. 2018, 9, 2421–2431, doi:10.3762/bjnano.9.227

- more potential applications. Electrochemical methods such as cyclic voltammetry (CV), impedance spectroscopy (IS) and differential pulse voltammetry (DPV) are highly efficient in both qualitative and quantitative analysis of solutions [9][10][11]. These methods allow for the detection of hazardous


Correlative electrochemical strain and scanning electron microscopy for local characterization of the solid state electrolyte Li1.3Al0.3Ti1.7(PO4)3
Beilstein J. Nanotechnol. 2018, 9, 1564–1572, doi:10.3762/bjnano.9.148

- improvement of solid state electrolytes such as LATP is a better understanding of interfacial and ion transport properties on relevant length scales in the nanometer to micrometer range. Using common techniques, such as electrochemical impedance spectroscopy, only global information can be obtained. In this
- grain boundaries with an overall conductivity of 0.2 mS cm−1 [11] and has therefore attracted much research within the last decade [12][13][14][15]. In classical electrochemical impedance spectroscopy (EIS), the ionic conductivity is measured through the entire sample and over the full electrode contact
- area (typically in the range of 1 cm2). Hence, only averaged values are obtained whilst locally the ion mobility can still be inhomogeneous [11]. Translating local ion migration into global conductivity is part of ongoing research. First approaches for small-scale impedance measurements have been


Excitation of nonradiating magnetic anapole states with azimuthally polarized vector beams
Beilstein J. Nanotechnol. 2018, 9, 1478–1490, doi:10.3762/bjnano.9.139

- Poynting vector of the incident field over an infinite plane, oriented transverse to the optical axis, we can calculate the total power that such a focused beam carries. It is given by the formula below: where Z0 is the wave impedance of free space. At this point, we would also like to consider the case of
- and x1 = n1k0α0 are used, with α0 being the sphere radius and n1 its refractive index. Z1 is the wave impedance inside the particle and x0 is called the size parameter of the sphere. We will close this section by unveiling the property that the T-matrix of one particle should have in order to be able


Cr(VI) remediation from aqueous environment through modified-TiO2-mediated photocatalytic reduction
Beilstein J. Nanotechnol. 2018, 9, 1448–1470, doi:10.3762/bjnano.9.137

- charge carrier separation and transfer [99][100][101]. Electrochemical impedance studies (EIS) explore the resistance of a material through a Nyquist plot. A smaller arc radius of the Nyquist plot suggests better transfer of charge carriers with lower resistance. The modification of TiO2 with ferrites


Tailoring polarization and magnetization of absorbing terahertz metamaterials using a cut-wire sandwich structure
Beilstein J. Nanotechnol. 2018, 9, 1437–1447, doi:10.3762/bjnano.9.136

- provided the polarization at the edge of cut-wires, and the surface current density on the cut-wires at top and bottom layers effectively generated the magnetization. By controlling and optimizing the geometrical configurations of the entire sandwich device (without lateral misalignment), the impedance
- the background, and the metamaterial structure. The two parts are separated by a dielectric spacer. Another necessary condition found was that absorbers can be achieved by increasing the imaginary part of the refractive index and matching the impedance of the metamaterial with air impedance [24][25
- sandwich structure can be organized to achieve another specific application objective, that is, a high-performance absorber. By controlling and optimizing the geometrical configurations of the entire sandwich device without lateral misalignment, the impedance can be matched to that of free space while


New 2D graphene hybrid composites as an effective base element of optical nanodevices
Beilstein J. Nanotechnol. 2018, 9, 1321–1327, doi:10.3762/bjnano.9.125

- : where Z0 is the characteristic impedance of free space and Jx is the x-component of the surface current density vector. The final expression obtained for the reflection and transmission coefficients, R and T, in the case of a p-polarized incident wave takes the following form: and in the case of s
- -polarization where Z0 is defined for the p-polarized wave as Z0 = Ex/Hy = η·cosθ, and for the s-polarized wave as Z0 = −Ey/Hy = η/cosθ, where θ is the angle of incidence η = 120π Ω is the input impedance of vacuum. Taking into account expressions for the reflection and transmission coefficients, is it possible


Ag2WO4 nanorods decorated with AgI nanoparticles: Novel and efficient visible-light-driven photocatalysts for the degradation of water pollutants
Beilstein J. Nanotechnol. 2018, 9, 1308–1316, doi:10.3762/bjnano.9.123

- impedance spectroscopy (EIS) measurement was applied to study the charge transport and separation [49]. A smaller arc radius commonly signifies a higher charge transport rate. As displayed in Figure 10, the arc radius of 0.3AgI/Ag2WO4 is smaller than that of AgI, suggesting that 0.3AgI/Ag2WO4 holds a higher
- RhB in the presence of 0.3AgI/Ag2WO4. (a) The cycled photocatalytic degradation of RhB over 0.3AgI/Ag2WO4; (b) XRD patterns of the fresh and used 0.3AgI/Ag2WO4. Active-species trapping tests over 0.3AgI/Ag2WO4. Electrochemical impedance spectroscopy (EIS) Nyquist plots of AgI and 0.3AgI/Ag2WO4


Cyclodextrin inhibits zinc corrosion by destabilizing point defect formation in the oxide layer
Beilstein J. Nanotechnol. 2018, 9, 936–944, doi:10.3762/bjnano.9.86
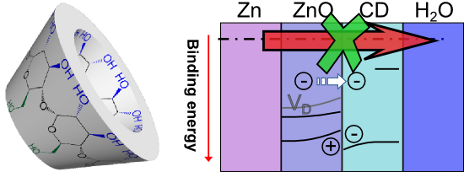
- . This work uses electrochemical impedance spectroscopy to show the cyclic oligosaccharide β-cyclodextrin (β-CD) to inhibit corrosion of zinc in 0.1M chloride with an inhibition efficiency of up to 85%. Only a monomolecular adsorption layer of β-CD is present on the surface of the oxide covered metal
- inhibitors [8][12][13]. Metallic zinc is industrially used for cathodic protection of steel [15]. In this work, the inhibition of zinc corrosion by β-CD was investigated electrochemically. Inhibition efficiencies were determined by electrochemical impedance spectroscopy (EIS). After exposure to chloride
- potential in a frequency range from 104 to 10−1 Hz. The impedance spectra were fitted using the software ZView. The resulting impedance spectra and the equivalent circuit for data fitting are shown in Figure S2 (Supporting Information File 1). From EIS data, the corrosion current densities icorr were


Facile synthesis of ZnFe2O4 photocatalysts for decolourization of organic dyes under solar irradiation
Beilstein J. Nanotechnol. 2018, 9, 436–446, doi:10.3762/bjnano.9.42

- band-edge potential, a mechanism of the photocatalytic reaction has been proposed which is discussed later. Electrochemical impedance study Impedance measurements are commonly used to determine the charge transfer, resistance, and effective charge separation processes occurring at electrode–electrolyte


Design of polar self-assembling lactic acid derivatives possessing submicrometre helical pitch
Beilstein J. Nanotechnol. 2018, 9, 333–341, doi:10.3762/bjnano.9.33

- permittivity was measured during cooling using a Schlumberger 1260 impedance analyser in the frequency range of 10 Hz–1 MHz, keeping the temperature of the sample stable during frequency sweeps within ±0.1 K. Differential scanning calorimetry (DSC) plot of heating/cooling runs (indicated by horizontal arrows


