Search results
Search for "EDX" in Full Text gives 252 result(s) in Beilstein Journal of Nanotechnology. Showing first 200.
Synthesis of MnO2–CuO–Fe2O3/CNTs catalysts: low-temperature SCR activity and formation mechanism
Beilstein J. Nanotechnol. 2019, 10, 848–855, doi:10.3762/bjnano.10.85

- , also verifying the generation of metal oxide catalysts on the CNT surface. The EDX spectrum (Figure 3d) shows signals of Mn, Cu, Fe, O and C. Clear lattice fringes of the metal oxides cannot be observed in the HRTEM images, indicating the generation of amorphous materials, which is consistent with the
- formation of metal oxide catalysts on CNTs. The STEM-EDX mappings (Figure 5b–g) exhibit a series of columnar element-distribution images, further proving that the metal oxide catalysts have been successfully loaded on the CNTs. Hydrogen temperature-programmed reduction analysis In SCR reaction, the redox
- catalysts: (a) acid-treated CNTs, (b) 1% MnO2–CuO–Fe2O3/CNTs, (c) 2% MnO2–CuO–Fe2O3/CNTs, (d) 4% MnO2–CuO–Fe2O3/CNTs, (e) 6% MnO2–CuO–Fe2O3/CNTs, and (f) Mn–Cu–FeOx/CNTs-IWIM. TEM and HRTEM images, as well as EDX spectrum of CNT-based samples: (a) CNTs, (b–d) 4% MnO2–CuO–Fe2O3/CNTs. XPS results of the as


Ceria/polymer nanocontainers for high-performance encapsulation of fluorophores
Beilstein J. Nanotechnol. 2019, 10, 522–530, doi:10.3762/bjnano.10.53

- electron microscopy (SEM) with a LEO Gemini 1530 field-emission microscope operated with an extractor voltage of 0.7 kV. Samples for SEM observation were prepared by dropping the diluted dispersions on small silicon wafers that were subsequently dried. EDX analysis combined with elemental mapping was
- Figure 3, was unambiguously assigned to crystalline CeO2 (ceria, JPCD card No. 34-0394). Elemental mapping by EDX also confirmed the presence of cerium in the investigated areas (see Supporting Information File 1, Figure S3). TEM images of ceria hybrid nanocapsules in Figure 4 indicate a homogeneous
- (sample NC-CeO2 at ambient conditions). Characteristics of the samples reported in this work. Supporting Information Supporting Information File 80: Chemical structure of TDI, absorption and emission spectra of TDI, EDX spectra, TGA, and additional photoluminescence emission spectra of samples


Improving control of carbide-derived carbon microstructure by immobilization of a transition-metal catalyst within the shell of carbide/carbon core–shell structures
Beilstein J. Nanotechnol. 2019, 10, 419–427, doi:10.3762/bjnano.10.41

- impregnation of untreated titanium carbide was compared with the same loading (30 mg of nickel per gram of equivalent carbide). EDX mapping (see Figure S1 in Supporting Information File 1) of the impregnated core–shell material shows clearly the remaining core in the Ti K edge signal, while the Ni K and Cl K
- CDC material characterized by N2- and CO2-sorption. Supporting Information Supporting Information File 28: Additional data on SEM-EDX, Raman spectroscopy and temperature-programmed oxidation. Acknowledgements We acknowledge the funding of part of the research by the Deutsche Forschungsgemeinschaft


Integration of LaMnO3+δ films on platinized silicon substrates for resistive switching applications by PI-MOCVD
Beilstein J. Nanotechnol. 2019, 10, 389–398, doi:10.3762/bjnano.10.38

- analyzed by semi-quantitative energy-dispersive X-ray analyses (EDX) using an Oxford Inca Energy detector coupled to the SEM. A combined study in X-ray diffraction (XRD) and Raman spectroscopy was performed to determine the crystal structure of the films and to detect the presence/absence of secondary
- obtained by each strategy, structural and chemical studies were carried out by electron microscopy coupled to EDX. Within the resolution limit no differences in composition were observed for the different deposition strategies. Figure 3 shows the comparison of the surface films morphology with the same


One-step nonhydrolytic sol–gel synthesis of mesoporous TiO2 phosphonate hybrid materials
Beilstein J. Nanotechnol. 2019, 10, 356–362, doi:10.3762/bjnano.10.35

- spectroscopy (EDX) of these materials showed that in all cases the measured P/Ti ratios were close to the nominal ones, indicating that all the octylphosphonate units were incorporated in the materials (Table 1). The 31P solid-state NMR spectra of the hybrid materials (Figure 1) display a very broad signal in
- powder XRD patterns were collected with a PANalytical X’Pert Pro MPD diffractometer (Cu Kα1 = 0.1540598 nm). The SEM images were obtained with a Hitachi S-4800 electron microscope. EDX was done on an Oxford Instruments X-MaxN SDD instrument. Nitrogen adsorption and desorption isotherms were measured at


Study of silica-based intrinsically emitting nanoparticles produced by an excimer laser
Beilstein J. Nanotechnol. 2019, 10, 211–221, doi:10.3762/bjnano.10.19

- homogeneity of the emission features of the samples. Similarly, energy dispersive X-ray spectroscopy (EDX) data showed that the O, Ge and Si signals qualitatively correspond to the particle morphology, suggesting a generally uniform chemical composition of the Ge-doped samples. No significant CL signal could
- observed in the sample. To deeply investigate our sample in Figure 1c,d and e we report the energy dispersive X-ray spectroscopy (EDX) signals of the Si Kα1, Ge Lα1,2 and O Kα1 lines, respectively. The data have been recorded for the group of nanoparticles inside the red square named 1 in panel a. These
- produced nanoparticles, we recorded transmission electron microscopy (TEM) and scanning transmission electron microscope (STEM) images of the samples. Figure 3a illustrates the TEM image recorded for the same nanoparticles previously studied by EDX and SEM (red square named 1 in Figure 1a. Figure 3b


Uniform Sb2S3 optical coatings by chemical spray method
Beilstein J. Nanotechnol. 2019, 10, 198–210, doi:10.3762/bjnano.10.18

- solution at 200–210 °C. Elemental composition of as-deposited and thermally treated Sb2S3 layers The elemental composition of Sb2S3 in as-deposited and thermally treated glass/ITO/TiO2/Sb2S3 samples was determined using energy dispersive X-ray spectroscopy (EDX). The EDX results of studied Sb2S3 layers in
- solution, TD 200–210 °C, 3-200-As-dep., 3-210-As-dep., 3-200-170, 3-210-170) is ≈1.3. S/Sb is ≈1.5–1.6 in layers deposited from Sb/S 1:6 solution at 200–220 °C. We note that interpretation of EDX spectra of very thin layers is difficult. Most of our Sb2S3 layers are thinner than 100 nm, which could explain
- the divergence in the elemental composition of our Sb2S3 layers. Therefore, future studies by more surface sensitive methods are required. Overall, S/Sb in most studied samples approximates the stoichiometric value of 1.5 of Sb2S3. Oxygen could not be quantified by EDX due to the thin layers and high


Nanoporous water oxidation electrodes with a low loading of laser-deposited Ru/C exhibit enhanced corrosion stability
Beilstein J. Nanotechnol. 2019, 10, 157–167, doi:10.3762/bjnano.10.15

- the substrate/solution interface from the substrate side for 30 min (Figure 3a,b). Scanning electron micrographs of a sample prove the successful deposition of a continuous albeit somewhat rough thin (≤20 nm) film (Figure 4a,b). Furthermore, energy-dispersive X-ray (EDX) analysis confirms the presence
- inside the Al2O3 pores (with additional material on the front sample side, Figure 6a,d). In a last step, an ITO electrical contact is sputter-coated onto the front side of the sample. EDX spectroscopy reveals the presence of expected elements Al, O, P and In of the substrate and electrical contact, as
- given the amount of carbon present. Thus, the application of the Ru/C laser deposition to nanoporous Al2O3 substrates yields a significant improvement of the catalyst stability in comparison to planar substrates. EDX analyses (Figures S1 and S2, Table S1, Supporting Information File 1) and cyclic


pH-mediated control over the mesostructure of ordered mesoporous materials templated by polyion complex micelles
Beilstein J. Nanotechnol. 2019, 10, 144–156, doi:10.3762/bjnano.10.14

- through a N0Na+I− pathway (in our case Na+ coming from the sodium hydroxide solution used to adjust the pH) that has been proposed in some studies [4] does not hold in this high pH material synthesis, since the Na/Si molar ratio obtained from EDX measurements was too low (Na/Si ≈0.04) to support such an


Zn/F-doped tin oxide nanoparticles synthesized by laser pyrolysis: structural and optical properties
Beilstein J. Nanotechnol. 2019, 10, 9–21, doi:10.3762/bjnano.10.2

- structure. The main diffraction patterns of stannous fluoride (SnF2) were also identified and a reduction in intensity with increasing Zn percentage was evidenced. For the elemental composition estimation, energy dispersion X-ray spectroscopy (EDX) and X-ray photoelectron spectroscopy (XPS) measurements
- /DZnEt2, while keeping the sensitizer flow constant. In order to estimate the elemental composition for the Zn/F-doped SnO2 powders, EDX and XPS measurements were conducted; the results are presented in Table 1. In the XPS measurements, the peaks centered around 487 eV, 494 eV, 531.43 eV, 684 eV, 1022 eV
- as dimerization, dehydrogenation, polymerization, reticulation, aromatization and carbonization with the final formation of amorphous hydrogenated carbon. For the ZTO0.44 case, in spite of an apparent oxygen excess, the carbon is still formed (the EDX-extracted carbon atomic percent is the smallest


Femtosecond laser-assisted fabrication of chalcopyrite micro-concentrator photovoltaics
Beilstein J. Nanotechnol. 2018, 9, 3025–3038, doi:10.3762/bjnano.9.281
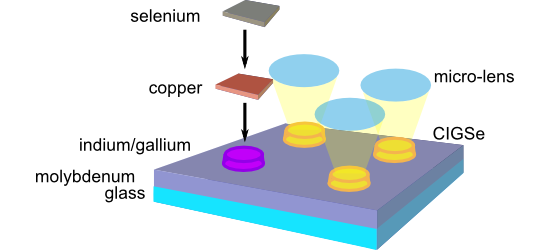
- with a distance of 500 µm was chosen, which is compatible with a potential geometry for micro-concentrator solar cells. The LIFT deposits were characterized with respect to morphological and chemical homogeneity by using SEM and energy dispersive X-ray spectroscopy (EDX). It was investigated whether


The nanoscaled metal-organic framework ICR-2 as a carrier of porphyrins for photodynamic therapy
Beilstein J. Nanotechnol. 2018, 9, 2960–2967, doi:10.3762/bjnano.9.275

- Dispersive X-ray (EDX) detector. The particle size distributions and zeta potentials in water were determined by dynamic light scattering (DLS) using a particle size analyser Zetasizer Nano ZS (Malvern, UK). Fluorescence spectra and absolute fluorescence quantum yields, ΦL, were measured using a Quantaurus


Layered calcium phenylphosphonate: a hybrid material for a new generation of nanofillers
Beilstein J. Nanotechnol. 2018, 9, 2906–2915, doi:10.3762/bjnano.9.269

- of 0.1% and frequency of 1 Hz. The heating rate was set to 3 °C/min. Pictures of the free films were obtained from an Olympus BX51 optical microscope equipped with a DP70 digital camera system in addition to a JEOL SEM JSM-55000 LV with an EDX detector (GRESHAM Sirius 10, JEOL, USA Inc.) with an


Near-infrared light harvesting of upconverting NaYF4:Yb3+/Er3+-based amorphous silicon solar cells investigated by an optical filter
Beilstein J. Nanotechnol. 2018, 9, 2788–2793, doi:10.3762/bjnano.9.260

- phase transition is completed after 12 h. In Figure 1c, energy-dispersive X-ray (EDX) analysis confirms the doping with Yb and Er. The molar ratio of Y/Yb/Er in the hexagonal phase NaYF4:Yb3+/Er3+ was determined to be 79.8:18.2:2. It is extremely close to the stoichiometric ratio of 80:18:2 of the most
- reflector. XRD analysis was carried out on a Bruker D8 Advance X-ray diffractometer with Cu Kα radiation, keeping the operating voltage and current at 40 kV and 40 mA, respectively. A 2θ range from 10 to 80° in steps of 6°/min was measured. FE-SEM images and EDX spectroscopy were recorded on Carl Zeiss
- -16-0334) and cubic β-NaYF4 (JCPDS-77-2042). (c) EDX patterns of NaYF4:Yb3+/Er3+ as a function of the reaction time of 12 h. (a) Photoluminescence spectra of NaYF4:Yb3+/Er3+ samples under 980 nm laser illumination with a power of 60 mW; (b) peak intensities at 522, 541, and 654 nm as a function of the


Enhanced antineoplastic/therapeutic efficacy using 5-fluorouracil-loaded calcium phosphate nanoparticles
Beilstein J. Nanotechnol. 2018, 9, 2499–2515, doi:10.3762/bjnano.9.233


High-temperature magnetism and microstructure of a semiconducting ferromagnetic (GaSb)1−x(MnSb)x alloy
Beilstein J. Nanotechnol. 2018, 9, 2457–2465, doi:10.3762/bjnano.9.230

- probe corrector), a high-angle annular dark field (HAADF) detector, an atmospheric thin-window energy dispersive X-ray (EDX) spectrometer (Phoenix System, EDAX, US) and a post-column Gatan energy filter (GIF), (Gatan, US). The S/TEM was operated at 300 kV. Digital micrograph (Gatan, US) and TIA software
- using S/TEM, AFM and MFM methods. In the present TEM/EDX microanalysis study of the GaSb–MnSb/α-Al2O3 system the actual investigation was performed on a cross-sectional piece of sample GM3 with lateral sizes of about 1 μm. The results are presented in Figure 4a and Figure 4b. The film thickness is about
- presented here). Energy-dispersive X-ray microanalysis (EDX) of the film composition near the interface edge and at a distance from it yielded the ratio Mn/Ga/Sb = 30:30:40 with 2% accuracy. A HRTEM image of studied film is presented in Figure 4b. Fast Fourier-transform (FFT) analysis of the high-resolution


Hydrothermal-derived carbon as a stabilizing matrix for improved cycling performance of silicon-based anodes for lithium-ion full cells
Beilstein J. Nanotechnol. 2018, 9, 2381–2395, doi:10.3762/bjnano.9.223

- . Energy-dispersive X-ray spectroscopy (EDX) measurements were used to investigate the elemental composition of the composite materials using an acceleration voltage of 20 kV. The EDX signal was detected by an X-Max 80 mm2 detector and evaluated with the INCA software, both from Oxford Instruments. Cross
- 90:10 sample. The SEM micrographs also show that nearly no Si-NPs are located outside of the matrix, indicating a successful embedding of Si into carbon. To further verify this assumption, the internal structure of the C:Si 80:20 sample was investigated with the help of FIB-SEM and EDX to obtain a
- similarities in shape and size to the Si particles (=white spots) in Figure 2a and 2b can be seen. The EDX mapping results in Figure 2e and 2f also supports the results from the FIB-SEM investigations that Si is homogeneously distributed within the carbon matrix. For comparison reasons, SEM micrographs of a


Magnetism and magnetoresistance of single Ni–Cu alloy nanowires
Beilstein J. Nanotechnol. 2018, 9, 2345–2355, doi:10.3762/bjnano.9.219

- magnifications for a typical individually contacted Ni–Cu alloy nanowire are displayed in Figure 1 and Figure S2, Supporting Information File 1. The composition of the Ti/Au electrodes (100/200 nm) and single Ni–Cu alloy nanowire was confirmed by using EDX analysis (Figure 1b and Figure S3, Supporting
- Information File 1). The compositions of the four types of nanowires, corresponding to the four different electrodeposition potentials, as more precisely obtained by the EDX analysis performed on bunches of nanowires, are 20, 54, 75 and 92 atom % of Ni. Also, the saturation magnetization of the corresponding
- properties of the nanowires were investigated by means of scanning electron microscopy and energy-dispersive X-ray spectroscopy using a Zeiss Evo 50 XVP scanning electron microscope (SEM) with an energy dispersive X-ray analysis (EDX) Quantax Bruker 200 as accessory. Magnetoresistance measurements were made


Hierarchical heterostructures of Bi2MoO6 microflowers decorated with Ag2CO3 nanoparticles for efficient visible-light-driven photocatalytic removal of toxic pollutants
Beilstein J. Nanotechnol. 2018, 9, 2297–2305, doi:10.3762/bjnano.9.214

- -4800 scanning electron microscope (SEM) and a JEM-2010F transmission electron microscope (TEM). The corresponding chemical compositions were detected by energy-dispersive X-ray (EDX) spectroscopy equipped on the SEM. The crystal structure of catalysts was identified by X-ray diffractometry (XRD, Bruker


Electrospun one-dimensional nanostructures: a new horizon for gas sensing materials
Beilstein J. Nanotechnol. 2018, 9, 2128–2170, doi:10.3762/bjnano.9.202


Synthesis of a MnO2/Fe3O4/diatomite nanocomposite as an efficient heterogeneous Fenton-like catalyst for methylene blue degradation
Beilstein J. Nanotechnol. 2018, 9, 1940–1950, doi:10.3762/bjnano.9.185

- energy-dispersive X-ray (EDX) spectrum and elemental mappings for O, Si, Fe and Mn elements, respectively. It can be found that all the elements are evenly distributed on the diatomite, and the calculated atomic fractions of Fe and Mn are 3.63% and 10.96%, respectively. All these results confirm the
- organic pollutants. XRD patterns of the purified diatomite and the prepared diatomite-supported composites. FTIR spectra of the purified diatomite and prepared diatomite-supported composites. The SEM images of diatomite (a), Fe3O4/diatomite (b, d), MnO2/Fe3O4/diatomite (c and e), EDX spectrum (f) and


A differential Hall effect measurement method with sub-nanometre resolution for active dopant concentration profiling in ultrathin doped Si1−xGex and Si layers
Beilstein J. Nanotechnol. 2018, 9, 1926–1939, doi:10.3762/bjnano.9.184

- the top Si/BOX interfaces in correspondence of the maximum slope of the oxygen signal. The position of the SiO2/Si interfaces determined in this way (1.2 nm and 1.6 nm below the surface for the DSA- and RTA-annealed wafers, respectively) are in perfect agreement with those found by STEM-EDX


Synthesis of carbon nanowalls from a single-source metal-organic precursor
Beilstein J. Nanotechnol. 2018, 9, 1895–1905, doi:10.3762/bjnano.9.181

- found nanocrystalline Al3C4 clusters by TEM measurements in our CNWs that were measured to be of 30 nm in size [23]. In addition to the AES measurements, EDX measurements were carried out on the CNWs to identify additional trace elements in the carbon structures (Figure 11). Besides the already measured
- diffusion into account [18]. The surface diffusion depends on the particle energies and the substrate material. In addition, defects in the grown structures are discussed as additional nucleation sites at higher particle energies resulting in the highest density of CNWs on our substrates. AES and EDX
- triangles: data points taken from [34]. Heights of CNWs as a function of process parameters and substrate material. a) SEM image of the curled CNWs and corresponding b) carbon and c) aluminium mappings, as measured by Auger electron spectroscopy. EDX spectrum of CNWs on stainless steel (Fe, Cr). Besides


Synthesis of rare-earth metal and rare-earth metal-fluoride nanoparticles in ionic liquids and propylene carbonate
Beilstein J. Nanotechnol. 2018, 9, 1881–1894, doi:10.3762/bjnano.9.180

- diameters of (1.5 ± 0.5) to (5 ± 1) nm. The characterization was completed by energy-dispersive X-ray spectroscopy (EDX). Keywords: ionic liquids; metal amidinates; rare-earth metal-fluoride nanoparticles; rare-earth metal nanoparticles; soft wet-chemical synthesis; Introduction Rare-earth (RE) elements
- -NPs (Figure 2) were assigned by selected area electron diffraction (SAED). The characterization was completed by energy-dispersive X-ray spectroscopy (EDX, in combination with TEM) for the qualitative element composition. EDX spectroscopy (Figure 3 and Figures S5b, S6c, Supporting Information File 1
- crystallinity of the RE-NPs was confirmed by SAED and gave the expected reflections for elemental Gd and Er (Figure 7 and Figure S7b, Supporting Information File 1). Due to the very small size of the Gd and Er particles a meaningful PXRD pattern could not be obtained. Characterization by EDX (Figure 7 and


SO2 gas adsorption on carbon nanomaterials: a comparative study
Beilstein J. Nanotechnol. 2018, 9, 1782–1792, doi:10.3762/bjnano.9.169

- present as characterized by TG, TEM, XPS and EDX (the remaining material being carbon materials such as fullerene fragments and graphite particles). SWNTs and MWNTs were obtained from NanoLab, Inc. MA, USA. According to the manufacturer, MWNTs have a purity of >95%, with an outer diameter of 15 ± 5 nm


