Search results
Search for "Raman" in Full Text gives 436 result(s) in Beilstein Journal of Nanotechnology. Showing first 200.
Optical near-field mapping of plasmonic nanostructures prepared by nanosphere lithography
Beilstein J. Nanotechnol. 2018, 9, 1536–1543, doi:10.3762/bjnano.9.144

- analysis with the high spatial resolution of scanning probe microscopy [3][4][5]. This method has been applied to various fields of research such as plasmonic analysis [6][7], Raman spectroscopy (tip-enhanced Raman spectroscopy, TERS) [8][9], or infrared analysis [10]. In this microscopy technique, a laser
- [23]. The resulting local melting reveals the hot spots, but at the cost of the sample destruction. Other methods use surface enhanced Raman spectroscopy (SERS) [28][29]. In these cases, a Raman active molecule is deposited on the surface of the sample. Its Raman signal is only visible on the hot
- Nanofinder 30 Raman spectrometer and a thermoelectrically cooled CCD detector. A TEM00 cw He–Ne laser (632.8 nm) and a cw solid-state Cobolt 04-01 series laser (532.1 nm) were used as the excitation sources. A 0.7 N.A. Mitutoyo MPlan Apo 100× objective placed under a 65° inclination was used to focus the


Cr(VI) remediation from aqueous environment through modified-TiO2-mediated photocatalytic reduction
Beilstein J. Nanotechnol. 2018, 9, 1448–1470, doi:10.3762/bjnano.9.137


Formation and development of nanometer-sized cybotactic clusters in bent-core nematic liquid crystalline compounds
Beilstein J. Nanotechnol. 2018, 9, 1288–1296, doi:10.3762/bjnano.9.121

- (POM) [25], Raman scattering [26][27], XRD [28][29], photon correlation spectroscopy (PCS) [27][30][31] and NMR [32][33]. Recently Kim et al. [29] carried out X-ray experiments on a bent-core system in its nematic phase. They aligned the long molecular axes by applying a strong magnetic field parallel


Formation mechanisms of boron oxide films fabricated by large-area electron beam-induced deposition of trimethyl borate
Beilstein J. Nanotechnol. 2018, 9, 1282–1287, doi:10.3762/bjnano.9.120

- . LCSM images of all deposits are presented in Supporting Information File 1. Material deposited at 26 °C does not display any signs of cracking (Figure 2b,c), but is susceptible to laser-induced heating damage (see Raman spectroscopy discussion in Supporting Information File 1). The decrease in


Surface characterization of nanoparticles using near-field light scattering
Beilstein J. Nanotechnol. 2018, 9, 1228–1238, doi:10.3762/bjnano.9.114

- force microscopy combined with surface enhanced Raman spectroscopy (SERS) to enable trapping and chemical characterization of individual metallic nanoparticles [38]. Although not done in the present study, a combined approach using our methods and those of Kong et al. may be a powerful tool for dynamic


A novel copper precursor for electron beam induced deposition
Beilstein J. Nanotechnol. 2018, 9, 1220–1227, doi:10.3762/bjnano.9.113

- pure copper nanocrystals with sizes of up to around 15 nm were dispersed inside the carbonaceous matrix. Raman investigations revealed a high degree of amorphization of the carbonaceous matrix and showed hints for partial copper oxidation taking place selectively on the surfaces of the deposits
- precursor shows the first evidence for conductivity of the deposits without post-treatment in case of copper [2][10]. For a better understanding of the material configuration and change during deposition, Raman spectroscopy measurements were performed on the precursor before deposition as well as on the
- FEBID pads. The Raman spectrum in Figure 2a of the precursor shows a complex structure with a number of distinct peaks. Under the impact of the electron beam the spectrum changes to a broad Raman response (black curve in Figure 2a) that is typical for amorphous materials. The different features of the


Electrodeposition of reduced graphene oxide with chitosan based on the coordination deposition method
Beilstein J. Nanotechnol. 2018, 9, 1200–1210, doi:10.3762/bjnano.9.111

- intensity ratio of the D to G-band can be employed to evaluate the structure disorder of carbon materials [30][31]. Thus, the Raman spectroscopy analysis of HACC-rGO suggests that there exist some structural defects in HACC-rGO. Particularly, the resulting HACC-rGO disperses well in aqueous solutions, and
- the HACC-rGO material was observed using a field emission scanning electron microscope (JSM-5610LV, JEOL Ltd., Japan). The Raman spectrum of the HACC-rGO sample was measured using a Raman spectrometer (INVIA, Renishaw, UK) with an excitation wavelength of 633 nm. The surface and the cross-section
- heating rate of 10 °C/min under nitrogen atmosphere. (a) Schematic of the preparation approach of HACC-rGO. (b) SEM image of the resulting HACC-rGO. (c) Raman spectrum of the HACC-rGO sample. (d) Photograph of the mixed solution of HACC-rGO and chitosan. (e) Photograph of the mixed solution of unmodified


Electrostatic force spectroscopy revealing the degree of reduction of individual graphene oxide sheets
Beilstein J. Nanotechnol. 2018, 9, 1146–1155, doi:10.3762/bjnano.9.106

- methods, such as X-ray photoelectron spectroscopy (XPS) [8][9], Raman spectroscopy [10], and UV–vis absorption spectra [11][12], reflect the average information of rGO materials. However, they cannot characterize an isolated rGO sheet at the nanoscale. Optical observation [13] and transmission electron


Electro-optical interfacial effects on a graphene/π-conjugated organic semiconductor hybrid system
Beilstein J. Nanotechnol. 2018, 9, 963–974, doi:10.3762/bjnano.9.90

- probe microscopy, optical spectroscopy (photoluminescence and Raman) and ab initio calculations. The graphene/RA interaction induces the formation of a well-organized π-conjugated self-assembled monolayer (SAM) at the interface. Such structural organization leads to the high optical emission efficiency
- of the RA SAM, even at room temperature. Additionally, photo-assisted electrical force microscopy, photo-assisted scanning Kelvin probe microscopy and Raman spectroscopy indicate a RA-induced graphene doping and photo-charge generation. Finally, the optical excitation of the RA monolayer generates
- interfacial effects. Scanning probe microscopy (SPM) and Raman scattering experiments, along with first-principles calculations, reveal the presence of a highly ordered RA self-assembled monolayer atop graphene and graphite. The electro-optical characterization of the hybrid system discloses interfacial


Comparative study of sculptured metallic thin films deposited by oblique angle deposition at different temperatures
Beilstein J. Nanotechnol. 2018, 9, 954–962, doi:10.3762/bjnano.9.89

- , such thin films are the basis for surface enhanced Raman sensors, which are highly sensitive in the detection of environmental toxics [2] or glycated hemoglobin [3]. It has also been shown that highly porous metallic thin films can be used to improve the electrode’s performance for applications in fuel


Cyclodextrin inhibits zinc corrosion by destabilizing point defect formation in the oxide layer
Beilstein J. Nanotechnol. 2018, 9, 936–944, doi:10.3762/bjnano.9.86
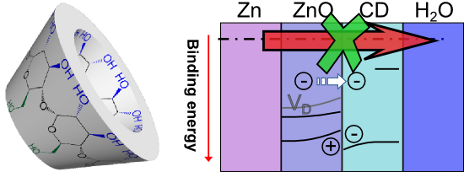
- , with Raman spectra of the interface proving the adsorption of the intact β-CD. Angular dependent X-ray photoelectron spectroscopy (ADXPS) and ultraviolet photoelectron spectroscopy (UPS) were used to extract a band-like diagram of the β-CD/ZnO interface, showing a large energy level shift at the
- ). On the other hand, ex situ Raman spectra (Supporting Information File 1, Figure S5) recorded after exposure do show the presence of β-CD on the surface, by the presence of several of the characteristic vibrational modes in the spectrum. The dissolution product Zn2+ is a reactant in follow-up chemical
- detected with a hemispherical electron energy analyzer (SPECS PHOIBOS 150) with TOA = 50°. This configuration gives an information depth of ≈1.5 nm [43]. Raman spectroscopy was performed on samples prepared in the same manner as for SEM. Spectra were recorded using a Witec alpha300M confocal Raman


Facile chemical routes to mesoporous silver substrates for SERS analysis
Beilstein J. Nanotechnol. 2018, 9, 880–889, doi:10.3762/bjnano.9.82

- , Ruhr-University at Bochum, Universitätsstraße 150, Bochum, 44801, Germany 10.3762/bjnano.9.82 Abstract Mesoporous silver nanoparticles were easily synthesized through the bulk reduction of crystalline silver(I) oxide and used for the preparation of highly porous surface-enhanced Raman scattering (SERS
- and Raman signal enhancement mediators. The efficiency of silver reduction was characterized by X-ray diffraction and X-ray photoelectron spectroscopy. The developed substrates were applied for SERS detection of rhodamine 6G (enhancement factor of about 1–5 × 10⁵) and an anti-ischemic mildronate drug
- (meldonium; enhancement factor of ≈102) that is known for its ability to increase the endurance performance of athletes. Keywords: meldonium; mesoporous silver substrates; silver oxide; surface-enhanced Raman spectroscopy; Introduction Nowadays one of the largest sectors of the global chemical industry is


Towards the third dimension in direct electron beam writing of silver
Beilstein J. Nanotechnol. 2018, 9, 842–849, doi:10.3762/bjnano.9.78

- pronounced dependency of the deposit height on the dwell time. Truly three-dimensional silver structures could be realized with silver pentafluoropropionate. The pillars were polycrystalline with silver contents of more than 50 atom % and exhibit strong Raman enhancement. This constitutes a promising route
- software Gwyddion 2.49. Confocal Raman spectroscopy was performed using an upright ND-MDT NTEGRA Raman microscope featuring a laser source with a wavelength of 532 nm and a 100× objective lens with a numerical aperture of 0.95. Spectra were recorded at a spectral resolution of 2.7 cm−1 with 5 s exposure
- that the forward scattered electrons add to the carbon and oxygen signal, a conservative estimate gives 50 atom % of silver. This lower limit for the silver content for the pillars is contrasted by their polycrystalline nature, their Raman activity in Figure 3e, and the higher silver content measured


Graphene composites with dental and biomedical applicability
Beilstein J. Nanotechnol. 2018, 9, 801–808, doi:10.3762/bjnano.9.73

- 08.10.2012). The shape and position of the Raman 2D band (≈2700 cm−1) provides a useful analysis for assessing the quality and number of layers in graphene materials [14][15]. As the FLG material is composed of “flakes” the edges of the flakes give rise to a D band. The shape and position of the 2D band in
- to C=O [16]. Therefore, it is reasonable to assume that the loss of carbon and oxygen from the MLG material compared to the FLG material can be attributed to the formation of CO and CO2 during the heat-treatment. This is in accord with the Raman data which shows a clear “finger-print” for graphene
- than A (Figure 3a,b). The Raman spectra of both FLG-dental polymers show a 2D band (≈2700 cm−1) which is indicative of FLG [14][15] although in the higher graphene loaded polymer this band is more pronounced. The fracture sections of both polymers were conducting enough to need no coating to be


Heavy-metal detectors based on modified ferrite nanoparticles
Beilstein J. Nanotechnol. 2018, 9, 762–770, doi:10.3762/bjnano.9.69

- [15]. Therefore, the origin of these signals is most probable due to heavy ion adsorption. However, due to a lack of reference information, it is the only speculation on the origin of appearing new signals. Raman spectroscopy After every step (synthesis, surface modification, and heavy metal
- attachment) powdered samples of nanoparticles were analyzed using Raman spectroscopy giving additional information to IR spectroscopy. In Figure 5 selected spectra are presented. The Raman spectra show a set of peaks that are typical for inorganic cores (magnetite, maghemite/hematite) with accordingly
- adsorption was reported previously [15]. Figure 5C shows the modulation of Raman spectra by different compounds at the surface. A number of additional bands seen in case of PA are due to its specific chemical structure (Table 3). Considering all above-mentioned findings, Raman spectroscopy confirms the


A review of carbon-based and non-carbon-based catalyst supports for the selective catalytic reduction of nitric oxide
Beilstein J. Nanotechnol. 2018, 9, 740–761, doi:10.3762/bjnano.9.68

The effect of atmospheric doping on pressure-dependent Raman scattering in supported graphene
Beilstein J. Nanotechnol. 2018, 9, 704–710, doi:10.3762/bjnano.9.65

- .9.65 Abstract Atmospheric doping of supported graphene was investigated by Raman scattering under different pressures. Various Raman spectra parameters were found to depend on the pressure and the substrate material. The results are interpreted in terms of atmospheric adsorption leading to a change in
- . Keywords: adsorption; doping; graphene; pressure; Raman spectroscopy; substrate; Introduction Graphene is a promising material for a variety of applications due to its unique physical properties [1]. Among its other outstanding features, one can distinguish its strong sensitivity to adsorbates, leading to
- adsorption properties of supported graphene. Raman spectroscopy is a versatile tool for studying graphene and graphene-based nanomaterials [9][10][11][12]. Several different parameters of graphene’s Raman spectra are affected by charge carrier density variations, such as the G and 2D peak positions and the


Anchoring Fe3O4 nanoparticles in a reduced graphene oxide aerogel matrix via polydopamine coating
Beilstein J. Nanotechnol. 2018, 9, 591–601, doi:10.3762/bjnano.9.55

- nanoparticles are present in agglomerated form. The vibrational properties of the prepared aerogel samples were analyzed by Raman spectroscopy. The typical rGO spectrum is featured by the presence of four main vibrational modes, namely: D, G, 2D and D+G (D+D’) [43]. In graphite-like materials, the G mode is
- the synthesized GO powder and the rGO aerogel, estimated from Raman spectra (data not shown) were 0.9 and 1.05, respectively. The ID/IG ratio increase is related to removal of oxygen functional groups and the decrease of the average size of the sp2 domains upon hydrothermal reduction [44][45][46][47
- ]. Figure 3 presents spectra of rGO, rGO-Fe3O4 and rGO-PDA@Fe3O4 aerogel samples obtained at different wavelengths: λ = 488 nm (EL = 2.54 eV), λ = 514 nm (EL = 2.41 eV), λ = 633 nm (EL = 1.96 eV) and λ = 785 nm (EL = 1.58 eV). In this figure one can notice typical rGO Raman vibrational response with


Single-step process to improve the mechanical properties of carbon nanotube yarn
Beilstein J. Nanotechnol. 2018, 9, 545–554, doi:10.3762/bjnano.9.52

- by X-ray photoelectron spectroscopy (XPS), Raman spectroscopy and scanning electron microscopy (SEM). The best improvement in mechanical properties was achieved on a sample treated with an aqueous solution of AA and subsequent irradiation. CNT yarn treatment with AA enhanced the strength (444.5
- device, which uses both low energy Ar ions and low-energy electrons. Data were collected and analyzed using the Advantage data system (v.4.61). XPS survey spectra were collected from 0 to 1350 eV. Raman analyses were carried out in a Horiba Jobin-Yvon T64000 Raman spectrometer equipped with a Peltier
- composed of angled graphite sheets. In addition, VGCFs are different from CNTs in the method of production and they have few functional groups at the edges [35]. CNT yarns functionalized with AN and AA irradiated at 108 kGy Raman spectroscopy is a useful method to investigate the covalent sidewall


Green synthesis of fluorescent carbon dots from spices for in vitro imaging and tumour cell growth inhibition
Beilstein J. Nanotechnol. 2018, 9, 530–544, doi:10.3762/bjnano.9.51

- characterized by means of UV–vis, fluorescence, Fourier transform infrared and Raman spectroscopy, dynamic light scattering and transmission electron microscopy. The optical performance showed an outstanding ability for imaging purposes, with quantum yields up to 43.6%. Thus, the cytotoxicity of the above
- compounds present in the spices will partially remain inside or at the surface of the C-dots after the hydrothermal process, leading to different photoluminescent and biomedical properties. The synthesized C-dots have been extensively characterized with UV–vis, fluorescence, FTIR and Raman spectroscopy, DLS
- literature and it has been reported that they are biocompatible. TEM, DLS, XRD, FTIR and Raman spectra of C-dots TEM images showed that the obtained C-dots are spherical regardless of the starting material. As it can be observed in Figure 3, C-dots are uniform in size and shape. A TEM histogram was plotted


Ultralight super-hydrophobic carbon aerogels based on cellulose nanofibers/poly(vinyl alcohol)/graphene oxide (CNFs/PVA/GO) for highly effective oil–water separation
Beilstein J. Nanotechnol. 2018, 9, 508–519, doi:10.3762/bjnano.9.49

- the carbonization treatment was complete, which is in good agreement with the FTIR and Raman data. Chemical properties The FTIR spectrum of the CNFs, PVA, GO, rGO, CNF/PVA/GO and CNF/PVA/GO carbon aerogels are shown in Figure 3. The CNFs exhibit FTIR absorption bands around 3323 cm−1 (the stretching
- previous studies [19][29], which is in agreement with the SEM results. FTIR can only be used to detect signals from molecules with infrared activity. Therefore, Raman spectroscopy analysis was studied to detect the stretching vibration characteristic peak of homonuclear diatomic pairs. The Raman spectrum
- . In previous work, a similar Raman spectrum was observed for cotton cellulose [30]. Figure 4b shows the Raman spectrum of PVA films. The strong band at 2911 cm−1 is due to symmetric and asymmetric CH2 stretching vibrations. The Raman spectra of GO and rGO are presented in Figure 4c and Figure 4d


Engineering of oriented carbon nanotubes in composite materials
Beilstein J. Nanotechnol. 2018, 9, 415–435, doi:10.3762/bjnano.9.41

- ]) effects on the application and quality of composites. For this aim, many techniques have been developed such as Raman spectroscopy, Fourier-transforms infrared spectroscopy (FTIR) and X-ray photoelectron spectroscopy (XPS). Raman spectroscopy: Raman spectroscopy is a powerful tool to identify and quantify
- samples. This method gives significant information about molecular vibrations. The technique involves the excitation of a sample with a monochromatic light source (i.e., laser) and collecting the scattered light. The Raman spectra of CNTs can be identified with the radial breathing mode (RBM), tangential
- mode (G-band), disorder-induced mode (D-band), and other Raman features, determining the physical properties of the material. The G-band intensity as a function of the angle of polarization for individual CNTs can be related to their arrangement so that the G-band intensity of well-aligned CNT bulk


Blister formation during graphite surface oxidation by Hummers’ method
Beilstein J. Nanotechnol. 2018, 9, 407–414, doi:10.3762/bjnano.9.40

- Hummers’ method and investigated by Raman spectroscopy and atomic force microscopy. HAPG was used as a graphite precursor because its surface after cleavage contains well-ordered millimeter-sized regions. The treatment resulted in graphite intercalation by sulfuric acid and blister formation all over the
- and hydrogen peroxide solution, the surface became gray and matte, which indicated a significant change in the surface roughness. Raman spectroscopy of the HAPG surface before and after the treatment Raman spectra, recorded from the ordered regions on the HAPG surface before and after the treatment
- , are shown in Figure 1. The absence of the D-peak around ≈1350 cm−1 indicates a low content of defects in the carbon layers. Thus, the Raman spectra do not confirm the partial oxidation of the carbon layers and the formation of GO in the ordered regions. It is likely that long-term oxidation is


Sugarcane juice derived carbon dot–graphitic carbon nitride composites for bisphenol A degradation under sunlight irradiation
Beilstein J. Nanotechnol. 2018, 9, 353–363, doi:10.3762/bjnano.9.35

- micro-PL spectroscope (Renishaw, inVia Raman Microscope) was used to acquire the PL spectra with an excitation wavelength of 325 nm. UV–vis DRS was obtained using a Shimadzu UV-2600 spectrophotometer equipped with an integrating sphere attachment with barium sulfate (BaSO4) as a reference. The surface


Synthesis and characterization of electrospun molybdenum dioxide–carbon nanofibers as sulfur matrix additives for rechargeable lithium–sulfur battery applications
Beilstein J. Nanotechnol. 2018, 9, 262–270, doi:10.3762/bjnano.9.28

- using an electrospinning technique followed by calcination, using sol–gel precursors and polyacrylonitrile (PAN) as a processing aid. The resulting samples were characterized by X-ray diffraction (XRD), Fourier transform infrared spectroscopy (FTIR), Raman spectroscopy, Brunauer–Emmet–Teller (BET
- known to be active in numerous reactions associated with noble metals, such as CO2 hydrogenation, water gas shift, alcohol synthesis and hydrazine decomposition. Here, CH4/H2 atmosphere was not used during calcination, which was much safer and facile when compared to other methods [27]. Raman
- spectroscopy is a very useful tool for the characterization of carbon-based nanostructures. The Raman spectra of the products excited with a 532 nm laser line are shown in Figure 1b. Two characteristic peaks at around 1355 and 1580 cm−1 correspond to disordered carbon (D-band) and graphite carbon (G-band


