

Search results
Search for "AFM" in Full Text gives 739 result(s) in Beilstein Journal of Nanotechnology. Showing first 200.
Reconstruction of a 2D layer of KBr on Ir(111) and electromechanical alteration by graphene
Beilstein J. Nanotechnol. 2021, 12, 432–439, doi:10.3762/bjnano.12.35
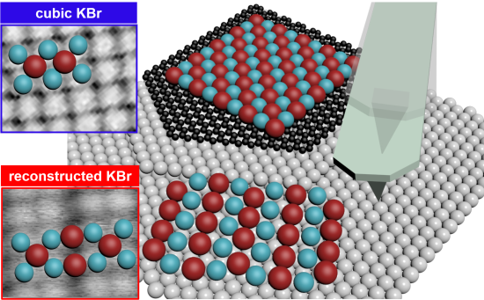
- reduced by the decoupling effect of graphene, thus yielding different electrical and mechanical properties of the top KBr layer. Keywords: DFT; graphene; Ir(111); KBr; KPFM; nc-AFM; surface reconstruction; Introduction Many two-dimensional (2D) materials have excellent optical, mechanical
- with unconventional stoichiometries have been observed indirectly on graphene surfaces [37]. Here, we report on the formation of irregularly shaped KBr islands with corrugated stripe structures, observed on the (111) surface of Ir and analyzed by non-contact atomic force microscopy (nc-AFM) at room
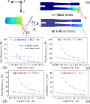
- the iridium terraces. Figure 1a shows a large-scale topography image of a KBr island on Ir(111) measured by nc-AFM at room temperature. The monoatomic steps between the Ir terraces have a height of 235 pm as expected for Ir(111). The KBr islands are monolayers with an average height of 340 pm under


Exploring the fabrication and transfer mechanism of metallic nanostructures on carbon nanomembranes via focused electron beam induced processing
Beilstein J. Nanotechnol. 2021, 12, 319–329, doi:10.3762/bjnano.12.26
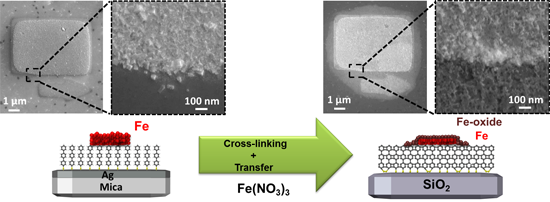
- transfer process, AFM measurements were done before and after the transfer. In Figure 5a and Figure 5b, SEM and AFM images, respectively, of five different iron structures are depicted. One larger structure, which acts as a marker structure (the same one as in Figure 4a), and four 2 × 2 µm2 squares can be
- seen. The structures are distributed over an area of 50 × 40 µm2.The marker structure (7 × 5 µm2) is the largest transferred iron structure. In Figure 5c and Figure 5d SEM and AFM images, respectively, of the same five structures after the transfer onto a bulk SiO2 substrate are depicted. The large
- AFM experiments were performed with a JPK NanoWizard 4 by using non-contact mode. Cross-linking of SAMs into CNMs was achieved by using electron flood guns employing 100 eV electrons and an electron dose of 60 mC/cm2. Before starting the transfer process, the cross-linked CNMs were spin coated with a


Gold(I) N-heterocyclic carbene precursors for focused electron beam-induced deposition
Beilstein J. Nanotechnol. 2021, 12, 257–269, doi:10.3762/bjnano.12.21
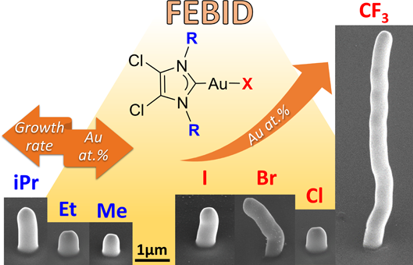
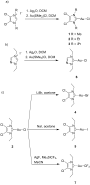
- and some volatile fragments. The technique has been employed in applications such as the fabrication of nanoconnectors [5], extreme ultra-violet lithography (EUVL) mask repair [6], AFM probe tips [7][8][9], nanodevices for plasmonics [10], gas sensors [11][12], optoelectronics [13], and magnetic [14





The nanomorphology of cell surfaces of adhered osteoblasts
Beilstein J. Nanotechnol. 2021, 12, 242–256, doi:10.3762/bjnano.12.20
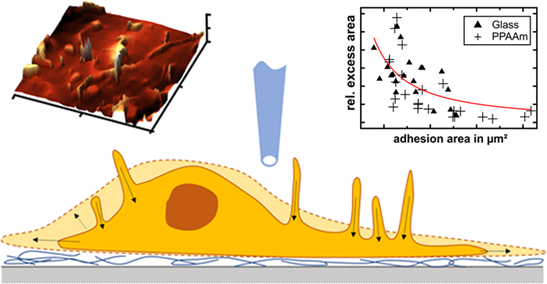
- signal is a force, pressure is applied to the sample. This is the case when using atomic force microscopy (AFM), giving rise to substantially depressed apparent heights on living and fixed cells [17]. Typically, mammalian cells exhibit Young's moduli in the range of 1 to 10 kPa while AFM probe pressures
- may correspond to ca. 10 MPa, assuming 1 nN loading force and 5 nm tip radius. Though the resulting artificial depression depths on the cellular membranes are about half a micrometer already at 1 nN, AFM is useful to measure the cortical actin network underneath the membrane [18]. Regarding the
- room temperature. Measurement principle and data preparation Scanning electron microscopy (SEM) was performed using a field-emission SEM (Gemini Supra 25, Zeiss) at 1 keV electron energy without Au coating. For SICM a commercial AFM/SICM setup (NX-bio, Park Systems, Korea) with a live-cell chamber (5


Mapping the local dielectric constant of a biological nanostructured system
Beilstein J. Nanotechnol. 2021, 12, 139–150, doi:10.3762/bjnano.12.11
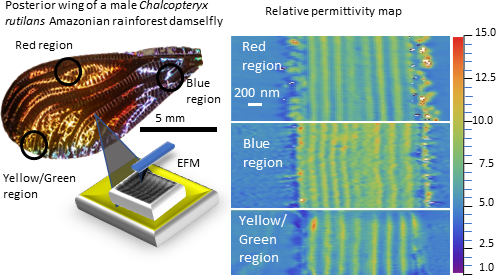
- sample and the conductive substrate need to be present within the AFM image. This is a key condition since the conductive substrate establishes a reference level in the analysis. Having both in the imaged region guarantees that the cantilever amplitude and, consequently, the effective radius of the tip
- will be the same for different materials, which is critical for the applied capacitance model [29]. Also, having the conductive surface and the sample in the same AFM image guarantees the precision in the determination of the thickness of the sample. Wing sample preparation for SEM In order to study
- h is directly determined via AFM imaging. The microscope control software also determines the resonance frequency f0 and the elastic constant K of the cantilever using the thermal tune method [30][31]. A critical parameter is the tip–sample distance z, that consists of the height Hlift plus the




Correction: Extracting viscoelastic material parameters using an atomic force microscope and static force spectroscopy
Beilstein J. Nanotechnol. 2021, 12, 137–138, doi:10.3762/bjnano.12.10
- microscopy (AFM); creep; force mapping; indentation; Kelvin–Voigt; static force spectroscopy (SFS); viscoelasticity; In the “Useful Viscoelastic Quantities” section of the original publication, it is stated that the storage modulus (E′) and storage compliance (J′) are inverses of one another (Equation 10
Fusion of purple membranes triggered by immobilization on carbon nanomembranes
Beilstein J. Nanotechnol. 2021, 12, 93–101, doi:10.3762/bjnano.12.8
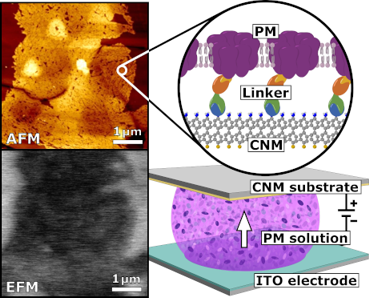
- histidine-tag at the extracellular side of a PM mutant (c-His PM). The functionalization and the resulting hybrid membrane were examined by atomic force microscopy (AFM), scanning electron microscopy (SEM), X-ray photoelectron spectroscopy (XPS), confocal laser scanning microscopy (CLSM), and infrared
- Sphera electron analyzer with a resolution of 0.9 eV and an emission angle of 20°. AFM measurements were performed with a Bruker NanoScope® V system (Bruker Corporation, Billerica, MA, USA) in PeakForce mode using a PicoForce scanner for 50 × 50 µm2 topographical pictures. A Multimode 8 10364EVLR scanner
- samples were subsequently washed with 200 µL distilled water and dried in a nitrogen flow. For each sample the topography of a 50 × 50 µm2 area was investigated by AFM to evaluate substrate coverage. It has been shown that the WT PM patches do not form a continuous monolayer, but rather separately


Numerical analysis of vibration modes of a qPlus sensor with a long tip
Beilstein J. Nanotechnol. 2021, 12, 82–92, doi:10.3762/bjnano.12.7
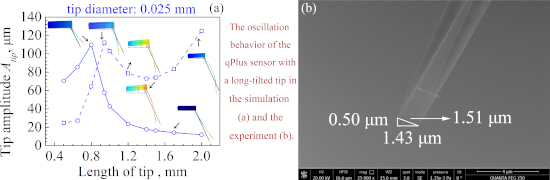
- and fq in the in-phase mode (Figure 3 and Figure 6). We found a 0.05 mm tip has the best performance when the tip length is 0.65 mm in the anti-phase mode. However, Ax/Az in the anti-phase mode is 2.36, that is, φ is 23°. In frequency modulation-atomic force microscopy (FM-AFM), the frequency shift Δf
- than that of any tip with another diameter. Thus, 0.1 mm would be the best choice for the tip diameter. The last crucial factor to be considered is the Q factor. Lower Q factors will result in lower stability for both FM-AFM and amplitude modulation AFM (AM-AFM) [17]. As shown in Figure 9, the Q factor






Bulk chemical composition contrast from attractive forces in AFM force spectroscopy
Beilstein J. Nanotechnol. 2021, 12, 58–71, doi:10.3762/bjnano.12.5
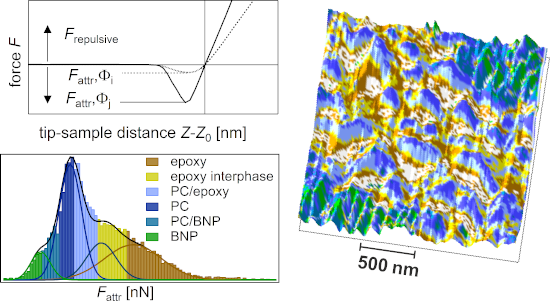
- of atomic force microscopy (AFM) is the measurement of physical properties at sub-micrometer resolution. Methods such as force–distance curves (FDCs) or dynamic variants (such as intermodulation AFM (ImAFM)) are able to measure mechanical properties (such as the local stiffness, kr) of nanoscopic
- heterogeneous materials. For a complete structure–property correlation, these mechanical measurements are considered to lack the ability to identify the chemical structure of the materials. In this study, the measured attractive force, Fattr, acting between the AFM tip and the sample is shown to be an
- material phases based on AFM topography. Additional chemical characterization on the nanoscale is performed by an AFM/infrared-spectroscopy hybrid method. Mechanical properties (kr) and attractive forces (Fattr) are calculated and a structure–property correlation is obtained by a manual principle component


Atomic layer deposited films of Al2O3 on fluorine-doped tin oxide electrodes: stability and barrier properties
Beilstein J. Nanotechnol. 2021, 12, 24–34, doi:10.3762/bjnano.12.2
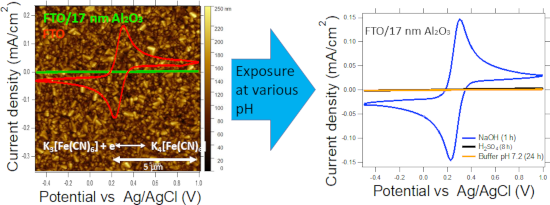
- 7.2). Chronoamperometric measurements were performed in buffered solution (pH 7.2) at −1.2 V (vs Ag/AgCl). The morphology of the films was characterized ex situ, under ambient conditions, by atomic force microscopy (AFM, Dimension Icon, Bruker, USA) in a semicontact (tapping) mode. A silicon
- cantilever (TESPA-V2) with a resonant frequency fres of approx. 300 kHz, a spring constant k of 0.42 N·m−1, and a nominal tip radius of 8 nm (Bruker, USA) was employed. The Gwyddion software (v. 2.53) was utilized for processing AFM image data. Results and Discussion AFM was used to compare the morphology of
- deposited Al2O3. The height-density distribution (Figure S2, Supporting Information File 1), calculated from the AFM topography images (Figure 1), shows that the deposition of Al2O3 onto FTO substrates does not change its surface morphology. Calculated RMS (root mean square) values for AFM images of FTO and


Nanomechanics of few-layer materials: do individual layers slide upon folding?
Beilstein J. Nanotechnol. 2020, 11, 1801–1808, doi:10.3762/bjnano.11.162
- methods; atomic force microscopy (AFM); molecular dynamics (MD); Raman spectroscopy; nanostructured materials; Introduction Layered materials such as graphite, talc, and transition metal dichalcogenides (TMDs), held together by strong covalent bonds within layers and relatively weak van der Waals
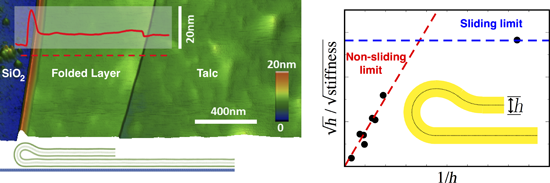
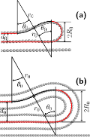
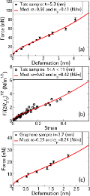
- material where it folds over itself during the exfoliation process. Our method is based on AFM measurements of the geometry and mechanical response of folded edges, and on the fitting of the experimental data by an analytical continuum model parameterized solely by α, κ, and the total thickness d of the
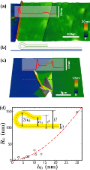
- deposited on a substrate exhibits a cross-section geometry similar to that indicated in Figure 1 (see, for instance, Wang et al. [12] for electron microscopy images). Figure 1a shows an AFM image of a talc flake (green shades) with a thickness of approximately 2.4 nm (corresponding to two layers), which was

![[Graphic 5]](/bjnano/content/inline/2190-4286-11-162-i8.svg?max-width=637&scale=1.18182) =
= ![[Graphic 6]](/bjnano/content/inline/2190-4286-11-162-i9.svg?max-width=637&scale=1.18182) as a function of 1/h for the nine measured talc samples. h is a directly measured ...
as a function of 1/h for the nine measured talc samples. h is a directly measured ...
Mapping of integrated PIN diodes with a 3D architecture by scanning microwave impedance microscopy and dynamic spectroscopy
Beilstein J. Nanotechnol. 2020, 11, 1764–1775, doi:10.3762/bjnano.11.159
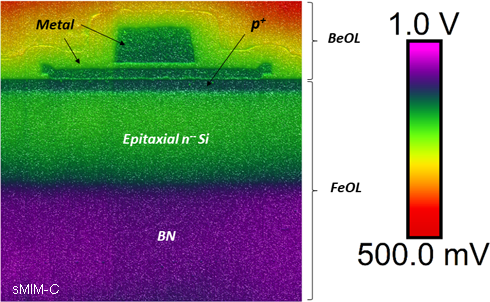
- complete parametric investigation, is performed with a dynamic spectroscopy method. The results emphasize the strong impact, in terms of distinction and location, of the applied bias on the local sMIM measurements for both FEOL and BEOL layers. Keywords: atomic force microscopy (AFM); DataCube; doping
- crucial to optimize and increase the device integration. In order to map the electrical properties of microelectronic materials with a high spatial resolution, scanning probe microscopy (SPM), based on atomic force microscopy (AFM), offers several modes based on the control of electrical conduction and on
- and with the spatial resolution of AFM [17][19]. However, there are limits to the SCM and SSRM techniques. For example, for SCM, when the local carrier concentration is extremely low, the SCM signal may be undetectable and close to zero. For SSRM, a very good control of the applied force is necessary


Direct observation of the Si(110)-(16×2) surface reconstruction by atomic force microscopy
Beilstein J. Nanotechnol. 2020, 11, 1750–1756, doi:10.3762/bjnano.11.157
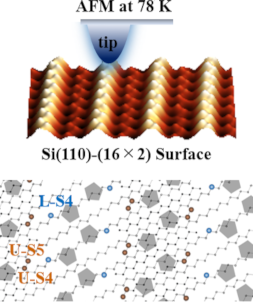
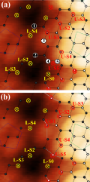
- , Himeji, Hyogo 671-2280, Japan Institute for Nanoscience Design, Osaka University, 1-2 Machikaneyama, Toyonaka, Osaka 560-0043, Japan 10.3762/bjnano.11.157 Abstract The atomic arrangement of the Si(110)-(16×2) reconstruction was directly observed using noncontact atomic force microscopy (NC-AFM) at 78 K
- between upper and lower terraces, which have not been reported using STM. These findings are key evidence for establishing an atomic model of the Si(110)-(16×2) reconstruction, which indeed has a complex structure. Keywords: atomic force microscopy (AFM); noncontact atomic force microscopy (NC-AFM); Si
- regarding the atomic structure of the reconstruction that includes both pentagons and step edges is insufficient. In this study, the Si(110)-(16×2) reconstruction will be investigated by atomic force microscopy (AFM) at 78 K to directly observe the atomic arrangement of the reconstruction. In this work, we



PEG/PEI-functionalized single-walled carbon nanotubes as delivery carriers for doxorubicin: synthesis, characterization, and in vitro evaluation
Beilstein J. Nanotechnol. 2020, 11, 1728–1741, doi:10.3762/bjnano.11.155
- (AFM) measurements, different SWCNT dispersions (ethanol/ultrapure water = 1:1) with a concentration of 0.01% were dripped on freshly cleaved mica and observed using an AFM (Dimension Icon, Bruker AXS). Drug loading and encapsulation efficiency An amount of 50 mg of different SWCNT samples were
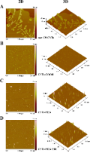
- diffraction patterns of the CNTs remain the same after conjugation with PEG and PEI, which indicate that the surface modification will not change the atomic structure of CNTs. The morphology of the different nanocarriers was observed using AFM after deposition on a mica substrate. The raw SWCNTs exhibit large
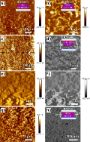
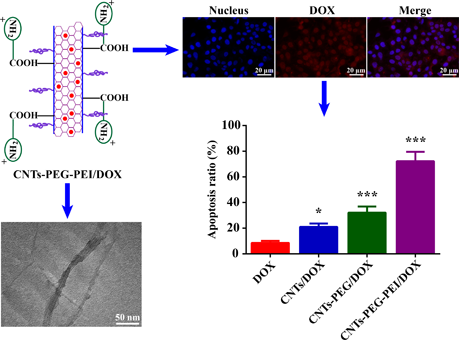
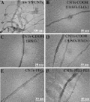
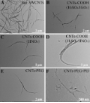
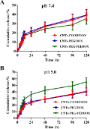
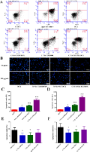
- : HNO3, d: H2SO4/HNO3; e: CNTs-PEG, f: CNTs-PEG-PEI). AFM images of (A) raw SWCNTs, (B) CNTs-COOH, (C) CNTs-PEG, and (D) CNTs-PEG-PEI. Cumulative release profiles of DOX from different nanocarriers in PBS at (A) pH 7.4 and (B) pH 5.0 (n = 3). Cytotoxicity of (A) different blank carriers and (B) DOX




Application of contact-resonance AFM methods to polymer samples
Beilstein J. Nanotechnol. 2020, 11, 1714–1727, doi:10.3762/bjnano.11.154
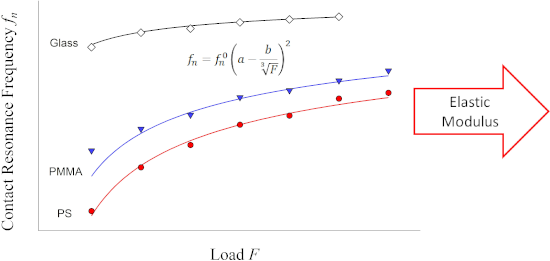
- Sebastian Friedrich Brunero Cappella Federal Institute for Material Research and Testing (BAM), Unter den Eichen 87, 12205 Berlin, Germany 10.3762/bjnano.11.154 Abstract Contact-resonance AFM (CR-AFM) has been used in recent years for the measurement of mechanical properties of rather stiff
- materials, such as ceramics or metals, but also of some polymers. Compared with other techniques providing information on the mechanical properties of a sample, notably force–distance curves, CR-AFM has a much shorter acquisition time. This compensates in part the incomplete theoretical understanding of the
- . Keywords: atomic force microscopy; contact resonance; mechanical properties; polymers; wear; Introduction The development of new materials for applications on the nanoscale, such as thin polymer films, demands a reliable determination of their mechanical properties. Atomic force microscopy (AFM) is a very


Out-of-plane surface patterning by subsurface processing of polymer substrates with focused ion beams
Beilstein J. Nanotechnol. 2020, 11, 1693–1703, doi:10.3762/bjnano.11.151
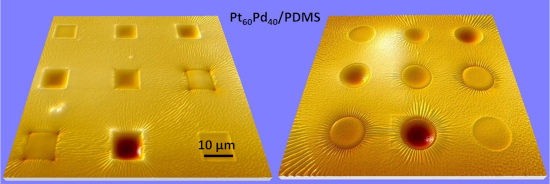
- microscopy (AFM) image and the corresponding depth profile for a surface region of the Pt60Pd40/PMMA sample irradiated with He+ FIB at a fluence of 1.0 × 1016 cm−2. It is evident that the irradiation homogeneously lowers the entire irradiated surface to a depth of approx. 80 nm. For convenience, we define
- cm−2, the values of the root-mean-square (RMS) roughness, measured with AFM in the irradiated areas, were approx. 0.7 and 4.4 nm for irradiation with He+ and Ga+ ions, respectively. The RMS roughness value of the pristine sample was approx. 0.6 nm. The irradiation with Ne+ ions also significantly
- of the cells in rows 1 and 2 in Figure 4a and confirmed by AFM imaging in Figure 4b. These effects are attributed to the accumulation of gases from radiolysis at the Au film/PMMA interface and to the pressure that becomes, at a certain fluence and at certain places, sufficiently high to delaminate


PTCDA adsorption on CaF2 thin films
Beilstein J. Nanotechnol. 2020, 11, 1615–1622, doi:10.3762/bjnano.11.144
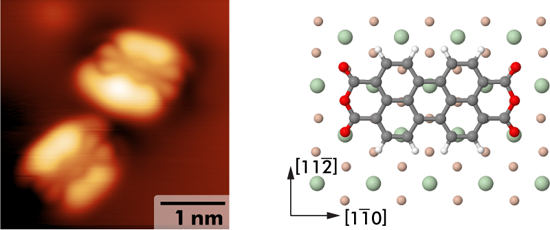
- [27][28][29]. PTCDA molecules were deposited from custom-built Knudsen cells heated to 290–300 °C. Samples were held at room temperature during deposition unless noted otherwise. STM data were acquired at 77 or 5 K using a ScientaOmicron qPlus LT AFM/STM operated by a MATRIX controller and an atom


Detecting stable adsorbates of (1S)-camphor on Cu(111) with Bayesian optimization
Beilstein J. Nanotechnol. 2020, 11, 1577–1589, doi:10.3762/bjnano.11.140
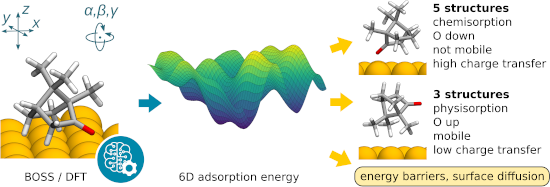
- electronic properties of the material. Assemblies of organic molecules on surfaces have been studied experimentally, for example with X-ray diffraction [4][5], scanning tunneling microscopy [6][7][8] and atomic force microscopy (AFM) [9][10][11]. These methods have a considerable resolution in imaging planar
- shortened as camphor) on the Cu(111) surface. Camphor is an exemplary case of a bulky molecule, which is difficult to image with microscopy. AFM experiments [35] have revealed various different conformers of camphor on Cu(111), which makes it ideal for benchmarking the BOSS method. Our objective is to
- observed in experiments. The adsorption of camphor on Cu(111) has been studied experimentally with AFM by Alldritt and co-workers [35]. In their images, they have observed various different adsorbate structures, which shows that camphor can adsorb on Cu(111) in multiple stable configurations. In the


Fabrication of nano/microstructures for SERS substrates using an electrochemical method
Beilstein J. Nanotechnol. 2020, 11, 1568–1576, doi:10.3762/bjnano.11.139
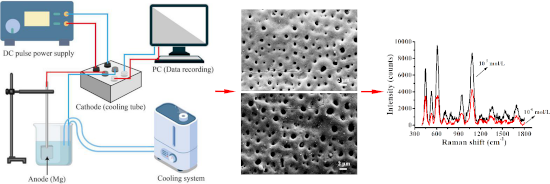
- over a 20 × 20 μm2 area. Before the tests, the Raman spectra were rectified using a standard Si substrate. A Raman intensity peak of 1362 cm−1 for R6G was chosen in the experiment. An atomic force microscopy (AFM) system (Dimension Icon, Bruker, Germany) was employed to detect the two-dimensional and
- that process. As a result, the average diameter of the pores increases as the duration of PEO duration increases. Figure 3 shows AFM images of the arrayed nanopores after fabrication with different treatment times. After 1 min, the nanopore diameter and depth were 0.7 ± 0.25 µm and 0.5 ± 0.16 µm
- 10 min, the nanopore diameter and depth were 7.2 ± 0.3 µm and 5 ± 0.5 µm, respectively, as shown in Figure 3d. Thus, a 10 min treatment time led to the formation of pores with microscale structure. A three-dimensional AFM image of arrayed nanopores after a treatment time of 5 min is shown in Figure


Design of V-shaped cantilevers for enhanced multifrequency AFM measurements
Beilstein J. Nanotechnol. 2020, 11, 1525–1541, doi:10.3762/bjnano.11.135
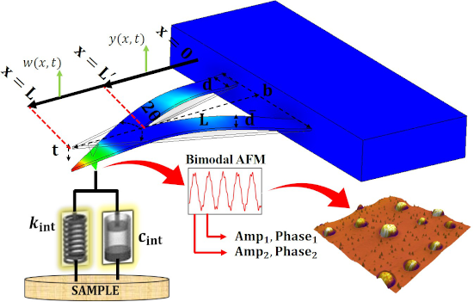
- microscopy (AFM) in soft matter characterization has expanded, the use of different types of cantilevers for these studies have also increased. One of the most common types of cantilevers used in soft matter imaging is V-shaped cantilevers due to their low normal spring constant. These types of cantilevers
- no studies on the static and dynamic behavior of V-shaped cantilevers in multifrequency AFM due to their complex geometry. In this work, the static and dynamic properties of V-shaped cantilevers are studied while investigating their performance in multifrequency AFM (specifically bimodal AFM). By
- dimensions, the optimum V-shaped cantilever that can provide the maximum phase contrast in bimodal AFM between gold (Au) and polystyrene (PS) is found. Based on this study, it is found that as the length of the cantilever increases the 2nd eigenmode phase contrast decreases. However, the base width exhibits


![[Graphic 4]](/bjnano/content/inline/2190-4286-11-135-i26.svg?max-width=637&scale=1.18182) = 15 µm, bref = 8...
= 15 µm, bref = 8...


![[Graphic 17]](/bjnano/content/inline/2190-4286-11-135-i39.svg?max-width=637&scale=1.18182) ) of V-shaped cantilevers for...
) of V-shaped cantilevers for...


Protruding hydrogen atoms as markers for the molecular orientation of a metallocene
Beilstein J. Nanotechnol. 2020, 11, 1432–1438, doi:10.3762/bjnano.11.127
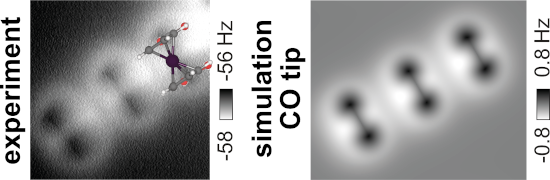
- acid (FDCA) molecules on bulk and thin film CaF2(111) surfaces with non-contact atomic force microscopy (NC-AFM). We use NC-AFM image calculations with the probe particle model to interpret this distinct shape by repulsive interactions between the NC-AFM tip and the top hydrogen atoms of the
- cyclopentadienyl (Cp) rings. Simulated NC-AFM images show an excellent agreement with experimental constant-height NC-AFM data of FDCA molecules at several tip–sample distances. By measuring this distinct dumbbell shape together with the molecular orientation, a strategy is proposed to determine the conformation
- employed for the investigation of both ordered and unordered molecular systems as well as of individual and isolated species [4][5][6]. For example, two different non-planar isomers of dibenzo[a,h]thianthrene molecules could be identified by high-resolution non-contact atomic force microscopy (NC-AFM) [7
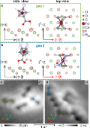


![[Graphic 10]](/bjnano/content/inline/2190-4286-11-127-i10.svg?max-width=637&scale=1.18182) row of FDCA molecules in geo 2. (a–c) Constant-height frequency-shi...
row of FDCA molecules in geo 2. (a–c) Constant-height frequency-shi...
On the frequency dependence of viscoelastic material characterization with intermittent-contact dynamic atomic force microscopy: avoiding mischaracterization across large frequency ranges
Beilstein J. Nanotechnol. 2020, 11, 1409–1418, doi:10.3762/bjnano.11.125
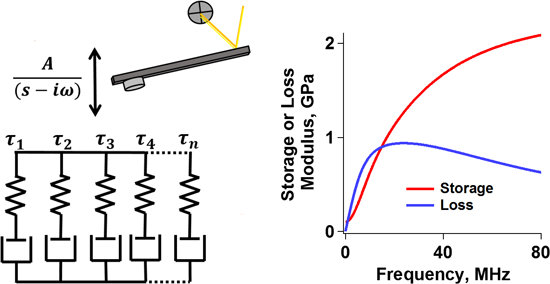
- Enrique A. Lopez-Guerra Santiago D. Solares The George Washington University, Department of Mechanical and Aerospace Engineering, Washington, DC 20052, USA Park Systems Inc., Santa Clara, CA, 95054, USA 10.3762/bjnano.11.125 Abstract Atomic force microscopy (AFM) is a widely use technique to
- response of which depends on the rate of application of the stresses imparted by the AFM tip. The mechanical response of these materials thus depends strongly on the frequency at which the characterization is performed, so much so that important aspects of behavior may be missed if one chooses an arbitrary
- characterization frequency regardless of the materials properties. In this paper we present a linear viscoelastic analysis of intermittent-contact, nearly resonant dynamic AFM characterization of such materials, considering the possibility of multiple characteristic times. We describe some of the intricacies


Atomic defect classification of the H–Si(100) surface through multi-mode scanning probe microscopy
Beilstein J. Nanotechnol. 2020, 11, 1346–1360, doi:10.3762/bjnano.11.119
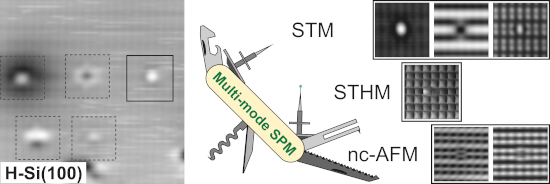
- Nanotechnology Research Centre, National Research Council Canada, Edmonton, Alberta, T6G 2M9, Canada 10.3762/bjnano.11.119 Abstract The combination of scanning tunnelling microscopy (STM) and non-contact atomic force microscopy (nc-AFM) allows enhanced extraction and correlation of properties not readily
- same side of two neighbouring dimers. Subsequently, the latter had been reassigned as an H, OH pair originating from dissociative attachment of a residual water molecule in the vacuum system [15][16][17]. Further insights became available by non-contact atomic force microscopy (nc-AFM), separating the
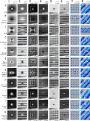
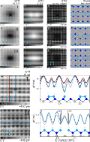
- of the H-terminated Si(100)-2 × 1 surface, its structural features, and defects. Six different scanning probe imaging modes are performed using both STM and nc-AFM. By combining the accessible information with probe particle simulations [23][24] (presented in Supporting Information File 1) of the



Controlling the proximity effect in a Co/Nb multilayer: the properties of electronic transport
Beilstein J. Nanotechnol. 2020, 11, 1336–1345, doi:10.3762/bjnano.11.118
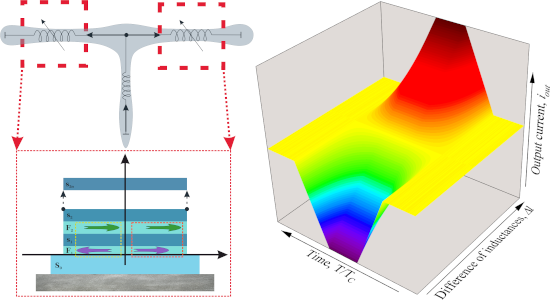
- interface of the bulk semiconductor electrode, with thickness LS = 10ξS. In addition, we considered the proximity effect of an artificial ferromagnetic material (AFM), consisting of alternating thin superconducting (LS = 1ξS) and ferromagnetic layers, with an exchange energy of H = 10TC. In an AFM, every
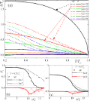
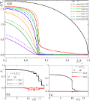
- parallel (solid lines) and antiparallel (dashed lines) magnetization orientations at low, T = 0.25TC (panel b), and high, T = 0.6TC (panel c), temperature values. The real part of F1(x) decreases inside the AFM almost exponentially, with a small step-like modulation in thin superconducting layers. In the
- , predicted in the model, for the pair potential in thin s-layers of a [Co(1.5 nm)/Nb(8 nm)/Co(2.5 nm)/Nb(8 nm)]3 AFM. For these superlattices, the possibility of switching between the P and AP cases, using a magnetic field with an intensity of ≈30 oersteds, has already been demonstrated [9]. The samples were



An atomic force microscope integrated with a helium ion microscope for correlative nanoscale characterization
Beilstein J. Nanotechnol. 2020, 11, 1272–1279, doi:10.3762/bjnano.11.111
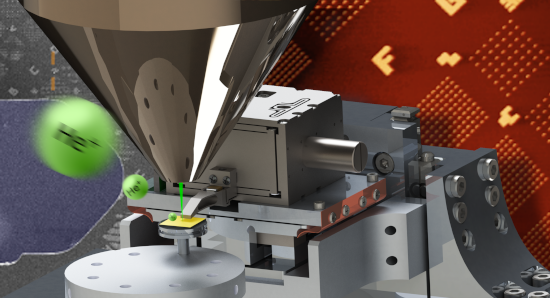
- -Zentrum Dresden-Rossendorf, Dresden 01328, Germany GETec Microscopy GmbH, Vienna 1220, Austria 10.3762/bjnano.11.111 Abstract In this work, we report on the integration of an atomic force microscope (AFM) into a helium ion microscope (HIM). The HIM is a powerful instrument, capable of imaging and
- machining of nanoscale structures with sub-nanometer resolution, while the AFM is a well-established versatile tool for multiparametric nanoscale characterization. Combining the two techniques opens the way for unprecedented in situ correlative analysis at the nanoscale. Nanomachining and analysis can be
- performed without contamination of the sample and environmental changes between processing steps. The practicality of the resulting tool lies in the complementarity of the two techniques. The AFM offers not only true 3D topography maps, something the HIM can only provide in an indirect way, but also allows